XMPro PivotGrid
•
0 gefällt mir•604 views

The document describes XMPivotGrid, an analytics tool that allows business users to analyze operational data and gain insights directly within workflow forms. It allows users to pivot and analyze data from ERP databases or OLAP cubes. Key features include analyzing data within workflows, re-using existing BI assets, and configuring pivot grids in the XMDesigner environment. The pivot grid supports OLAP data sources, unbound fields, drilling, charting, exporting, and making data more interactive and visual to improve decision making.

Empfohlen
Empfohlen
Weitere ähnliche Inhalte
Was ist angesagt?
Was ist angesagt? (19)
Andere mochten auch
Andere mochten auch (20)
Ähnlich wie XMPro PivotGrid
Ähnlich wie XMPro PivotGrid (20)
Kürzlich hochgeladen
Kürzlich hochgeladen (20)
XMPro PivotGrid
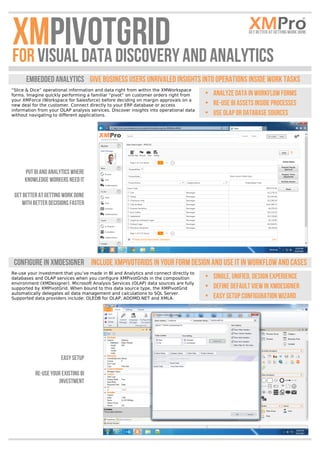
- 1. XMPivotGrid and Analytics FOR Visual Data Discovery Embedded Analytics Give business users unrivaled insights into operations inside work tasks “Slice & Dice” operational information and data right from within the XMWorkspace forms. Imagine quickly performing a familiar “pivot” on customer orders right from your XMForce (Workspace for Salesforce) before deciding on margin approvals on a new deal for the customer. Connect directly to your ERP database or access information from your OLAP analysis services. Discover insights into operational data without navigating to different applications. • Analyze data in workflow forms • Re-use BI assets inside processes • Use OLAP or database sources Put BI and Analytics where Knowledge workers need it Get Better at Getting work done with better decisions faster Configure in XMDesigner Include XMPivotGrids in your form design and use it in workflow and cases Re-use your investment that you’ve made in BI and Analytics and connect directly to databases and OLAP services when you configure XMPivotGrids in the composition environment (XMDesigner). Microsoft Analysis Services (OLAP) data sources are fully supported by XMPivotGrid. When bound to this data source type, the XMPivotGrid automatically delegates all data management and calculations to SQL Server. Supported data providers include: OLEDB for OLAP, ADOMD.NET and XMLA. Easy Setup Re-use your existing BI Investment • Single, Unified, Design Experience • Define Default View in XMDesigner • Easy Setup Configuration Wizard
- 2. Re-use BI Connect to Your database Tables or high Performance OLAP CUBES The XMPivotGrid is a comprehensive data analysis, data mining, and visual reporting component that are placed right in XMPro Workspace forms. It shows familiar "Excel-style" pivot views and users can break down raw data in any way they require by dragging column and row tags, as they would do in Excel (note: Microsoft Excel is not required). Microsoft Analysis Services (OLAP) data sources are fully supported by XMPivotGrid. When bound to such a data source, the pivot grid delegates all data management and calculations to the SQL Server and is ideal for more big data datasets. It increases XMPro iBOS performance when dealing with large datasets. It requests server-side data recalculation and then simply displays the downloaded result. The Pivot grid also supports Unbound Fields where users can create unbound fields and populate them with data as needs dictate. XMPrivotGrid further supports: • data drill-down to access underlying information with relevant access controls • charting embedded with the pivot to show trends information graphically • exporting data and results to reports and applications e.g. Microsoft Excel, PDF or HTML • group values to better interpretation of results • hierarchical data display - automatic tree structure when arranging rows and columns • automatic and manually calculated totals • multiple modes to sort field values • end-user data filtering capabilities Start using XMPivotGrid by accessing database tables without the need for OLAP cubes. This enables business analysts and users to pilot the decision support requirements before creating dedicated OLAP cubes. Changing over from database tables to OLAP cubes is a simple operation in XMDesigner and end-users will not even be aware of the changes, other than performance improvements. This prevents expensive analytic development before understanding the real user requirements. • Familiar “excel-Style” Pivots • Pilot Analytics before building OLAP • Let Users “Slice & Dice” own views Rich Visual Experience Visual KPIS and trends improve decision-making and customer service XMPro iBOS extends analytical analysis of the day-to-day operational tasks that people do. Whether it is simple workflows, dynamic and unstructured processes or adaptive cases that require continuous alignment with business goals, XMPivotGrid makes it easy to make better decisions faster. See visual trends and KPIs to anticipate potential events that may impact the performance of your business. XMPro’s XMPivotGrid makes process results and outcomes more predictable. • Create Graphs from Pivot Data • Export results to PDF, Excel, ETC. • Filter and search large datasets North America 10000 North Central Expressway, Suite 400, Dallas, TX 75231 P (+1) 214 890 4093 Asia Pacific 16/124 Walker Street North Sydney, 2060 P +61 (0) 2 8412 1000 UK & Europe Gartner does not endorse any vendor; product or service depicted in its research publications, and does not advise technology users to select only those vendors with the highest ratings. Gartner research publications consist of the opinions of Gartner's research organization and should not be construed as statements of fact. Gartner disclaims all warranties, expressed or implied, with respect to this research, including any warranties of merchantability or fitness for a particular purpose. 83453538382345012 Africa 5/201 Great Portland St London, W1W5AB P +44 (0) 207 268 9810 A/17 Muswell Rd South Bryanston, Johannesburg P +27 (0) 11 540 0250