Financial momitor, june 4, 2010
•
0 gefällt mir•262 views

Dundee Financial Monitor by William Tharp

Empfohlen
Empfohlen
Weitere ähnliche Inhalte
Was ist angesagt?
Was ist angesagt? (14)
Andere mochten auch
Ähnlich wie Financial momitor, june 4, 2010
Ähnlich wie Financial momitor, june 4, 2010 (17)
Mehr von Leo Lee
Kürzlich hochgeladen
Kürzlich hochgeladen (20)
Financial momitor, june 4, 2010
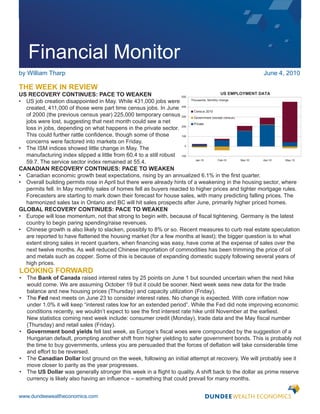
- 1. Financial Monitor by William Tharp June 4, 2010 THE WEEK IN REVIEW US RECOVERY CONTINUES: PACE TO WEAKEN US EMPLOYMENT DATA 500 • US job creation disappointed in May. While 431,000 jobs were Thousands, Monthly change created, 411,000 of those were part time census jobs. In June 400 Census 2010 of 2000 (the previous census year) 225,000 temporary census 300 Government (except census) jobs were lost, suggesting that next month could see a net Private loss in jobs, depending on what happens in the private sector. 200 This could further rattle confidence, though some of those 100 concerns were factored into markets on Friday. 0 • The ISM indices showed little change in May. The manufacturing index slipped a little from 60.4 to a still robust -100 Jan-10 Feb-10 Mar-10 Apr-10 May-10 59.7. The service sector index remained at 55.4. CANADIAN RECOVERY CONTINUES: PACE TO WEAKEN • Canadian economic growth beat expectations, rising by an annualized 6.1% in the first quarter. • Overall building permits rose in April but there were already hints of a weakening in the housing sector, where permits fell. In May monthly sales of homes fell as buyers reacted to higher prices and tighter mortgage rules. Forecasters are starting to mark down their forecast for house sales, with many predicting falling prices. The harmonized sales tax in Ontario and BC will hit sales prospects after June, primarily higher priced homes. GLOBAL RECOVERY CONTINUES: PACE TO WEAKEN • Europe will lose momentum, not that strong to begin with, because of fiscal tightening. Germany is the latest country to begin paring spending/raise revenues. • Chinese growth is also likely to slacken, possibly to 8% or so. Recent measures to curb real estate speculation are reported to have flattened the housing market (for a few months at least); the bigger question is to what extent strong sales in recent quarters, when financing was easy, have come at the expense of sales over the next twelve months. As well reduced Chinese importation of commodities has been trimming the price of oil and metals such as copper. Some of this is because of expanding domestic supply following several years of high prices. LOOKING FORWARD • The Bank of Canada raised interest rates by 25 points on June 1 but sounded uncertain when the next hike would come. We are assuming October 19 but it could be sooner. Next week sees new data for the trade balance and new housing prices (Thursday) and capacity utilization (Friday). • The Fed next meets on June 23 to consider interest rates. No change is expected. With core inflation now under 1.0% it will keep “interest rates low for an extended period”. While the Fed did note improving economic conditions recently, we wouldn’t expect to see the first interest rate hike until November at the earliest. New statistics coming next week include: consumer credit (Monday), trade data and the May fiscal number (Thursday) and retail sales (Friday). • Government bond yields fell last week, as Europe’s fiscal woes were compounded by the suggestion of a Hungarian default, prompting another shift from higher yielding to safer government bonds. This is probably not the time to buy governments, unless you are persuaded that the forces of deflation will take considerable time and effort to be reversed. • The Canadian Dollar lost ground on the week, following an initial attempt at recovery. We will probably see it move closer to parity as the year progresses. • The US Dollar was generally stronger this week in a flight to quality. A shift back to the dollar as prime reserve currency is likely also having an influence – something that could prevail for many months. www.dundeewealtheconomics.com
- 2. RECENT CANADIAN ECONOMIC DATA CANADA GROSS DOMESTIC PRODUCT 12 10 8 Canadian GDP had its best 6 quarter in a decade, rising by an 4 annualized 6.1% in the first quarter. 2 Consumption rose about 4.5%. Our 0 detailed table will follow at a later -2 date (Statscan now delays releasing -4 some of the data for several weeks). -6 -8 annualized growth rate Last quarter: 2010 Q1 -10 80 82 84 86 88 90 92 94 96 98 00 02 04 06 08 10 CANADA JOB CREATION 125 100 000s monthly change 75 50 Canada’s job creation (24,700), 25 though far less than reported for 0 April, was nonetheless quite solid -25 in May. The unemployment rate for -50 3-month moving May was unchanged at 8.1%. -75 average -100 -125 Last month: May 2010 -150 Jan-07 Jul-07 Jan-08 Jul-08 Jan-09 Jul-09 Jan-10 CANADA BUILDING PERMITS 375 350 325 300 Building permits rose in value 275 by 5.4% in April, following a strong 250 12.3% gain in March. However 225 the gain was entirely in the non- 200 175 residential area, which more than 150 made up for a decline in residential 125 permits. 100 000s dwelling units Last month: April 2010 75 70 72 74 76 78 80 82 84 86 88 90 92 94 96 98 00 02 04 06 08 10 www.dundeewealtheconomics.com
- 3. CURRENT STATE OF AFFAIRS by Martin Murenbeeld ECRI LEADING INDICATOR UNEMPLOYMENT CLAIMS COPPER 146 30 700 450 ECRI 650 400 140 20 600 350 134 10 US recession 550 300 128 0 500 250 122 -10 450 200 US recession 400 150 116 -20 Percent change 350 100 Year-over-year 52-week US recession 110 -30 moving 300 50 average 104 -40 250 0 02 03 04 05 06 07 08 09 10 02 03 04 05 06 07 08 09 10 02 03 04 05 06 07 08 09 10 Source: Economic Cycle Research Institute Source: US Department of Labour Source: Thomson Datastream LIBOR-OIS AND TED SPREAD VOLATILITY 6 90 OIS (overnight indexed swap) VIX (Chicago Board Options Exchange Ted Spread (3-month eurodollar deposit – 80 S&P 500 Volatility Index) The top three charts 5 US T-bill) 70 suggest the recovery in 4 60 the US and elsewhere 3 50 is “pausing”. 40 2 30 LIBOR-OIS TED spread 20 1 spread 10 0 06 07 08 09 10 0 06 07 08 09 10 The middle two Source: Thomson Datastream Source: Thomson Datastream charts point to extreme nervousness in financial markets, but much less STOCK MARKETS RUPEE AND REAL 6400 22500 54 2.75 so than in 2008-2009. Brazilian Real 5600 20000 51 2.50 BSE (India) 4800 17500 48 2.25 4000 15000 45 2.00 3200 12500 The bottom two 2400 10000 42 1.75 charts suggest key Shanghai 1600 Composite 7500 39 1.50 emerging markets are Indian Rupee volatile, with tendencies 800 5000 36 1.25 06 07 08 Source: Thomson Datastream 09 10 06 07 08 Source: Thomson Datastream 09 10 to weakness. www.dundeewealtheconomics.com
- 4. POLICY INTEREST RATES US FED TARGET RATE 6 Percent The Bank of Canada raised interest rates by 25 points (0.25%) on June 1 as its first 5 step toward normalization. Will July 20 see a follow-up move? It could come that soon, 4 though the Bank itself sounded fairly cautious in announcing the June 1 move. It will want to 3 see the next month’s worth of data, particularly 2 the housing market and domestic inflation, but also get a sense of what is happening in the US 1 and abroad. At the moment, a delay for several months is a possibility, especially if inflation Last date: June 4, 2010 0 Weekly comes in below forecast. However, barring a 02 03 04 05 06 07 08 09 10 major change in the economy, headline inflation appears headed for 2% in September (after first falling to 1% or less in June). At this point we look for another 25 point rate hike not BANK OF CANADA TARGET RATE 5.0 later than October 19. While nothing is set in Percent 4.5 cement we expect the Bank of Canada to raise rates by 0.25% per quarter for the next five or 4.0 six quarters, bringing the overnight target to 3.5 about 2.00% from the current 0.50%. We might 3.0 see more but at present we continue to have 2.5 a cautious eye on deflationary pressures in 2.0 the US, much of Europe, and Japan. If slower global growth ahead means that oil prices fail 1.5 to rise appreciably, or fall further, and the steam 1.0 continues to come out of Canada’s housing 0.5 market then worries about inflation in Canada Weekly Last date: June 4, 2010 0.0 will evaporate, putting a lower ceiling on 02 03 04 05 06 07 08 09 10 domestic policy rates than many expect. 3-MONTH LIBOR SHORT-TERM INTEREST RATES 7 14 Percent Percent, 3-month Treasury Bills 6 12 5 10 4 8 Canada 3 6 2 4 1 2 US Daily Last date: June 3, 2010 Weekly Last date: June 4, 2010 0 0 Jul-07 Dec-07 Jun-08 Dec-08 Jun-09 Dec-09 Jun-10 90 92 94 96 98 00 02 04 06 08 10 www.dundeewealtheconomics.com
- 5. LONGER TERM BOND YIELDS US TREASURY YIELDS 5.5 In the US the 10-year maturity yield fell to 3.20% Percent from 3.29%, while the 30-year yield dropped to 5.0 4.13% from 4.21%. The Canadian 10-year yield 30-year slipped to 3.28% from 3.31%. The main mover of 4.5 markets continued to be concerns about sovereign 4.0 European debt and a related continuing slump in the Euro. Or so it appeared. But one could also 3.5 compose a reasonable story around the continuing 10-year slippage in core American CPI (now down to 0.9% 3.0 and still falling), stagnation (if not worse) in oil 2.5 prices, and the prospects for somewhat weaker North American, if not global, growth in the second Daily, Last date: June 4, 2010 2.0 half of 2010. While yields don’t look especially Jul-07 Jan-08 Jul-08 Jan-09 Jul-09 Jan-10 Jun-10 attractive at the moment, it could be some months before something more appetizing appears – and there are no guarantees. A new 10 and 30-year auction next week may raise yields temporarily. CANADA GOVERNMENT BOND YIELDS 5.0 Percent BBB yields ended at 5.05% on Thursday, not much changed from a week earlier. High yielder 4.5 yields rose further, ending at 9.21% from 9.14% a 30-year week before. In an environment where growth is 4.0 apt to slow at least somewhat, and bank lending in Europe has become somewhat constrained, riskier 3.5 issues are being avoided by some investors. That 10-year might be a buying opportunity, but yields had fallen 3.0 rather a lot a few weeks ago. 2.5 10-year Government Bond Yields (%) Jun 4 Apr 30 Change Daily, Last date: June 4, 2010 2.0 US 3.20 3.66 -0.46 Jul-07 Jan-08 Jul-08 Jan-09 Jul-09 Jan-10 Jun-10 UK 3.51 3.86 -0.35 Canada 3.28 3.65 -0.37 Germany 2.57 3.02 -0.45 Japan 1.28 1.29 -0.01 BBB CORPORATE BOND YIELDS 10.5 8.7 US HIGH-YIELD BONDS BBB Yield BBB – US 10-year rate spread 24 22 10.0 8.0 Merrill Lynch High-Yielding 22 Corporate Yield 20 9.5 7.3 20 18 9.0 6.6 18 16 8.5 5.9 16 14 8.0 5.2 7.5 4.5 14 12 7.0 3.8 12 10 6.5 3.1 10 8 6.0 2.4 8 6 5.5 1.7 6 Merrill Lynch High Yielding Corporate – 4 US 10-year rate spread 5.0 1.0 4 2 Percent Daily, Last date: June 3, 2010 Percent Daily, Last date: June 3, 2010 4.5 0.3 2 0 Jul-07 Dec-07 Jun-08 Dec-08 Jun-09 Dec-09 Jun-10 Jul-07 Dec-07 Jun-08 Dec-08 Jun-09 Dec-09 Jun-10 www.dundeewealtheconomics.com
- 6. 10-YEAR BOND YIELDS AND SPREADS FRANCE GERMANY 15 9 15 9 12 6 12 6 10-year government bond yield 10-year government bond yield 9 3 9 3 France 10-year minus US 10-year Germany 10-year minus US 10-year 6 0 6 0 3 -3 3 -3 Weekly, Last Date : June 3, 2010 Weekly, Last Date : June 3, 2010 0 -6 0 -6 85 87 89 91 93 95 97 99 01 03 05 07 09 85 87 89 91 93 95 97 99 01 03 05 07 09 GREECE IRELAND 15 9 15 9 10-year government bond yield 12 6 12 6 Greece 10-year minus US 10-year Ireland 10-year minus US 10-year 9 3 9 3 6 0 6 0 10-year government bond yield 3 -3 3 -3 Weekly, Last Date : June 3, 2010 Weekly, Last Date : June 3, 2010 0 -6 0 -6 85 87 89 91 93 95 97 99 01 03 05 07 09 85 87 89 91 93 95 97 99 01 03 05 07 09 ITALY PORTUGAL 15 9 15 9 10-year government bond yield 12 6 12 6 Italy 10-year minus US 10-year Portugal 10-year minus US 10-year 9 3 9 3 6 0 6 0 10-year government bond yield 3 -3 3 -3 Weekly, Last Date : June 3, 2010 Weekly, Last Date : June 3, 2010 0 -6 0 -6 85 87 89 91 93 95 97 99 01 03 05 07 09 85 87 89 91 93 95 97 99 01 03 05 07 09 SPAIN UK 15 9 15 9 10-year government bond yield 10-year government bond yield 12 6 12 6 9 3 9 3 Spain 10-year minus US 10-year UK 10-year minus US 10-year 6 0 6 0 3 -3 3 -3 Weekly, Last Date : June 3, 2010 Weekly, Last Date : June 3, 2010 0 -6 0 -6 85 87 89 91 93 95 97 99 01 03 05 07 09 85 87 89 91 93 95 97 99 01 03 05 07 09 www.dundeewealtheconomics.com
- 7. STOCK MARKETS by William Tharp and Chantelle Schieven S&P/TSX COMPOSITE Percent changes 16000 15000 1-week 4-week 52-week 14000 S&P/TSX TSX -0.9 -1.1 8.7 13000 50-Day Moving Average 200-Day Moving Average DJI -2.0 -4.3 12.9 12000 S&P 500 -2.3 -4.1 12.5 11000 NASDAQ -1.7 -2.1 19.4 10000 9000 Equity markets tumbled on Friday, pushing the 8000 TSX down 101.83 points for the week to close at 7000 11569.61. The DJI declined 204.66 points to close 6000 at 9931.97 The S&P 500 closed at 1064.88, a 24.53 Last Date: June 4, 2010 5000 point decline, and the NASDAQ declined 37.87 02 03 04 05 06 07 08 09 10 points to close at 2219.17. Equity markets declined on Friday as disappointment over a weaker than expected US job DOW JONES INDUSTRIALS report and new worries about the sovereign debt of 15000 Europe sent investors to the safety of the US dollar. 14000 Late Thursday a Hungarian official rattled markets 13000 by suggesting that it wouldn’t be out of the question DJIA 50-Day Moving Average to talk about a default. Any hint of default from a 12000 200-Day Moving Average government official plays into the market’s greatest 11000 fear at the moment. And in this case the comment 10000 opened a new front - Hungary and Eastern Europe. With international banking regulators pondering 9000 a move to require large banks to have even more 8000 capital to cushion any future losses, banks received 7000 an added jolt. Last Date: June 4, 2010 6000 Note that the 200-day moving average has 02 03 04 05 06 07 08 09 10 been broken by all markets for the first time since 2007-2008! S&P 500 NASDAQ 1600 3000 1500 2750 1400 S&P 500 Nasdaq 50-Day Moving Average 2500 50-Day Moving Average 1300 200-Day Moving Average 200-Day Moving Average 1200 2250 1100 2000 1000 1750 900 1500 800 700 1250 Last Date: June 4, 2010 Last Date: June 4, 2010 600 1000 02 03 04 05 06 07 08 09 10 02 03 04 05 06 07 08 09 10 www.dundeewealtheconomics.com
- 8. DOLLAR CURRENCIES CANADIAN DOLLAR CANADIAN DOLLAR 110 101 US cents/Cdn$ US Cents/Cdn$ 105 100 100 99 95 98 90 97 85 96 80 95 75 70 94 65 93 Last date: June 4, 2010 Daily Daily: April 30, 2010 to June 4, 2010 60 92 03 04 05 06 07 08 09 10 04/30 05/07 05/14 05/21 05/28 The Canadian Dollar ended at 94.27, down from 95.07 the previous week. Both oil and copper prices US DOLLAR INDEX tumbled on concerns that global growth would slow 110 – as well as on concerns that China was importing Daily 105 US Dollar Index – EFXR0 less in the commodity area as domestic production (Yen, Pound, Euro, Cdn$) ramped up, particularly in the case of metals. As 100 well Chinese policy is shifting increasingly to fuel 95 efficiency/conservation. And being a Communist government, switching from gasoline to electrical 90 cars is apt to proceed much more rapidly than 85 in democratic countries which have the luxury of 80 debating for years. 75 The Australian Dollar closed at 82.20, down quite 70 sharply from last week’s 84.75. Australia’s commodity January 1999 = 100 Last date: June 4, 2010 exports to China stand to be hurt more than Canada’s 65 by rising Chinese commodity production. First quarter 03 04 05 06 07 08 09 10 Australian growth slipped to 0.5% from 1.1% in the previous quarter (figures are not annualized). AUSTRALIAN DOLLAR AUS/CDN 105 1.35 US cents/Aus$ Aus$/Cdn$ 100 1.30 95 1.25 90 1.20 85 80 1.15 75 1.10 70 1.05 65 1.00 60 55 0.95 Daily Last date: June 4, 2010 Daily Last date: June 4, 2010 50 0.90 03 04 05 06 07 08 09 10 03 04 05 06 07 08 09 10 www.dundeewealtheconomics.com
- 9. EUROPEAN CURRENCIES EURO EURO 1.7 1.36 US$/Euro US$/Euro 1.6 1.34 1.32 1.5 1.30 1.4 1.28 1.3 1.26 1.2 1.24 1.1 1.22 1.0 1.20 Daily Last date: June 4, 2010 Daily: April 30, 2010 to June 4, 2010 0.9 1.18 03 04 05 06 07 08 09 10 04/30 05/07 05/14 05/21 05/28 The Pound rose marginally, while the Euro suffered another significant fall. The euro is likely SWISS FRANC 0.9 to slip further against the US dollar in the months Swiss Franc/US$ ahead, but the pound is gaining some support from an 1.0 improving longer term yield spread. The euro looks set for continuing declines from 1.1 • increased central bank liquidity • ongoing worries about eventual sovereign default 1.2 • weak domestic consumer spending aggravated by fiscal tightening 1.3 • central bank reserve currency shifts 1.4 The latest significant worries to materialize were (1) Spain’s large $38 billion debt refinancing coming in Last date: June 4, 2010 1.5 Daily July, (2) A Hungarian official’s musing about a possible 03 04 05 06 07 08 09 10 Hungarian default, and (3) a report that Iran’s central bank was shifting out of euros and back to US dollars, something that must be tempting for many. POUND STERLING POUND STERLING 220 156 US Cents/Pound US Cents/Pound 155 210 154 200 153 152 190 151 180 150 149 170 148 147 160 146 150 145 144 140 143 Daily Last date: June 4, 2010 Daily: April 30, 2010 to June 4, 2010 130 142 03 04 05 06 07 08 09 10 04/30 05/07 05/14 05/21 05/28 www.dundeewealtheconomics.com
- 10. ASIAN CURRENCIES JAPANESE YEN 89 JAPANESE YEN 80 Yen/US$ Yen/US$ 85 90 90 95 91 100 92 105 93 110 115 94 120 95 125 Daily Last date: June 4, 2010 Daily: April 30, 2010 to June 4, 2010 130 96 03 04 05 06 07 08 09 10 04/30 05/07 05/14 05/21 05/28 The Yen closed on Friday at 91.7, weaker than last week’s 90.9, the return of risk aversion on Friday RUPEE notwithstanding. The presumed new Prime Minister, 38 Rupee/US$ Naoto Kan, is said to favor a weaker yen. 40 The Renminbi continues to trade above 6.83 for 42 the occasional hour or two before reverting to sub 44 6.83. It closed this week at 6.829, marginally stronger than last week’s 6.831. The moves hint that the 46 renminbi is not set to be revalued in the immediate 48 future. Both of China’s purchasing managers’ indices fell in May but this might not portend future economic 50 growth weakness as the pattern normally occurs 52 in May (even though the data are supposed to be Daily Last date: June 4, 2010 seasonally adjusted). 54 03 04 05 06 07 08 09 10 The Indian Rupee closed weaker at 46.88, down from 46.32, despite first quarter economic growth coming in at a robust 8.6%. RENMINBI (YUAN) RENMINBI (YUAN) 6.6 6.822 RMB/US$ RMB/US$ 6.8 6.824 7.0 6.826 7.2 7.4 6.828 7.6 6.830 7.8 6.832 8.0 8.2 6.834 Daily Last date: June 4, 2010 Daily: April 30, 2010 to June 4, 2010 8.4 6.836 03 04 05 06 07 08 09 10 04/30 05/07 05/14 05/21 05/28 Views contained in this report regarding a particular company, security, industry or market sector are the views of the writer and do not necessarily represent the views of DundeeWealth Inc., its affiliates and subsidiaries. Views expressed should not be considered a recommendation to buy or sell nor should they be relied upon as investment advice. Information contained in this report is current as of the date of publication and has been obtained from third party sources believed to be reliable. DundeeWealth Inc., its affiliates and subsidiaries does not warrant or make any representations regarding the use or the results of the information contained herein in terms of its correctness, accuracy, timeliness, reliability, or otherwise, and does not accept any responsibility for any loss or damage that results from its use. www.dundeewealtheconomics.com