Blood flow simulation for clinical applications
•Als PPTX, PDF herunterladen•
0 gefällt mir•110 views

"Blood flow simulation for clinical applications" by Dr Irene Vignon-Clementel, Directrice de recherche @Inria Abstract : The dynamics of how blood flows into our body can be numerically simulated. Such simulations provide an 'augmented intelligence' to better understand cardiovascular and organ disease and plan their treatment.

Empfohlen
Weitere ähnliche Inhalte
Ähnlich wie Blood flow simulation for clinical applications
Ähnlich wie Blood flow simulation for clinical applications (20)
Mehr von Paris Women in Machine Learning and Data Science
Mehr von Paris Women in Machine Learning and Data Science (20)
Kürzlich hochgeladen
Kürzlich hochgeladen (20)
Blood flow simulation for clinical applications
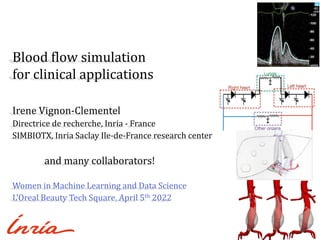
- 1. Blood flow simulation for clinical applications Irene Vignon-Clementel Directrice de recherche, Inria - France SIMBIOTX, Inria Saclay Ile-de-France research center and many collaborators! Women in Machine Learning and Data Science L’Oreal Beauty Tech Square, April 5th 2022 In order to survey a potential micro metastatic spread of the disease, samples from bone marrow, peripheral blood and portal blood will be obtained from all Ltx study subjects for later analyses. Tumour and normal tissue samples from explanted liver and from hepatic lymph nodes will be obtained for determination of lymphocyte infiltration (regulatory T-cells), micro-metastatic disease and micro-array analyses. 4.1. Combined liver resection and liver transplantation Total hepatectomy will be performed in 2 steps. First, a resection of the liver segments 1-3 is performed, carefully avoiding dividing through tumor affected liver tissue. If needed, additional resection into segment 4 may be perfomed The left portal, arterial and bile duct branches are identified and divided. The Right liver remnant should be fully mobilized to facilitate the later second stage hepatectomy. The volume of the liver remnant following resection should be ≥ 40%.of standard liver volume. Standard liver volume is calculated as: SLV= 1072.8 * body surface area (m2)-345.7 (23) Directly following resection, the patients receive a liver segments 2+3 from a deceased donor. The donor segments will be placed orthotropically. The graft liver vein is anastomosed to the orifice of the left liver vein in the recipient with a triangulation technique. The graft portal vein is anastomosed in an end to side fashion to the main portal trunk and the artery end to side to the common hepatic artery (figure). The reason for this is that this will obviate the need for complex hilar dissection at the second stage hepatectomy and also reduce the risk of complications to the liver remnant at the first operation. Biliary reconstruction is performed as a Roux-en-Y hepatico-jejunostomy. A t l e a s t 5 m i n u t e s a f t e r revascularization a pressure catheter is placed in the portal vein. Pressure is monitored for 5 minutes during basal conditions and during portal clamping of the portal vein d i s t a l t o t h e g r a f t p o r t a l anastomosis. At least three repeated measurements are performed. If the pressure is stable < 20 mmHg, the portal vein to the liver remnant is closed. If the pressure is > 20 mmHg during clamping, the splenic arery is ligated and pressure measurements repeated. If the pressure still exceeds 20 mmHg, a banding of the portal vein to the liver remnant is performed by creation of a stenosis resulting in a stable portal pressure of 10-20 mmHg. If this is not possible, e temporal portocaval shunt may be considered. This provedure is however not very likely to be needed, since the cohort of patients with colorectal liver metastases normally do not have portal hypertension and a hyperdynamic splanchnic circulation. The diversion of portal flow to the graft is expected to result in enhanced proliferation of the graft during the course of 2-4 weeks after combined liver resection and liver transplantation without causing graft injury and small-for-size syndrome due to portal hyperperfusion (24, 25). CT scans with volumetry of the transplanted segment is performed at postoperative day1, 7,14, 21 and 28. As soon as the donor graft has obtained a size of approximately 0,75-0.80% of body weight,or > 35-40% of the recipients standard liver volume (SLV) a second stage hepatectomy of the liver remnant is performed, leaving only the donor segments in place.
- 2. Multi-level analysis, flow & transport modeling Collaboration DKFZ, Heidelberg U. hosp – Inria Congenital heart disease: surgical planning, development Collaboration Stanford U. / Children’s hosp. & Inria Collaborations UCSD – Berkeley - Inria & Air Liquide Santé International - Inria Design of new percutaneous device (POD) Collaboration Necker Children’s hosp., France & Inria DWI Cancer: model-based image analysis Collaboration Cornell U. & Inria Respiratory flow & transport in diseases 50 µm 5 cm
- 3. 3 Cardiovascular system heart beat (1s) From Prof. Gunther Von Hagens “Body Worlds” exhibition catalogue Property Density Viscosity Blood 103 4 10-3 SI units Kg.m-3 Pa.s I. Vignon-Clementel 3
- 4. MULTI-LEVEL MATHEMATICAL MODELS & PATIENT-SPECIFIC SIMULATIONS Methods 100 000 km
- 5. Mathematical biofluid models: physics & IA I. Vignon-Clementel 5 Math & numerical complexity Precision rigid walls or FSI 0D 3D 1D pressure voltage flowrate current
- 6. To each biomedical application its model I. Vignon-Clementel 6 Math & numerical complexity Précision 0D 3D 1D In order to survey a potential micro metastatic spread of the disease, samples from bone marrow, peripheral blood and portal blood will be obtained from all Ltx study subjects for later analyses. Tumour and normal tissue samples from explanted liver and from hepatic lymph nodes will be obtained for determination of lymphocyte infiltration (regulatory T-cells), micro-metastatic disease and micro-array analyses. 4.1. Combined liver resection and liver transplantation Total hepatectomy will be performed in 2 steps. First, a resection of the liver segments 1-3 is performed, carefully avoiding dividing through tumor affected liver tissue. If needed, additional resection into segment 4 may be perfomed The left portal, arterial and bile duct branches are identified and divided. The Right liver remnant should be fully mobilized to facilitate the later second stage hepatectomy. The volume of the liver remnant following resection should be ≥ 40%.of standard liver volume. Standard liver volume is calculated as: SLV= 1072.8 * body surface area (m2)-345.7 (23) Directly following resection, the patients receive a liver segments 2+3 from a deceased donor. The donor segments will be placed orthotropically. The graft liver vein is anastomosed to the orifice of the left liver vein in the recipient with a triangulation technique. The graft portal vein is anastomosed in an end to side fashion to the main portal trunk and the artery end to side to the common hepatic artery (figure). The reason for this is that this will obviate the need for complex hilar dissection at the second stage hepatectomy and also reduce the risk of complications to the liver remnant at the first operation. Biliary reconstruction is performed as a Roux-en-Y hepatico-jejunostomy. A t l e a s t 5 m i n u t e s a f t e r revascularization a pressure catheter is placed in the portal vein. Pressure is monitored for 5 minutes during basal conditions and during portal clamping of the portal vein d i s t a l t o t h e g r a f t p o r t a l anastomosis. At least three repeated measurements are performed. If the pressure is stable < 20 mmHg, the portal vein to the liver remnant is closed. If the pressure is > 20 mmHg during clamping, the splenic arery is ligated and pressure measurements repeated. If the pressure still exceeds 20 mmHg, a banding of the portal vein to the liver remnant is performed by creation of a stenosis resulting in a stable portal pressure of 10-20 mmHg. If this is not possible, e temporal portocaval shunt may be considered. This provedure is however not very likely to be needed, since the cohort of patients with colorectal liver metastases normally do not have portal hypertension and a hyperdynamic splanchnic circulation. The diversion of portal flow to the graft is expected to result in enhanced proliferation of the graft during the course of 2-4 weeks after combined liver resection and liver transplantation without causing graft injury and small-for-size syndrome due to portal hyperperfusion (24, 25). CT scans with volumetry of the transplanted segment is performed at postoperative day1, 7,14, 21 and 28. As Precision
- 7. Parameterization: heterogeneous measurements I. Vignon-Clementel 7 Direct or surrogate pressure, flow or velocity measurements 0 20 40 60 80 100 120 0 0.1 0.2 0.3 0.4 0.5 0.6 Time (s) Volume Flow Rate (cc/s) Doppler ultrasound (max) velocities Catheterization PC-MRI flow rate
- 8. Challenges of subject-specific parameterization • Hemodynamics data (pressure, flow) are not necessarily acquired where boundary (forcing) conditions need to be prescribed • Uncertainty in their acquisition • Often too few to identify all parameters • Usually not taken simultaneously: not synchronized in time and at different heart rates • Computational complexity for parameter identification need to be coherent with available amount of information I. Vignon-Clementel 8
- 9. COMBINING SIMULATIONS & MACHINE LEARNING Acquired aortic disease
- 10. Abdominal aortic aneurysms: clinical overview I. Vignon-Clementel 10 • Localized expansion of the arterial wall • Usually asymptomatic • If ruptures: mortality > 80% (US CDC) • Prevalence : ~4% of the population • 14th leading cause of death in the USA • Male (↘incidence for women but ↗ rupture risk) • Hypertension • … Treatment (ideally only for high risk patients) • Stent-graft • Open-surgery Can we predict AAA progression? (mm)
- 11. Process of AAA development I. Vignon-Clementel 11 DEFORMATION • Mecano-adaptation • Shift of elastin to collagen ratio WALL DEGRADATION • ILT promotes arterial cell hypoxia and inflammation INTRALUMINAL THROMBUS (ILT) GROWTH • Platelet activation in high shear zones • Platelet deposition in stagnation zones • Increased platelet adhesion on ILT and low WSS zones FLOW ALTERATION • Transport topology • Wall Shear Stress AAA follow-up on 2 patients: ~ 6 months between each
- 12. Methods • 138 scans (32 patients with >3 consecutive scans) • Lumen & thrombus (ILT) segmentations • CFD • Pulsatile 3D-0D simulations • Rigid walls (ok for diseased) • Postprocessing (global and local patch-wise quantities) • Morphology • Hemodynamics I. Vignon-Clementel 12
- 13. Building a risk predictor: classifier 13 PCA Repeated k-fold Neural-network1 1Multi-Layer Perceptron (sknn : Theano + Scikit-learn) • Definition of risk (time n+1) Dmax (n+1) > 50 mm (55 mm ) Dmax(n+1) −Dmax(n) ∆t > 5 mm/year OR Joly, Soulez, Lessard, Kauffman, VC – Annals of Biomed Eng. 2020, collaboration with CHUM Canada • Goal: prediction of risk change from low risk to high risk based on current data (n) • Machine learning process HIGH RISK else LOW RISK
- 14. Classification evaluation with current clinical metric I. Vignon-Clementel 14 Classification using only Dmax as learning feature Fillinger & al. 2002 A receiver operating characteristic curve, or ROC curve, is a graphical plot that illustrates the diagnostic ability of a binary classifier system as its discrimination threshold is varied. Trade-off between sensitivity and specificity. x= false positive rate, y = true positive rate.
- 15. Features: different sets beyond clinical Dmax Clinical metrics • Age • Sex • BMI • Sys- and diastolics BP • Dyslipidemia • Statins Morphological metrics • Dmax • Volume of ILT • ILT thickness (max, min , mean, std) • % lumen covered in ILT • Lumen centerline curvature and tortuosity • Shape index of the lumen (deviation from a sphere) Hemodynamics metrics (max, min , mean, std) • TAWSS • OSI • RRT • ECAP • WSSG I. Vignon-Clementel 15
- 16. AI results: classification evaluation I. Vignon-Clementel 16 Clinical features only Morphological features only Hemodynamical features only All features combined p-values between AUCs according to DeLong & a method. Significant values ( <0.05) are in orange cells.
- 17. SIMULATIONS TO BETTER UNDERSTAND & PREDICT SURGERIES Liver disease
- 18. Medical context: liver surgery I. Vignon-Clementel 18 • 25% cardiac output • regeneration capacity • metabolism and storage • drugs and hormones processing Liver volume Liver hemodynamics Liver function Liver cancer Chronic liver disease Liver transplantation (total liver or split liver) Partial liver resection (partial hepatectomy) 10 y Collab. with E Vibert & col., APHP-hôpital Paul Brousse
- 19. Digital twin concept to anticipate portal hypertens. Intraoperative data collection + preoperative volumetric data Patient requiring major hepatectomy Preoperative concern about postoperative risk of portal hypertension EASL risk assessment: intermediate or high risk of decompensation Liver function: discrepancy between current tools available (i.e. normal indocyanine clearance but elevated liver stiffness) High-risk patient (comorbidities) Golse, …,Vibert, Vignon-Clementel, J Hepatology 2021 erfomed The left portal, arterial and bile duct branches are identified and divided. The Right liver hould be fully mobilized to facilitate the later second stage hepatectomy. The volume of the liver ollowing resection should be ≥ 40%.of standard liver volume. Standard liver volume is calculated as: 2.8 * body surface area (m2)-345.7 (23) Directly following resection, the patients receive a liver 2+3 from a deceased donor. The donor segments will be placed orthotropically. The graft liver vein mosed to the orifice of the left liver vein in the recipient with a triangulation technique. The graft n is anastomosed in an end to side fashion to the main portal trunk and the artery end to side to the hepatic artery (figure). The reason for this is that this will obviate the need for complex hilar at the second stage hepatectomy and also reduce the risk of complications to the liver remnant at peration. Biliary reconstruction is performed as a Roux-en-Y hepatico-jejunostomy. t 5 m i n u t e s a f t e r arization a pressure s placed in the portal vein. s monitored for 5 minutes sal conditions and during mping of the portal vein o t h e g r a f t p o r t a l sis. At least three repeated ments are performed. If the s stable < 20 mmHg, the n to the liver remnant is If the pressure is > 20 ring clamping, the splenic ligated and pressure ments repeated. If the still exceeds 20 mmHg, a f the portal vein to the liver remnant is performed by creation of a stenosis resulting in a stable portal of 10-20 mmHg. If this is not possible, e temporal portocaval shunt may be considered. This is however not very likely to be needed, since the cohort of patients with colorectal liver metastases do not have portal hypertension and a hyperdynamic splanchnic circulation. The diversion of portal graft is expected to result in enhanced proliferation of the graft during the course of 2-4 weeks after liver resection and liver transplantation without causing graft injury and small-for-size syndrome due yperperfusion (24, 25). with volumetry of the transplanted segment is performed at postoperative day1, 7,14, 21 and 28. As he donor graft has obtained a size of approximately 0,75-0.80% of body weight,or > 35-40% of the standard liver volume (SLV) a second stage hepatectomy of the liver remnant is performed, leaving onor segments in place. Version no. 1.1– 1. August 2013 Page ! of ! 11 22 I. Vignon-Clementel 19
- 20. Digital twin concept to anticipate portal hypertens. Intraoperative data collection + preoperative volumetric data Patient requiring major hepatectomy Preoperative concern about postoperative risk of portal hypertension EASL risk assessment: intermediate or high risk of decompensation Liver function: discrepancy between current tools available (i.e. normal indocyanine clearance but elevated liver stiffness) High-risk patient (comorbidities) Anticipation of postoperative portal/central pressures + flows Validation of simulations on a cohort of 47 patients Golse, …,Vibert, Vignon-Clementel, J Hepatology 2021
- 21. Conclusions on hemodynamic digital twins • Interactions between local changes and the global circulation • Biofluid simulations : • To understand the system/a disease/a treatment • To predict/plan an intervention for a specific patient • To test new treatment ideas of clinicians
- 22. Conclusions on hemodynamic digital twins • Machine learning can be complementary to biophysical modeling: palliate the lack of mechanistic equations / speed up simulations • Great tool progress… but validation remains an issue • Data acquisition • Data standardization • Access to large cohorts • More impact on patients Digital twin Patient data Biophysical model Machine learning
Hinweis der Redaktion
- kg.mˆ(-3); Pa.s
- If all the arteries, veins, and capillaries were laid end to end, the total length would be 100,000 km. That's nearly two and a half times around the Earth
- Couplage modeles
- 30mm = threshold for AAA
- The ten features explaining the most the dataset variance are chosen based on PCA. Hyperparameters are automatically tuned54 to maximize the Area Under the Curve (AUC) of the Receiver Operating Characteristic (ROC) curve and f1-score.
- A receiver operating characteristic curve, or ROC curve, is a graphical plot that illustrates the diagnostic ability of a binary classifier system as its discrimination threshold is varied. Trade-off between sensitivity and specificity. x= false positive rate, y = true positive rate.
- 5 hidden layers avec une tanh comme fct d'activation et une softmax pour la dernière couche. Le nb de neurons était de 15,3,4,4,2. Et l'optimisation a été piloté par scikit, pas theano avec une recherche aléatoire. Le learning rate était de 2e-3 avec 200 iter max.