Western Areas FY 2013 Results Presentation
•
1 gefällt mir•55,359 views

Western Areas Ltd reported full year results for 2013, highlighting a net loss after tax of A$94.1 million due primarily to a non-cash impairment charge of A$99.7 million related mainly to historical exploration. However, the company achieved an underlying net profit of A$5.6 million and cash flow from operations was A$112.1 million despite a weaker Australian dollar and lower nickel price compared to the previous year. Production and unit costs were better than guidance with a cash cost of A$2.68 per pound of nickel in concentrate.

Empfohlen
Weitere ähnliche Inhalte
Was ist angesagt?
Was ist angesagt? (20)
Andere mochten auch
Andere mochten auch (11)
Ähnlich wie Western Areas FY 2013 Results Presentation
Ähnlich wie Western Areas FY 2013 Results Presentation (20)
Mehr von Western Areas Ltd
Mehr von Western Areas Ltd (20)
Kürzlich hochgeladen
Kürzlich hochgeladen (20)
Western Areas FY 2013 Results Presentation
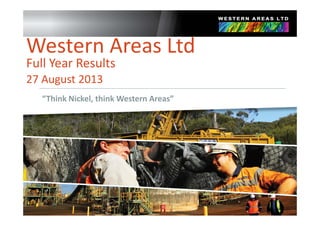
- 1. Western Areas Ltd Full Year ResultsFull Year Results 27 August 2013 “Think Nickel, think Western Areas”
- 2. Disclaimer and Forward Looking Statements This presentation is being furnished to you solely for your information and for your use and may not be copied, reproduced or redistributed to any other person in any manner. You agree to keep the contents of this presentation and these materials confidential. The information contained in this presentation does not constitute or form any part of any offer or invitation to purchase any securities and neither the issue of the information nor anything contained herein shall form the basis of, or be relied upon in connection with, any contract or commitment on the part of any person to proceed with any transaction.y p y p p y You must not take or transmit this presentation or a copy of this presentation into the United States or Japan or distribute it, directly or indirectly, in the United States or Japan or to any US persons. By your acceptance of this document, you acknowledge that you are a not a “U.S. person” for the purposes of the US Securities Act. Neither this document, in whole or in part, nor any copy thereof may be taken or transmitted to any other person. The distribution of this document to other persons or in other jurisdictions may be restricted by law, and persons into whose possession this document comes should inform themselves about, and observe, any such restrictions. Any failure to comply with these restrictions may constitute a violation of the federal securities laws of the United States and the laws of other jurisdictions. The distribution of this presentation in other jurisdictions may be restricted by law, and persons into whose possession this presentation comes should inform themselves about, and observe, any such restrictions. The information contained in this presentation has been prepared by Western Areas Ltd. No representation or warranty, express or implied, is or will be made in or in relation to, and no responsibility or liability is or will be accepted by Western Areas Ltd, employees or representatives as to the accuracy or completeness of this information or any other written or oral information made available to any interested party or its advisers and any liability therefore is hereby expressly disclaimed. No party has any obligation to notify opinion changes or if it becomes aware of any inaccuracy in or omission from this presentation. All opinions and projections expressed in this presentation are given as of this date d bj t t h ith t tiand are subject to change without notice. This document contains forward‐looking statements. These statements are subject to certain risks and uncertainties that could cause the performance or achievements of Western Areas Ltd to differ materially from the information set forth herein, although such information reflects forecasts and projections prepared in good faith based upon methods and data that are believed to be reasonable and accurate as at the dates thereof and although all reasonable care has been taken to ensure that the facts stated herein are accurate and that the forward‐looking statements, opinions and expectations contained herein are based on fair and reasonable assumptions. Western Areas Ltd undertakes no obligation to revise these forward‐looking statements to reflect subsequent events or circumstances Individuals should not place undue reliance on forward‐lookingno obligation to revise these forward looking statements to reflect subsequent events or circumstances. Individuals should not place undue reliance on forward looking statements and are advised to make their own independent analysis and determination with respect to the forecasted periods, which reflect Western Areas Ltd’s view only as of the date hereof. The information within this PowerPoint presentation was compiled by Mr. David Southam, but the information as it relates to mineral resources and reserves was prepared by Mr. Dan Lougher and Mr. Andre Wulfse. Mr. Southam, Mr. Lougher and Mr. Wulfse are full time employees of Western Areas Ltd. Mr. Lougher and Mr. Wulfse are members of AusIMM and have sufficient experience which is relevant to the style of mineralisation and type of deposit under consideration and to the activity which they are undertaking top y yp p y y g qualify as Competent Persons as defined in the 2004 Edition of the ‘Australasian Code for Reporting of Exploration Results, Mineral Resources and Ore Reserves’. Mr. Southam, Mr. Lougher and Mr. Wulfse consent to the inclusion in this presentation of the matters based on the information in the form and context in which it appears. For Purposes of Clause 3.4 (e) in Canadian instrument 43‐101, the Company warrants that Mineral Resources which are not Mineral Reserves do not have demonstrated economic viability. THIS PRESENTATION IS NOT FOR DISTRIBUTION TO U.S. NEWSWIRE SERVICES OR FOR DISSEMINATION IN THE U.S. 2
- 3. Agenda “Western Areas has an enviable track record of exploring, finding, developing and producing Highlights Fi i l profitable mines.” Financials Operations G h Growth Outlook Explore Developp 3 ProduceSales
- 4. Key Takeaways – Full Year LTIFR of 0.83 – one of the lowest in the mining industry 27,639t nickel in ore production averaging 5.0% nickel Nickel in concentrate production of 26,918t Nickel in concentrate sales 27 819t to Jinch an and BHP Nickel in concentrate sales 27,819t to Jinchuan and BHP A$2.68/lb cash cost in concentrate: Remains best in class in Australia Q4 f FY2013 th l t f th t A$2 46/lb All ahead of guidance Q4 of FY2013 the lowest of the year at A$2.46/lb Capital and Exploration Expenditure incurred A$71.0m Cash Flow from Operations A$112 1mCash Flow from Operations A$112.1m 2nd half cash flow from operations A$16.0m higher than 1st half despite a lower nickel price Underlying NPAT of A$5.6m on reported Net Loss After Tax of A$94.1m (post impairment): Revenue impacted by a significantly weaker $A compared to FY12 Negative Quotation Period adjustment of A$9.3m (A$14.0m for 2nd half FY13) Reported NLAT includes tax effected impairment of assets (mainly exploration) of A$99.7m Spotted Quoll underground successfully ramped up ahead of schedule and on budget 4
- 5. Financial Snapshot Full Year Highlights ($'000) FY 2012 FY 2013 Unit cash cost of concentrate production below guidance Nickel price fall in Mine Production (tonnes Ni) 31,102 27,639 Mill Production (tonnes Ni) 25,641 26,918 Recovery 92% 91% Ni k l i d li i Nickel price fall in 2HFY2013 negatively impacted revenue Sales Volume (tonnes Ni) 26,637 27,819 Cash Costs (A$/lb) 2.43 2.68 Exchange Rate USD/ AUD 1.03 1.03 Nickel price decline in 2H FY2013 impacted with negative QP of A$14.0m Nickel Price (U$/tn) 17,791 16,112 EBITDA ('000) 186,662 125,867 Underlying EBIT ('000) 94,981 40,599 Non cash impairment of $99.7M (post tax) Underlying NPAT ('000) 40,236 5,590 Reported NPAT ('000) 40,181 (94,105) Cash Flow from Operations ('000) 159,253 112,115 C h B k 165 502 80 719 2H FY2013 stronger with reduced capex Debt repayments totalled A$150m Cash at Bank 165,502 80,719 Dividend (cents) 11.0 2.0 5
- 6. Income Statement Commentary (FY2012 v FY2013) Ni price down A$0.76/lb versus FY2012.Earnings Data ($'000) 2H FY 2012 1H FY 2013 2H FY 2013 FY 2012 FY 2013 Ni price down A$0.76/lb versus FY2012. FY2012 included super low cost Spotted Quoll Open Pit, whereas FY2013 two underground mines. Impairments of A$99 7m post tax was Exchange Rate USD/ AUD 1.03 1.04 1.01 1.03 1.03 Nickel Price (U$/tn avg) 17,108 17,122 14,653 17,791 16,112 Revenue 181,592 158,963 147,578 330,698 306,541 EBITDA 90,029 67,565 58,302 186,662 125,867 Impairments of A$99.7m post tax was primarily related to historical exploration. A falling nickel price to around US$6 20/lb by 30/6/13 resulted in EBITDA 90,029 67,565 58,302 186,662 125,867 Depreciation & Amortisation (47,862) (44,186) (41,082) (91,681) (85,268) Underlying EBIT 42,167 23,379 17,220 94,981 40,599 Interest Expense (19,355) (13,671) (13,065) (37,441) (26,736) T (6 678) (3 429) (4 845) (17 304) (8 273) US$6.20/lb by 30/6/13 resulted in negative quotational price movements of A$9.3m (pre‐tax). Commentary (2H2012 v 2H2013) Ni i d A$0 95/lb 2H2012 Tax (6,678) (3,429) (4,845) (17,304) (8,273) Underlying NPAT 16,134 6,279 (690) 40,236 5,590 Tax effected Impairment (55) (4,162) (95,533) (55) (99,695) Reported NPAT 16,079 2,117 (96,222) 40,181 (94,105) *Underlying NPAT for FY2013 reconciliation $m U d l i NPAT $5 6 Ni price down A$0.95/lb versus 2H2012. Revenue fell A$34.0m due to a fall in nickel price, partially offset by slightly higher sales volumes. Dividend (cents) 6.0 2.0 ‐ 11.0 2.0 Underlying NPAT $5.6 Less Impairments (post tax) ($99.7) Reported NPAT (Loss) ($94.1) EBITDA reduction of A$31.7m primarily due to the lower A$ nickel price and timing of sales volumes. 6
- 7. Income Statement Waterfall – Full Year 100 WSA NPAT ‐ FY 2012 vs FY 2013 $40.2 5.9 25.3 33.7 10.6 10.7 9.0 50 $5.6 ‐$94.1 99.7 50 0 FY 2012 enue (Vol) Interest Tax Other st of Sales nue (Price) ying NPAT mpairment FY 2013 $m ‐100 ‐50 Reve Cos Reven Underly Tax effected Im FY2013 NPAT impacted by: ‐150 FY2013 NPAT impacted by: 1. Impairment charge relating mainly to historical exploration 2. Nickel price impact on revenue A$33.7m, partially offset by increased sale volume of concentrate 3. Savings on interest expense realised A$10.7m due to repayment of borrowings 4. Cost of sales increase reflects higher sales volume and the move from open pit at Spotted Quoll to 100% underground operations 7
- 8. Cashflow Statement Commentary (FY2012 v FY2013) Despite a significantly reduced nickel Cash Flow Statement ($'000) 2H FY 2012 1H FY 2013 2H FY 2013 FY 2012 FY 2013 Despite a significantly reduced nickel price, pre‐financing cash flow was only A$2.4m lower. Reduced mine development (A$31.9m) spend reflected the heavy Operating Cash Flow 94,841 48,076 64,039 159,253 112,115 Less: Exploration (15,940) (12,795) (7,385) (33,800) (20,180) FinnAust Investment (3,307) (2,297) (2,033) (7,365) (4,330) lifting completed in FY2012. Lower exploration (A$13.6m) spend was curtailed to match the environment, whilst higher capex fl t d i f t t i t t Acquisition of Mining Interests ‐ ‐ ‐ (1,512) ‐ Mine Development (28,911) (15,475) (20,052) (67,417) (35,527) Capital Expenditure (5,625) (14,333) (4,719) (13,712) (19,052) Pre‐Financing Cash Flow 41,058 3,176 29,850 35,447 33,026 reflected infrastructure investments (Paste Fill Plant and Haul Road). Total debt repayments of A$150.5m completed. Investment activities (811) ‐ (285) (1,085) (285) Outokumpu Royalty Payout ‐ (14,317) ‐ (14,926) (14,317) Payment for subsidiary (71,100) ‐ ‐ (71,100) ‐ Proceeds from Share Issues ‐ 50,000 15,009 ‐ 65,009 Outokumpu royalty full retired. Commentary (2H2012 v 2H2013) Operating cash flow reduced primarily due to a lower nickel price. oceeds o S a e ssues 50,000 5,009 65,009 Proceeds/(Costs) from Financing 44,486 (2,231) (764) 44,167 (2,995) Dividends Paid (8,987) (10,784) (3,937) (35,949) (14,721) Repayment of ANZ facility ‐ ‐ (45,000) ‐ (45,000) Repayment of convertible bond ‐ (105 500) ‐ ‐ (105 500) Business operated extremely well outflows reduced to match the prevailing nickel price. Exploration, capex and mine Repayment of convertible bond ‐ (105,500) ‐ ‐ (105,500) Net Cash Flow 4,646 (79,656) (5,127) (43,446) (84,783) Cash at Bank 165,502 85,846 80,719 165,502 80,719 8 p , p development outflows down A$18.3m
- 9. Cashflow Waterfall – Full Year 29.4 13 6 12.4 10.9 200 WSA Cashflow ‐ FY 2012 vs FY 2013 35.1 45.0 47.2 65.0 26.6 21.2 13.6 100 150 ‐$43.4 ‐$84.8 105.5 71.1 50 0 50 Y 2012 n Cost Equity Capex dends ration Other s (Vol) g Costs (Price) facility ancing yment Y 2013 $m ‐150 ‐100 ‐50 FY Acquisition E Mine Dev & Divi Explo Working Capital & Sales Operating Sales ( payment of ANZ f roceeds from Fina CB Repay FY FY 2013 Cashflow was a period characterised by debt repayments & right sizing: 1 Total debt retired was A$150 5m sourced from cash reserves and A$65m Placement & Share Purchase Plan W Rep Pr 1. Total debt retired was A$150.5m – sourced from cash reserves and A$65m Placement & Share Purchase Plan. 2. Exploration, mine development & capex was well within guidance and appropriate framework for current nickel price environment. Savings in these areas alone totalled A$40.2m. 3. A fall in dividends reflected the nickel price environment (A$21.2m). 9
- 10. Balance Sheet Commentary Strong balance sheet with A$150.5m of debt id d i FY2013 b i A$105 5 tibl Balance Sheet FY 2012 FY 2013 repaid during FY2013, being A$105.5m convertible bond and the A$45.0m ANZ bank facility (used to acquire Kagara Ltd’s nickel assets). Capital Management has plenty of headroom, but i l fl ibili Cash at Bank 165,502 80,719 Receivables 25,360 18,610 Stockpiles & Inventory 42,121 30,318 importantly flexibility: ANZ Facility of A$125m – currently undrawn Convertible bond July 2014 – A$110.2m Convertible bond July 2015 A$125 0m PP&E 107,111 112,110 Exploration & Evaluation 133,282 32,182 Mine Development 295,634 241,776 Convertible bond July 2015 – A$125.0m Reduced Exploration & Evaluation reflects the FY13 impairment charge. FY14 capex/mine development budget A$45 Other 5,958 2,308 TOTAL ASSETS 774,968 518,023 Trade & Other Payables 66,444 36,911 million. FY14 exploration budget of A$15 million. y Short Term Borrowings 162,656 4,266 Long Term Borrowings 256,003 233,842 TOTAL LIABILITES 485,103 275,019TOTAL LIABILITES 485,103 275,019 SHAREHOLDERS EQUITY 289,865 243,004 10
- 12. Strong Asset Base Production Exploration Assets Fl i F & Growth F t i &Flying Fox •1st nickel mine •15kt to 20kt nickel per annum Forrestania & WA Regional •Nickel Disciplined A i i i per annum Spotted Quoll •2nd nickel mine Canadian Assets •Nickel/Copper Acquisition Potential (Nickel & Base Metals)•2nd nickel mine •12kt to 15kt nickel per annum •Nickel/Copper •Platinum group Base Metals)Base Metals) Cosmic Boy •Nickel concentrator – treats ore from Finland •VMS •Outokumpu Cu 12 both mines Outokumpu Cu
- 13. Western Areas are Safe Areas Continuous Safety Improvement LTIFR 0 83 LTIFR 0.83 Flying Fox > 800 days LTI free Spotted Quoll > 500 days LTI free Exploration >1,500 days LTI free MTIFR trending down to 5.9 Contractors and Employees fully integrated p y y g into a site wide commitment Environment & Socialnvironment & Social No environmental breaches Strong local commitments from the Hyden R it C t P th Z (N th Q ll)Respite Centre, Perth Zoo (Northern Quoll) and Starlight Children’s Foundation WA 13
- 14. Flying Fox Mine Mineral Resource and Ore Reserve High Grade (excluding disseminated sulphide resource) Mineral Resource: 1.68Mt @ 5.7%Ni = 94,600 Ni Tonnes Ore Reserve: 1.67Mt @ 4.0%Ni = 67,000 Ni Tonnes Nickel grades increase with depth from 3.9% to 5 8%5.8% Underground drilling program to extend Mineral Resource is ongoing O 700 t ik l th i T5 Over 700m strike length in T5 Production FY2013 – 348,448t @ 4.9%Ni for 17Kt nickel Low cash cost operation <US$3/lb Life of Mine – 5‐6 Years, extensional drilling in progress 14
- 15. Spotted Quoll Mine Summary Ore reserve now 2.9mt @ 4.2% containing 121,400t nickel Remains open at depth and to the North Indicated Resource:2.4Mt @6%Ni Surface drilling program complete to improve conversion of inferred resource to indicated resource – Sept Q =144Kt Ni Inferred Resource:0.5Mt @5.1%Ni=27.5Kt Ni Already >10 year mine life on reserve New Spotted Quoll North Resource of 50kt @ 11.3% for 5,730 nickel tonnes 900m Vertical Production FY2013 – 207,288t @ 5.1%Ni for 10.6Kt nickelnickel Successfully ramped up nickel production to a 12ktpa run rate in FY2014 Top‐down mining using paste fill Plant fullyTop down mining using paste fill. Plant fully operational 15
- 16. Forrestania Nickel Concentrator Concentrator Summary Current nameplate capacity of 550,000tpa of ore (but being exceeded) Nickel concentrate output >25,000tpa Ni Concentrate grades of around 14.0% Ni Premium blending product (Fe/Mg ratio >15) Desirable to smelters as it enables lower quality concentrates to be economically utilised after blending 14,000t of concentrate storage capacity Export Infrastructure and Logistics Access to >1400 sealed shipping containers No environmental issues No environmental issues Using 25 trucks for concentrate transportation Shipping contract in place, FOB Esperance Port 16
- 17. Independent Producer ‐ Offtake Contracts Concentrate Supply Tightness in smelter supply to be experienced from 950 1000 Global Smelter Demand vs Global Concentrate Supply 2014 Global nickel sulphide grades in decline Reliable nickel sulphide concentrate supply dwindling 700 750 800 850 900 Nickel in Conc/ Kt Laterites and Nickel Pig Iron do not fill the void Offtake Contracts Offt k t BHP 2017 12kt i k l i t t 500 550 600 650 2009 2010 2011 2012 2013 2014 2015 2016 2017 2018 2019 2020 Nickel in Concentrate Supply Smelter Demand Offtake to BHP 2017 – 12ktpa nickel in concentrate Offtake to Jinchuan Feb 2015 FOB Terms Very competitive payable terms WSA in a unique position being an independent producer Abilit t l t t/ t i ti l Ability to complete spot/opportunistic sales NOTE: The graph FORRESTANIA – OFFTAKE CONTRACTS is based on Western Areas’ 10 Year Production Targets. These Targets include estimates and assumptions on production rates of existing ore reserves, conversion of existing mineral resources to ore resources and assumptions on potential extensions to existing mineral resources, based on current information. These Production Targets may vary due to future drilling results, nickel prices, costs and market 17 conditions. Refer to Disclaimer and Forward Looking Statement in Presentation
- 18. Forrestania Tenements Regional GeologyRegional Geology Two main volcano‐sedimentary associations (ca 2.9Ga) 120km strike length (900 sq km) of prospective Forrestania Nickel Project, within 500km long nickel province Six ultramafic belts Nickel sulphide deposits and most occurrences in two belts (Eastern and occu e ces t o be ts ( aste a d Western) 18
- 19. Short Term – Near Mine Exploration Exploration Budget of A$15M for FY14, majority spent on drilling at Forrestania Drilling Priority within 8km long zone (below) New discovery would access existing mineDrilling Priority within 8km long zone (below). New discovery would access existing mine infrastructure. Systematic approach Recent New Morning massive sulphide and Sunrise discoveries Drilling in Progress 19
- 20. West Musgrave JV Up to 70% earn into prospective West MusgraveUp to 70% earn into prospective West Musgrave tenements (1,075km2) with Traka Resources Demonstrated strong endowment (BHPB’s Nebo – Babel – Succoth deposits)(BHPB s Nebo – Babel – Succoth deposits) Targeting massive sulphides (nickel/copper) Geophysical surveys commenced on priority p y y p y targets 20
- 21. Finland – FinnAust Mining PLC Projects 84% WSA, preparing to list on AIM ‐ dependent on k t diti i CY2013market conditions in CY2013 300km long base metal province in Finland Numerous nickel/copper/zinc mines & occurrencesNumerous nickel/copper/zinc mines & occurrences Focus on two key projects: 1. Outokumpu Copper Project 2. Hammaslahti VMS Project Drill priority targets for potential extensions and repetitions to known copper depositsp pp p Geophysics proving very effective in defining targets ‐ ZTEM survey completed 21
- 22. Pillars for Growth O i G h Western Ultramafic Belt: New Morning Camp Organic Growth New Morning Camp Between Spotted Quoll & Flying Fox Selected Overseas Exploration Leverage from WSA’s Concentrate off take Traka Resources Joint Ventures Southern Cross Base Metals – many opportunities being presented Base Metals Bottom Half of the Cost C r e Acquisitions Bottom Half of the Cost Curve Use WSA expertise – exploration, dev and ops The 2 “D” – discipline and due diligence 22 The 2 D discipline and due diligence
- 23. Full Year Guidance FY2014 Target Metric Mine Production (Nickel in Ore) 24,000 to 26,000 tonnes Nickel in Concentrate Production 23,000 to 24,000 tonnes Unit Cash Cost of Production (Nickel in Concentrate) A$2.80/lb to A$2.90/lb Capital Expenditure & Mine Development A$45m Exploration A$15m Comments Approximately 6 different budget scenarios were run Chosen budget reflects an optimised approach to margin protection Unit costs remain well managed and below US$3/lb for nickel in concentrate O 65% f i d l t dit f d t d S tt d Q ll Over 65% of mine development expenditure focussed towards Spotted Quoll Spotted Quoll to produce 11kt to 12kt of nickel in ore Flying Fox to produce between 13kt to 14kt of nickel in ore Mill throughput at around 580kt of ore with an average recovery of 89% 23 g p g y
- 24. Bottom Quartile Producer 20 50% of nickel production at a loss, including NPI Grade is King Top Tier assets will survive 15 20 ) 5.0% 5.0% 6.0% Nickel Grade Mined Comparison FY2013 5 10 ost (US$/lb) Spot LME Nickel Price Losing Money 3.8% 3.1% 3.0% 4.0% 0 5 Cash Co Spot LME Nickel Price, US$6.30/lb Western Areas 1.7% 0.5%1.0% 2.0% -5 0.0% WSA Company 1 Company 2 Company 3 Company 4 24
- 26. Market remains in surplus Market balance (LHS) and LME 3‐month price, US$/tonne (RHS) 45,000 50,000100 '000 tonnes LME 3 month $/t 35,000 40,000 45,000 60 80 Balance LME 3‐month 20,000 25,000 30,000 20 40 5 000 10,000 15,000 ‐20 0 0 5,000 ‐40
- 27. Stainless Steel Demand Nearly 70% of nickel supply ends up in stainless steel Steel consumption (kg/capita) Stainless consumption (kg/capita) Nickel consumption (kg/capita) 600 1.1 1.1 1.224 485 507 400 500 0.8 1.0 18.8 16 20 China 219 300 0.6 12.6 12 China219 100 200 0.2 0.2 0.4 4.1 4 8 China China 0 World Germany Japan 0.0 World Germany Japan 0 World Germany Japan 27 At Japanese and German per capita consumption levels, Chinese nickel demand would increase by nearly one million tonnes during this decade
- 28. Chinese Nickel Demand Forecast Chinese nickel demand and NPI production 1.6 1.8 1.0 1.2 1.4 ickel(Mt) 0.6 0.8 Containedni 0.0 0.2 0.4 5 6 7 8 9 0 1 2 3 4 5 6 7 8 9 0 1 2 3 4 5 6 7 8 9 0 2005 2006 2007 2008 2009 2010 2011 2012 2013 2014 2015 2016 2017 2018 2019 2020 2021 2022 2023 2024 2025 2026 2027 2028 2029 2030 NPI production Total Chinese nickel demand NPI production will likely not increase at its current pace into the future. 28 Chinese demand for nickel will have to be met by alternate sources of production.
- 29. NPI to become expensive NPI is too expensive to continue to fill the gap…….. 11.90 14 2012 and 2016 estimated NPI cash cost (US$/lb) Cost Pressures 1 Electricity (25 75% of cost) 8.10 11.90 10.80 9.10 10 12 lbNi) 1. Electricity (25‐75% of cost) 2. Labour costs increasing 7.50 6.80 6 8 Cashcost(US$/l 3. Indonesian Laterite the only supplier for low cost RKEAF 4 Increase ore export taxes 2 4 C 4. Increase ore export taxes 0 Blast Furnace Electric Arc Furnace Rotary-Kiln Electric Furnace 2012 2016 l d h h h d f k l d d d f 29 NPI is already a high cost method of nickel production, and domestic economic forces in China may adversely impact economics
- 30. Investor Equation • High Grade = Margin • History of returns to • Guidance continuallyMargin • Survival returns to shareholders in dividends continually met or exceeded Highest Grade Nickel Globally Cashflow Positive Strong Track Record of Delivery • Current global • New mine • Flexibility in g production at marginal cost successfully bought on in 24 months y meeting future demands or opportunities Nickel Price Primed for U id 24 months History of Discovery and D l t opportunities Strong Balance Sheet 30 Upside Development
- 33. Corporate Summary % 1 T Streeter 12.16 2 JCP Partners 8.12 3 Colonial Group 7 01 Top 15 Shareholders Listing: Member of S&P ASX 200 3 Colonial Group 7.01 4 M & A Greenwell 5.10 5 Celeste Funds Management 4.10 6 BT Investments 3.35 7 Concise Asset Management 3.28 8 Antares 2.57 Shares on Issue: 196.8M Share Price: ~ A$3.30 (August 2013) 9 Giovanni Santalucia 2.54 10 Bennelong 2.18 11 Tribeca 2.18 12 Kinetic Investment Partners 1.85 13 Highclere 1.71 14 M K ll 1 56 Market Cap: (undiluted) ~ A$650 million 14 Mount Kellet 1.56 15 AMP 1.51 TOTAL 59.22 Cash: A$81M at 30 June 2013 WSA 12 Month Share Price $3 00 $4.00 $5.00 $6.00 $0.00 $1.00 $2.00 $3.00 A 12 O 12 D 12 F b 13 A 13 J 13 A 13 33 Aug‐12 Oct‐12 Dec‐12 Feb‐13 Apr‐13 Jun‐13 Aug‐13 Closing Share …
- 35. Another Strong Production Year Highlights 1 2 3 4 FY Tonnes Mined Sep Qtr Dec Qtr Mar Qtr Jun Qtr Total l 2012/2013 Production guidance exceeded Record Sales for the year and quarter Flying Fox Ore Tonnes Mined Tn's 102,218 89,846 82,668 73,716 348,448 Grade Ni % 5.0% 4.9% 4.9% 4.7% 4.9% Ni Tonnes Mined Tn's 5,129 4,380 4,081 3,447 17,037 Spotted Quoll ‐ Underground O T Mi d T ' 43 581 50 907 59 335 53 465 207 288 Lowest Unit Cash Cost for the year A$2.46/lb Unit Cash Cost < full year id A$2 68 Ore Tonnes Mined Tn's 43,581 50,907 59,335 53,465 207,288 Grade Ni % 5.4% 5.1% 5.2% 4.8% 5.1% Ni Tonnes Mined Tn's 2,375 2,577 3,066 2,584 10,602 Total ‐ Ore Tonnes Mined Tn's 145,799 140,753 142,003 127,181 555,736 Grade Ni % 5.1% 4.9% 5.0% 4.7% 5.0% guidance A$2.68 Free cash flow generation A$22m (in June Q) Total Ni Tonnes Mined Tn's 7,504 6,957 7,147 6,031 27,639 Tonnes Milled and Sold Sep Qtr Dec Qtr Mar Qtr Jun Qtr Total Ore Processed Tns 142,795 151,855 145,348 146,256 586,254 Grade % 5.3% 4.9% 5.0% 5.1% 5.1% Ave Recovery % 92% 90% 91% 89% 91% Salary freeze extended into FY2014 Cost reduction exercise f l Ave. Recovery % 92% 90% 91% 89% 91% Ni Tonnes in Concentrate Tns 6,951 6,722 6,611 6,634 26,918 Ni Tonnes in Concentrate Sold Tns 6,923 6,829 6,845 7,222 27,819 Total Nickel Sold Tns 6,923 6,829 6,845 7,222 27,819 Cash Cost Ni in Con A$/lb 2 49 2 89 2 86 2 46 2 68 successful Cash Cost Ni in Con A$/lb 2.49 2.89 2.86 2.46 2.68 Cash Cost Ni in Con/lb US$/lb 2.59 3.00 2.97 2.44 2.75 Exchange Rate US$ / A$ 1.04 1.04 1.04 0.99 1.03 35
- 36. Income Statement Waterfall – 2nd Half WSA NPAT ‐ 2H FY 2012 vs 2H FY 2013 $16.1 $96 2 11.3 26.38.5 6.3 4.8 1.8 20 40 60 ‐$0.7 ‐$96.295.5 ‐40 ‐20 0 2H FY 2012 Cost of Sales Interest Other Tax evenue (Vol) venue (Price) erlying NPAT d Impairment 2H FY 2013 $m ‐100 ‐80 ‐60 R Rev Unde Tax effected 2H 2013 NPAT impacted by: ‐120 2H 2013 NPAT impacted by: 1. Impairment charge relating mainly to historical exploration 2. Nickel price and volume impact on revenue A$28.5m (2H2012 had record sales due to timing of shipment that missed 1H2012) plus negative quotational price movement of A$14.0m (pre‐tax) 3. Savings on interest expense realised A$6.3m due to repayment of borrowings 36
- 37. Cashflow Waterfall – 2nd Half WSA Cashflow ‐ 2H FY 2012 vs 2H FY 2013 11.3 15.2 26.9 45.0 71.1 15.0 24.4 9.8 8.6 5.1 100 150 $4.6 ‐$5.1 45.3 0 50 2 st P & x n s l) ts e) Z m 3 $m 100 ‐50 2H FY 2012 Acquisition Cos SPP Working Capital & Other Mine Dev & Cape Exploration Dividend Sales (Vol Operating Cost Sales (Price Repayment of ANZ facility Proceeds from Financing 2H FY 2013 2H 2013 Cashflow was a busy period characterised by: ‐100 W M R 2H 2013 Cashflow was a busy period characterised by: 1. Nickel prices and volumes adversely impacting cash flow by A$28.5m 2. Despite the nickel price, the underlying business proved durable with improvements in working capital (A$15.6m) and reduction in exploration and mine development (A$17.5m). 3. Increase in operating costs reflects an increase in fixed costs being allocated to operating rather than capital, as mine d l t d d l th h f it t d d ti t S tt d Q ll 37 development decreased, plus the change from open pit to underground operations at Spotted Quoll
- 39. Nickel Price History ‐ Mar 2001 ‐ Present Body Text •Bullet point style •Bullet point style •B llet point st le 27.22 29.48 31.75 60,000 65,000 70,000 Historical Nickel Price USD AUD Glory Days •Bullet point style •Bullet point style •Bullet point style •Bullet point style •Bullet point style 18.14 20.41 22.68 24.95 40,000 45,000 50,000 55,000 G d D•Bullet point style •Bullet point style •Bullet point style •Bullet point style 9.07 11.34 13.61 15.88 20,000 25,000 30,000 35,000 Ni $/lb Ni $/t Dark Days Good Days 0.00 2.27 4.54 6.80 0 5,000 10,000 15,000 GFC Future? Jun 01 Sep 01 Dec 01 Mar 02 Jun 02 Sep 02 Dec 02 Mar 03 Jun 03 Sep 03 Dec 03 Mar 04 Jun 04 Sep 04 Dec 04 Mar 05 Jun 05 Sep 05 Dec 05 Mar 06 Jun 06 Sep 06 Dec 06 Mar 07 Jun 07 Sep 07 Dec 07 Mar 08 Jun 08 Sep 08 Dec 08 Mar 09 Jun 09 Sep 09 Dec 09 Mar 10 Jun 10 Sep 10 Dec 10 Mar 11 Jun 11 Sep 11 Dec 11 Mar 12 Jun 12 Sep 12 Dec 12 Mar 13 39