Irrigation futures wasp, a planning and policy tool for sustainable urban irrigation

WASP: A planning and policy tool for sustainable urban irrigation This article by Bhakti Devi featured in the Irrigation Australia Journal, Winter 2009, Volume 24, No. 2. With urban areas across Australia feeling the effects of drought in the last few years, the response of many water utilities has been to implement water restrictions for urban green spaces, including domestic gardens, sporting ovals and grounds and other public open spaces. While restrictions do conserve water resources, this is at the cost of the quantity and quality of the urban green space and the associated social, economic and environmental benefits. Without a tool or framework for analysing existing urban irrigation demand and determining the water saving potential of various categories of urban green spaces, it is likely that water restrictions continue to be the preferred policy option for saving water.

Empfohlen
Empfohlen
Weitere ähnliche Inhalte
Was ist angesagt?
Was ist angesagt? (20)
Andere mochten auch
Ähnlich wie Irrigation futures wasp, a planning and policy tool for sustainable urban irrigation
Ähnlich wie Irrigation futures wasp, a planning and policy tool for sustainable urban irrigation (20)
Mehr von Christina Parmionova
Mehr von Christina Parmionova (20)
Kürzlich hochgeladen
Kürzlich hochgeladen (20)
Irrigation futures wasp, a planning and policy tool for sustainable urban irrigation
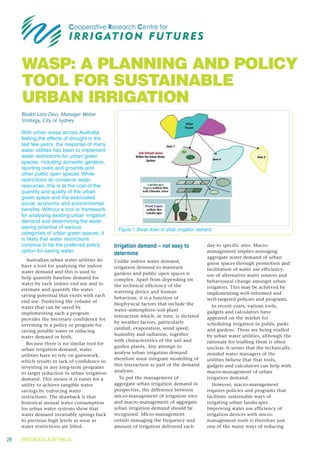
- 1. WASP: A PLANNING AND POLICY TOOL FOR SUSTAINABLE URBAN IRRIGATION Bhakti Lata Devi, Manager Water Strategy, City of Sydney With urban areas across Australia feeling the effects of drought in the last few years, the response of many water utilities has been to implement water restrictions for urban green spaces, including domestic gardens, sporting ovals and grounds and other public open spaces. While restrictions do conserve water resources, this is at the cost of the quantity and quality of the urban green space and the associated social, economic and environmental benefits. Without a tool or framework for analysing existing urban irrigation demand and determining the water saving potential of various Figure 1: Break down of urban irrigation demand. categories of urban green spaces, it is likely that water restrictions continue to be the preferred policy Irrigation demand – not easy to day to specific sites. Macro- option for saving water. management implies managing determine aggregate water demand of urban Australian urban water utilities do Unlike indoor water demand, green spaces through promotion and have a tool for analysing the indoor irrigation demand to maintain facilitation of water use efficiency, water demand and this is used to gardens and public open spaces is use of alternative water sources and help quantify baseline demand for complex. Apart from depending on behavioural change amongst urban water by each indoor end use and to the technical efficiency of the irrigators. This may be achieved by estimate and quantify the water watering device and human saving potential that exists with each implementing well-informed and behaviour, it is a function of well-targeted policies and programs. end use. Predicting the volume of biophysical factors that include the In recent years, various tools, water that can be saved by water–atmosphere–soil-plant gadgets and calculators have implementing such a program interaction which, in turn, is dictated appeared on the market for provides the necessary confidence for by weather factors, particularly scheduling irrigation in public parks investing in a policy or program for rainfall, evaporation, wind speed, and gardens. These are being trialled saving potable water or reducing humidity and radiation, together by urban water utilities, although the water demand or both. with characteristics of the soil and rationale for trialling them is often Because there is no similar tool for garden plants. Any attempt to unclear. It seems that the technically- urban irrigation demand, water analyse urban irrigation demand minded water managers of the utilities have to rely on guesswork, therefore must integrate modelling of utilities believe that that tools, which results in lack of confidence in this interaction as part of the demand gadgets and calculators can help with investing in any long-term programs analyses. macro-management of urban to target reduction in urban irrigation demand. This means it is easier for a To put the management of irrigation demand. utility to achieve tangible water aggregate urban irrigation demand in However, macro-management savings by enforcing water perspective, the difference between requires policies and programs that restrictions. The drawback is that micro-management of irrigation sites facilitate sustainable ways of historical annual water consumption and macro-management of aggregate irrigating urban landscapes. for urban water systems show that urban irrigation demand should be Improving water use efficiency of water demand invariably springs back recognised. Micro-management irrigation devices with micro- to previous high levels as soon as entails managing the frequency and management tools is therefore just water restrictions are lifted. amount of irrigation delivered each one of the many ways of reducing 28 IRRIGATION AUSTRALIA
- 2. CRCIF irrigation demand and conserving water. Other alternatives include using alternative sources of water, designing low- water using landscapes and xeriscapes, and promoting garden practices that reduce water consumption by plants. A focus on micro-management tools for improving irrigation efficiency could lead to other options for sustainable irrigation to be overlooked. As a way forward from current policy position of water restrictions that treat all urban green spaces to be the same to a more rational policies, a decision-making tool called WASP has been developed for macro-management of urban irrigation demand through a PhD research under the auspices of CRC for Irrigation Futures and University of Western Sydney. This decision making tool was designed to analyse urban irrigation demand to facilitate development of sustainable urban irrigation policies and programs. What’s WASP? The name comes from the acronym for Water- Atmosphere-Soil-Plant, the interaction of which underpins the tool. It also is an acronym for ‘water saving potential’, which the tool is ultimately designed to map and quantify for urban green spaces. WASP is a decision- making tool developed for macro-management of water demand by irrigation of urban green spaces. Developing Baseline Data for Urban Irrigation Demand. WASP applies end-use modelling or end-use analysis that utilities across the world have successfully applied to understanding the energy and indoor water demand of an urban region. This approach builds up a picture of demand by breaking down the demand into its individual elements that together make up total demand. To build an urban irrigation demand picture of a region, the region is first broken down into zones that share similar types of soil and climate (Figure 1). Individual soil- climate zones are then separated into different kinds of landscapes or green spaces that contribute to the irrigation demand within the soil-climate zone. This is done because water demand is influenced not only by the type of urban landscape but also the purpose of the green space. Hence within a soil climate zone, recreational green spaces like golf courses and soccer fields would have different levels of water demand compared to non-recreational parks and domestic gardens in the same climatic and soil type zones. The irrigation demand for each type of green space is then modelled by taking account of the individual planting types that constitute the particular landscape type. This baseline data must be compiled before policies and programs for sustainable urban irrigation can be developed. This is because it provides a reference against which the policy can be evaluated. It also establishes a framework for collecting future information necessary to evaluate the program, in addition to developing future demand projections. Irrigation budgets and benchmarks for urban green spaces. Figure 2 shows two basic modules that have been integrated to make up WASP and how their outputs can inform the development of policies and programs focused on promoting sustainable urban irrigation. Module-1 of WASP simulates the biophysical water–atmosphere–soil-plant interaction by determining a daily water balance for the effective root zone of the plant so the depth of irrigation water that needs to be applied for a given soil condition and the planting type/s that Continued on page 32 IRRIGATION AUSTRALIA 29
- 3. CRCIF Continued from page 29 compose the green space can be estimated. Running a daily water balance for 100 years of daily weather data, WASP Module-1 estimates a monthly irrigation budget or benchmark for various types of urban green spaces in a given soil-climate zone. Inputs required include weather parameters, soil properties and landscape characteristics. Taking these inputs, Module-1, estimates the required daily water application for every day of 100 years for which weather data have been inputted into the model. The watering requirement is expressed in depth (mm) of water, which allows it to be used as a benchmark or budget. Performance Figure 2: WASP and its two modules; their inputs and outputs. between landscapes of the equivalent type in a given soil climate zone can Mapping the water-saving potential This output includes an estimation also be compared. For a given soil- of urban green spaces of potential water savings relative to climate zone, Module-1 outputs the the distribution of landscaped monthly median values as monthly Module-2 of WASP maps and properties within each landscape type irrigation budgets or benchmark estimates the water saving potential into low, moderate and high water values for: of the landscapes and classifies them saving potential. An additional • landscapes mainly composed of into landscapes with high, moderate output of Module-2 is a map showing high, moderate and low water using and low water saving potential. This the location and distribution of plants requires historical metered water properties with their water saving • the microclimate to which the consumption data of the landscaped potential. landscape is exposed (i.e., full sun, properties to be entered and aerial The quantified water saving part shade, full shade) photographs of the properties linked potential from different landscape • the ratio of turf to shrubs in a to a Geographical Information types can be fed into models that landscape. System (GIS). perform the cost benefit analysis of Assumptions about effective root The module first estimates the the programs and policies for zone depth, soil properties, landscape irrigation component out of the total sustainable urban irrigation to help coefficient, and maximum allowable water use from the metered prioritise the programs, based on the depletion that are made to estimate consumption data of individual return for investment by each of the required irrigation application rate properties for each billing period initiatives. can be revised and modified if more (quarterly or monthly as convenient). The map of the location and accurate data becomes available. Using the area of landscape, it distribution of properties by their The monthly irrigation benchmark converts kilolitres of irrigation water water saving potential can provide values produced by WASP Module-1 applied by individual properties clues about where the programs and can be used by water utilities to during the billing period to policies need to be specifically communicate to urban irrigators the millimetres actual irrigation applied. targeted to maximise the return on irrigation budgets for their landscape The area of individual landscape is the investment made in the form of on a monthly or quarterly basis, estimated by digitising the green water savings. It may also serve as the matched to billing frequency. These zones in the GIS linked aerial basis for water utilities to encourage budgets can help water users compare photographs of individual landscaped home gardeners to use different their actual water consumption, as properties. Millimetres of actual plants in landscaping their gardens. shown on the water bill with the irrigation water applied are then compared with the irrigation budget Both modules of WASP can also be budget, with the benchmark provided for the billing period and the used in tandem to study the impact by the utility. With this information landscape type, its layout and micro- of various policy scenarios, thereby they can tell whether they are realising the maximum water saving climate, to estimate the water saving helping to prioritise and rank the potential for their garden type, and potential for each billing period. The policy options by their impact. can adjust irrigation use to set goals water saving potential of individual for water savings. Providing the water properties is classified as low, Conclusion users with information that enables moderate and high and is used to WASP is a decision-making tool that them to measure their own produce a thematic map of the helps to systematically and performance against a benchmark property using GIS software, and by scientifically analyse and (macro) can be seen as first step in moving producing a map of the landscaped manage urban irrigation demand. It towards a community-based properties in the urban region, by helps take ‘guesswork’ out of the voluntary approach to sustainable their individual water saving analysis and (macro) management of urban irrigation. potential. urban irrigation. 32 IRRIGATION AUSTRALIA