SlideShare ist ein Scribd-Unternehmen logo
1 von 99
Downloaden Sie, um offline zu lesen
Prerequisites and setup steps
• At minimum, a computer with 2-cores and 4GB RAM running Windows 7 / Windows Server 2008 R2, or
later
• Display: At least 1440x900 or 1600x900 (16:9) recommended.
• Internet connectivity: You must have the ability to connect to the Internet outside your organization
• Microsoft Power BI Desktop installed: you should have downloaded and installed Power BI Desktop
from the Microsoft Store https://www.microsoft.com/en-us/p/power-bi-desktop/9ntxr16hnw1t or from the
download center https://go.microsoft.com/fwlink/?LinkId=521662.
• Microsoft Power BI Desktop requires Internet Explorer 9 or later.
• Signup for Power BI: Go to http://aka.ms/pbidiadtraining and sign up for Power BI with a business email
address. If you cannot sign up for Power BI, let the instructor know.
• If you have an existing account, please go to http://app.powerbi.com and Sign in using your Power BI
account
• Training and Lab material - http://mnts.info/pbid >> https://powerbi.microsoft.com/en-us/diad/
http://mnts.info/pbid
Vishal Pawar
Principal BI Architect, Green House Data
Microsoft rMVP, MCT
Dashboard in a Day
Vishal Pawar
• Principal BI Architect
• Microsoft rMVP, Microsoft Certified Trainer
• Founder of Global Power BI User Group
• Blogger, Speaker and #PowerAddict
Join a Global Power BI User Group !
• Udemy Free Course (53K+ Student) – http://bit.do/pbiu
• Facebook Group (15K+ member)- http://bit.do/pbifb
• LinkedIn (2K+ member) – http://bit.do/pbiln
• Twitter (@GlobePUG) – http://bit.do/pbitw
• YouTube (2K+ Subscriber)- http://bit.do/ytgpbi
• Official Microsoft Community – http://bit.do/pbiug
• Official website (2K+ Member) – http://bit.do/gpbiweb
• Power BI news (2K+ Readers) – http://bit.do/pbinews
• Session pins on Pinterest- http://bit.do/gpbisession
• Google Plus – http://bit.do/pbigp
• About user group – http://bit.do/aboutgpbi
Free Power BI Template- Download & Use now !!
http://bit.do/sqldash
SQL Server Dashboard LinkedIn Dashboard
https://gallery.technet.microsoft.com/LinkedIn-Connection-107605c5
NetFlix Dashboard
http://bit.do/pbinetflix
Agenda (times are approximate and will be fluid with the class)
Morning
• 9:00 AM – 10:00 AM – Introduction to Power BI and Power BI Desktop
overview
• 10:15 AM – 11:00 PM – Power BI Desktop – Lab
• 11:15 PM – 12:15 PM – Power BI Desktop – Demos
• 12:15 PM – 1:00 PM – Break and Q&A with speaker
Afternoon
• 01:00 PM – 02:00 PM – Power BI Desktop, Services – Lab (Continued)
• 02:15 PM – 03:15 PM – Power BI Report Server Overview & Best Practice
• 03:30 PM – 04:30 PM – Power Platform end to end Demo
Data
+
intelligence
Optimize
operations
Transform
products
Engage
customers
Empower
employees
Digital Transformation
Data
Capture digital signal across business
2
Intelligence
Connect and synthesize data
Action
Improve business outcomes
Data +
intelligence
Digital Feedback Loop
Optimize
operations
Transform
products
Engage
customers
Empower
employees
Data +
intelligence
Data
Capture digital signal across business
2
Intelligence
Connect and synthesize data
Action
Improve business outcomes
Digital Feedback Loop
Optimize
operations
Transform
products
Engage
customers
Empower
employees
Microsoft Power Platform
Microsoft FlowPowerAppsPower BI
Analyze
Make sense of your data through interactive, real-time dashboards and unlock
the insights needed to drive your business forward
Act
Build apps in hours—not months—that easily connect to data, use Excel-like expressions to add
logic, and run on the web, iOS, and Android devices
Automate
Include powerful workflow automation directly in your apps with a no-code approach that
connects to hundreds of popular apps and services
One connected platform that empowers everyone to innovate
Power Platform
Everyone
Analysttoenduser
ITtoenduser
2nd wave
Self-service BI
1st wave
Corporate BI
3rd wave
End user BI
The Evolution of BI
Access
Clean
Mash-up
Explore
Visualize
Share
End User Needs
Power BI
Power BI: experience your data
Any data, any way, anywhere
• Data from Applications
o SaaS services that you already use
• Data from your organization
o Content published by others in your org
(Datasets and Dataflows)
• Big data and more
o Azure data services, e.g. SQL DW, ADLS.
o On-premises data sources, e.g. Oracle & SSAS
• Data from files
o Import data from Text, CSV, Excel and Power
BI Desktop files
Access all your DATA
SaaS solutions
e.g. Marketo, Salesforce,
GitHub, Google Analytics
On-premises Data
Data sources
Organizational
Corporate data sources
or external data services
Azure services
Azure SQL, Stream
Analytics…
Power BI Desktop files
Data from files,
databases, Azure, and
other sources
Excel files
Share &
collaborate
Visualize
Explore
Prepare • Consolidate data from a broad range of
sources
o Merge or append queries to combine data
from multiple queries into a single query
• Transform data to fit your needs using
intuitive UI
o Select data for inclusion
o Cleanse data and remove errors
• Define calculations to generate new fields
for use in reports
• Develop advanced analytics using a
combination of measures and relationships
o Uncover correlations, highlight exceptions
and understand business outcomes
Clean and mash-up your DATA
Share &
collaborate
Visualize
Explore
Prepare • Explore data in a variety of ways and across
multiple visualizations using drag and drop
canvas
• Dig deeper into your reports
o Drill-down in your hierarchical data
o Filter, sort, hover over and highlight data
• Leverage Quick Insights to find insights in
your data
• Ask questions of your data in natural
language with Q&A
o Type questions in plain language
o Q&A intelligently filters, sorts, aggregates,
groups and displays data based on the
question
Explore your DATA
• Visualize data in a variety of ways
• Growing number of visualization types
o Donuts, basic area, waterfall, filled maps, tree
maps, funnel, gauges combo charts and
more
o Custom visuals available from Power BI
Visuals Marketplace
o Tools to develop, test, package new custom
visuals
• Visualizations on report page are
connected – select value in one
visualization to change other visualizations
• Full screen pop out mode for report visuals
to show additional details
Share &
collaborate
Visualize
Explore
Prepare
Visualize your DATA
Share &
collaborate
Visualize
Explore
Prepare • Save Power BI Desktop report files and
easily publish them to powerbi.com
• Access dashboards using native mobile
apps for Windows, iOS and Android
• Share as appropriate with other Power BI
users in your organization
• Package your reports in apps for easy
consumption and control
• Easily embed interactive Power BI
visualizations in blog posts, websites,
through emails or social media With
Power BI Publish to web
Bring your story to life with DATA
Power BI: experience your data
Any data, any way, anywhere
Power BI
National Clouds
43 34
February 2019
*Gartner “Magic Quadrant for Analytics and Business Intelligence Platforms,” by Cindi Howson, James Richardson, Rita Sallam, Austin Kronz, 11 February 2019
The above graphics were published by Gartner, Inc. as part of a larger research document and should be evaluated in the context of the entire document. The Gartner document is available upon request from Microsoft. Gartner does not endorse any
vendor, product or service depicted in its research publications, and does not advise technology users to select only those vendors with the highest ratings or other designation. Gartner research publications consist of the opinions of Gartner's research
organization and should not be construed as statements of fact. Gartner disclaims all warranties, expressed or implied, with respect to this research, including any warranties of merchantability or fitness for a particular purpose. GARTNER is a registered
trademark and service mark of Gartner, Inc. and/or its affiliates in the U.S. and internationally and is used herein with permission. All rights reserved.
January 2019
*Gartner Magic Quadrant for Data Management Solutions for Analytics, Adam Ronthal, Roxane Edjlali, Rick Greenwald, 21 January 2019.
The above graphics were published by Gartner, Inc. as part of a larger research document and should be evaluated in the context of the entire document. The Gartner document is available upon request from Microsoft. Gartner does not endorse any
vendor, product or service depicted in its research publications, and does not advise technology users to select only those vendors with the highest ratings or other designation. Gartner research publications consist of the opinions of Gartner's research
organization and should not be construed as statements of fact. Gartner disclaims all warranties, expressed or implied, with respect to this research, including any warranties of merchantability or fitness for a particular purpose. GARTNER is a registered
trademark and service mark of Gartner, Inc. and/or its affiliates in the U.S. and internationally and is used herein with permission. All rights reserved.
Agenda (times are approximate and will be fluid with the class)
Morning
• 9:00 AM – 10:00 AM – Introduction to Power BI and Power BI Desktop
overview
• 10:15 AM – 11:00 PM – Power BI Desktop – Lab
• 11:15 PM – 12:15 PM – Power BI Desktop – Demos
• 12:15 PM – 1:00 PM – Break and Q&A with speaker
Afternoon
• 01:00 PM – 02:00 PM – Power BI Desktop, Services – Lab (Continued)
• 02:15 PM – 03:15 PM – Power BI Report Server Overview & Best Practice
• 03:30 PM – 04:30 PM – Power Platform end to end Demo
Power BI Desktop
Labs - Hands-on learning
Agenda (times are approximate and will be fluid with the class)
Morning
• 9:00 AM – 10:00 AM – Introduction to Power BI and Power BI Desktop
overview
• 10:15 AM – 11:00 PM – Power BI Desktop – Lab
• 11:15 PM – 12:15 PM – Power BI Desktop – Demos
• 12:15 PM – 1:00 PM – Break and Q&A with speaker
Afternoon
• 01:00 PM – 02:00 PM – Power BI Desktop, Services – Lab (Continued)
• 02:15 PM – 03:15 PM – Power BI Report Server Overview & Best Practice
• 03:30 PM – 04:30 PM – Power Platform end to end Demo
Explore and share your data stories
In the Data Stories Gallery
Power BI Desktop
Demo
Agenda (times are approximate and will be fluid with the class)
Morning
• 9:00 AM – 10:00 AM – Introduction to Power BI and Power BI Desktop
overview
• 10:15 AM – 11:00 PM – Power BI Desktop – Lab
• 11:15 PM – 12:15 PM – Power BI Desktop – Demos
• 12:15 PM – 1:00 PM – Break and Q&A with speaker
Afternoon
• 01:00 PM – 02:00 PM – Power BI Desktop, Services – Lab (Continued)
• 02:15 PM – 03:15 PM – Power BI Report Server Overview & Best Practice
• 03:30 PM – 04:30 PM – Power Platform end to end Demo
Q & A..(AMA)Ask Me Anything ?
✓ Power BI
✓ Power Apps
✓ Power Automate
✓ Azure
Agenda (times are approximate and will be fluid with the class)
Morning
• 9:00 AM – 10:00 AM – Introduction to Power BI and Power BI Desktop
overview
• 10:15 AM – 11:00 PM – Power BI Desktop – Lab
• 11:15 PM – 12:15 PM – Power BI Desktop – Demos
• 12:15 PM – 1:00 PM – Break and Q&A with speaker
Afternoon
• 01:00 PM – 02:00 PM – Power BI Desktop, Services – Lab (Continued)
• 02:15 PM – 03:15 PM – Power BI Report Server Overview & Best Practice
• 03:30 PM – 04:30 PM – Power Platform end to end Demo
Power BI Service
Demo
Agenda (times are approximate and will be fluid with the class)
Morning
• 9:00 AM – 10:00 AM – Introduction to Power BI and Power BI Desktop
overview
• 10:15 AM – 11:00 PM – Power BI Desktop – Lab
• 11:15 PM – 12:15 PM – Power BI Desktop – Demos
• 12:15 PM – 1:00 PM – Break and Q&A with speaker
Afternoon
• 01:00 PM – 02:00 PM – Power BI Desktop, Services – Lab (Continued)
• 02:15 PM – 03:15 PM – Power BI Report Server Overview & Best Practice
• 03:30 PM – 04:30 PM – Power Platform end to end Demo
Agenda (times are approximate and will be fluid with the class)
Morning
• 9:00 AM – 10:00 AM – Introduction to Power BI and Power BI Desktop
overview
• 10:15 AM – 11:00 PM – Power BI Desktop – Lab
• 11:15 PM – 12:15 PM – Power BI Desktop – Demos
• 12:15 PM – 1:00 PM – Break and Q&A with speaker
Afternoon
• 01:00 PM – 02:00 PM – Power BI Desktop, Services – Lab (Continued)
• 02:15 PM – 03:15 PM – Power BI Report Server Overview & Best Practice
• 03:30 PM – 04:30 PM – Power Platform end to end Demo
Power BI Report Server History
SSRS
Modern Lifecycle Policy – Future Release
Year 1 Year 2
Security &
Critical
Updates
Security Updates (Only)
Security &
Critical
Updates
Security Updates (Only)
Security &
Critical
Updates
Security Updates (Only)
Release 1
Release 2
Release 3
Support EndsNew Release
Frequent releases
(planning ~3 per year)
Security & critical updates
until next release
Security updates continue for
remainder of 12 months
Power BI Report Server Release
Report Management
How Organizations Use Power BI Report Server
Create interactive reports
in Power BI Desktop
Create Publish
Publish to Power BI Report Server
Consume
View and interact in
Power BI Mobile or web browser
How Organizations Consume PBRS
HTML5 rs:Embed=true
Mobile apps
</>
Windows
Android
iOS
Web portal Embedded In your apps
Power BI Report Server for Enterprise
Lifecycle
Frequent releases
Security
Integrate with ADFSScale up and out
Scalability
Migrate from SQL Server
Reporting Services
MigrationInstallation
Lightweight
download and
installation
Power BI Report Server topology
Migrate from SSRS (Native mode)
SSRS Power BI Report Server
1. Back up report server database
2. Install Power BI Report Server
3. Connect report server to database
using Report Server Configuration
Manager
Copy/Move
Report Server
Database
Report
Server Database
How to acquire Power BI Report Server
PBI RS Installation
Lightweight download and installation
Requirements
• Windows Server 2012+
• SQL Server Database Engine (2008+)
• SQL Server Analysis Services (2012+)
Zero impact on SQL Server
On-Premises (Non-Cloud)-Architecture
Power BI Report Server - Demo
• PBI RS – Site Setting ,Help overview
• PBI Desktop OPTIMIZED to PBI RS ( Where to find?)
• Tools to Publish Report to PBI RS
• Power BI Optimized Desktop to PBI RS
• Visual Studio SSDT SSRS publishing to PBI RS
• Mobile Report publishing to PBI RS
• Power BI Report Builder to PBI RS
• Report Server DB – Metadata, Special Query
• Branding - PBI Report Server
• Report Server execution log – Publish
• Full Screen ?rs:embed=true
• Comment, Refresh Data and Scheduling
• Open and Edit directly from tool and Publish
• Access, Folder, and Many more things to do
Best Practices for Power BI Report Server
• Development – Version, Upgrade & Migration
• Security - AD, SQL read account
• Administration – Report for Report ☺ !
• Upgradation – Decide your strategy, 6 Month Good**
• Scheduling - Shared Data Scheduling
• Usage – Import VS Direct query
• Metadata - Report Server DB
This ugly report page needs a lot of work
Agenda (times are approximate and will be fluid with the class)
Morning
• 9:00 AM – 10:00 AM – Introduction to Power BI and Power BI Desktop
overview
• 10:15 AM – 11:00 PM – Power BI Desktop – Lab
• 11:15 PM – 12:15 PM – Power BI Desktop – Demos
• 12:15 PM – 1:00 PM – Break and Q&A with speaker
Afternoon
• 01:00 PM – 02:00 PM – Power BI Desktop, Services – Lab (Continued)
• 02:15 PM – 03:15 PM – Power BI Report Server Overview & Best Practice
• 03:30 PM – 04:30 PM – Power Platform end to end Demo
Dynamics 365
Office 365
Standalone Apps
Microsoft
Power platform Azure
Common Data Service for Apps and
Data Connectors
MaintenanceDataPriceResourcesTime
Why PowerApps and Power Automate
What
PowerApps
An application Platform as a Service (aPaaS) for citizen-
developers to build high-productivity business apps
Model-driven apps leverage your
data model, relationships, and
business processes to automatically
generate immersive, responsive
applications
Canvas apps start with user
experience, with pixel-perfect
control to build highly customized
task- and role-based apps that
mash up data from 230+ sources
Types of PowerApps apps
Connect to data &
systems you’re already
using easily
Create apps, forms, and
workflows without
writing code
Use apps on any
device – both web
and mobile
Canvas Apps help business-power-users to create and
use custom business apps across platforms
using Excel and PowerPoint skills
Craft forms and screens
in a visual designer that
helps you see exactly
what you’ll get
Take advantage
of device capabilities
like cameras, GPS,
and digital ink
Extend the capabilities
of connected data
sources, or focus just
on the bits you need
Build business logic
into your apps with
an Excel-inspired
expression language
PowerApps Studio for canvas apps
Built-in connectivity to 230+ cloud services,
content services, databases, APIs, etc.
Seamless hybrid connectivity to on-premises
systems via the On-Premises Data Gateway
Custom Connector support allows the registration
of developer / IT systems as a building block for
citizen developers
Use multiple data sources in a single application
for processes that span systems
230+ Built-in Connectors
+ Custom Connectors
Get apps to your team when and where
they’re needed, whether that’s on the web,
iOS or Android—no app store required.
Embed apps into the tools you’re already using
Customize SharePoint forms
Customers can quickly customize standard
forms on any SharePoint list, auto-generate
rich mobile apps, and automate workflow and
approval processes – all directly from within
SharePoint.
Embed apps in Power BI, Teams
Build PowerApps to extend Power BI, Teams,
and more. We’ve also recently announced
that 3rd party ISVs will be able to take
advantage of the same capabilities to extend
their software.
Complex responsive apps
on web and mobile
PowerApps Model-driven apps provides a metadata-
driven architecture for creating and customizing apps
without writing code
Easily add Business rules and
Business process flows to model
your business processes
Rich component-
focused no-code design
environments
High-level architecture
SaaS apps
enterprise services
business systems
mobile
tablet
browser
Entities, fields & relationships
Entity: “An item with properties that you track, like contact or account.”
like a database table
Field: “A property that is associated with the entity.”
like a database column in a table
Relationships: “Defines how entities can be related to each other.”
like relationships in database – 1:1, 1:N & N:N
Forms
• Definition: “a page that displays fields of a single record for a single entity”
Views
• Definition: “a page that displays fields from multiple records for a single entity”
Interactive Dashboards
• Definition: “a page that allows interactive filtering of data from one or more entities”
Microsoft Flow >> Power Automate
Microsoft Flow is a service for business users
to automate workflows across apps and services
What makes up a flow?
Four types of flows
Scheduled flows
Automated
flows
Business
process flows
Instant flows
Scheduled flows
• Run regular reports—send out your team a
summary everything that’s happened in the
past week
• Data backups—copy data from one system to
another on a fixed interval
• Everything from simple schedules like every day, to
advanced schedules like every 3rd Monday
• Scheduled flows can also be run on-demand by any
Owners of the flow—including from the Teams Flow
bot
Instant flows
• Click a button inside of Flow mobile, SharePoint,
Dynamics, PowerApps or Excel that passes context
directly in to your flow
• These can be shared with Run only users so that
other people can Run them without seeing the
details or editing them
Automated flows
• Starts with an event or trigger
• For example, Emails being received, RSS feeds,
new items being added to a database
• Over 170 different triggers available
• Like the previous 2 types of flows—support
any number of actions in 200+ connectors
Business process flows
• Create stages or screens that enforce a
certain sequence of steps
• For each stage, collect data from the user
and/or and kick off automated workflows
• Create branching logic based on the data
Data sources?
• Excel on OneDrive
• Excel on Dropbox
• Excel on Google Drive
• Office 365
• SharePoint Online lists
• Google Sheets
• Salesforce
• Dynamics CRM
SaaS data sources
Expressions Actions and Conditions
Azure API App,
Azure Function
Azure Service Bus
▪ Step 1
▪ Create a MS Form
Demo – Together
▪ Step 2
▪ Create Streaming Data Set in Power BI
Demo – Together
▪ Step 3
▪ Create Flow to add Row in
Power BI
Demo – Together
▪ Step 4
▪ Power BI Desktop
▪ Publish data
Demo – Together
Power BI Best Practices – General
• Limit the number of visuals in dashboards and reports
• To improve Power BI report performance, remove unnecessary interactions between visuals
• Enable Row-Level Security (RLS) where applicable
• Use Microsoft AppSource certified custom visuals where applicable
• If you observe poor performance in Power BI, do not use hierarchical filters
• Provide data categorization for Power BI reports (HBI, MBI, LBI)
• Use the On-premises data gateway instead of Personal Gateway
• Use different Power BI gateways for “Direct Query” and “Scheduled Refresh”
• Test each custom visual on a report for performance to ensure fast report load time
• Limit complicated measures and aggregations in data models
• Use slicers sparingly
• Ensure that the Power BI report and the data source are in the same region
• Import only necessary fields and tables instead of entire datasets
• Ensure the cache update frequency aligns with the data source refresh frequency
Reference & Call to action
• Download Power BI Report Server
• Read the documentation
• Subscribe to the Power BI Blog
• Follow @MSPowerBI on Twitter
• Join the Power BI Community
• https://docs.microsoft.com
• https://www.blue-granite.com/blog/
• https://maqsoftware.com/expertise/powerbi/power-bi-best-practices
• Best design practices for reports and visuals – Microsoft Corporation, published June 22, 2018
• Tips for designing a great Power BI dashboard – Microsoft Corporation, published June 22, 2018
• Power BI Performance Best Practices – Microsoft Corporation, published May 18, 2018
850K
Active Community
Members
JOIN OUR THRIVING
COMMUNITY
103,431 Users 16,432 Ideas Submitted 3,162 Active IdeasUSER VOICE:
Join our Global Community today!
community.powerbi.com
Independent Power BI User
Groups World Wide222
ENGAGE WITH A
USER GROUP
User Groups Members in
over 60 countries49,685
Join your local PUG today!
pbiusergroup.com
Find industry solutions in the Partner Showcase
Maximize your BI investments with analytics
Free Gartner Report Free eBook Free eBook
Get Started Today with Free Azure SQL Data Warehouse Trial
Free Infographic
Q&A

Weitere ähnliche Inhalte

Was ist angesagt?

Excel Power Query Secrets: How to Cut Data Prep Time by 75%
Excel Power Query Secrets: How to Cut Data Prep Time by 75%Excel Power Query Secrets: How to Cut Data Prep Time by 75%
Excel Power Query Secrets: How to Cut Data Prep Time by 75%Doug Burke
 
Business Intelligence solutions using Excel 2013 and Power BI
Business Intelligence solutions using Excel 2013 and Power BIBusiness Intelligence solutions using Excel 2013 and Power BI
Business Intelligence solutions using Excel 2013 and Power BIAlan Koo
 
Summary of all tools and microsoft power bi
Summary of all tools and microsoft power biSummary of all tools and microsoft power bi
Summary of all tools and microsoft power biOmar Khan
 
Inside PerformancePoint
Inside PerformancePointInside PerformancePoint
Inside PerformancePointDan English
 
Introducing power bi in your company - andrea martorana tusa
Introducing power bi in your company - andrea martorana tusaIntroducing power bi in your company - andrea martorana tusa
Introducing power bi in your company - andrea martorana tusaAndrea Martorana Tusa
 
Primer on Power BI 201501
Primer on Power BI 201501Primer on Power BI 201501
Primer on Power BI 201501Mark Tabladillo
 
Personal bi to personal data science
Personal bi to personal data sciencePersonal bi to personal data science
Personal bi to personal data scienceJan Mulkens
 
South Florida SQL Saturday - Power BI Report Server Enterprise Architecture, ...
South Florida SQL Saturday - Power BI Report Server Enterprise Architecture, ...South Florida SQL Saturday - Power BI Report Server Enterprise Architecture, ...
South Florida SQL Saturday - Power BI Report Server Enterprise Architecture, ...Vishal Pawar
 
vOffice365 - May 2016 - Overview of Microsoft's Power BI - Sean Wallbridge
vOffice365 - May 2016 - Overview of Microsoft's Power BI -  Sean WallbridgevOffice365 - May 2016 - Overview of Microsoft's Power BI -  Sean Wallbridge
vOffice365 - May 2016 - Overview of Microsoft's Power BI - Sean WallbridgeRegroove
 
Leveraging Microsoft Power BI To Support Enterprise Business Intelligence
Leveraging Microsoft Power BI To Support Enterprise Business IntelligenceLeveraging Microsoft Power BI To Support Enterprise Business Intelligence
Leveraging Microsoft Power BI To Support Enterprise Business IntelligenceRightpoint
 
Intro to BI Semantic Model &amp; Self-Service Reporting with Power View
Intro to BI Semantic Model &amp; Self-Service Reporting with Power ViewIntro to BI Semantic Model &amp; Self-Service Reporting with Power View
Intro to BI Semantic Model &amp; Self-Service Reporting with Power ViewDan English
 
Microsoft Power BI
Microsoft Power BIMicrosoft Power BI
Microsoft Power BIGeetika
 
Solution Business Intelligent- linked in
Solution Business Intelligent- linked inSolution Business Intelligent- linked in
Solution Business Intelligent- linked inSuprijotomo ,ST
 
Microsoft Power BI 101
Microsoft Power BI 101Microsoft Power BI 101
Microsoft Power BI 101Sharon Weaver
 
Self-Service Data Integration with Power Query - SQLSaturday #364 Boston
Self-Service Data Integration with Power Query - SQLSaturday #364 Boston  Self-Service Data Integration with Power Query - SQLSaturday #364 Boston
Self-Service Data Integration with Power Query - SQLSaturday #364 Boston Stéphane Fréchette
 
Power BI Secrets
Power BI SecretsPower BI Secrets
Power BI SecretsDoug Burke
 
What's New with BI in SQL Server Denali (SQL11)
What's New with BI in SQL Server Denali (SQL11)What's New with BI in SQL Server Denali (SQL11)
What's New with BI in SQL Server Denali (SQL11)Dan English
 
Dynamics Day 2014: Microsoft Dynamics AX - Business Insight Leveraging Analytics
Dynamics Day 2014: Microsoft Dynamics AX - Business Insight Leveraging AnalyticsDynamics Day 2014: Microsoft Dynamics AX - Business Insight Leveraging Analytics
Dynamics Day 2014: Microsoft Dynamics AX - Business Insight Leveraging AnalyticsIntergen
 

Was ist angesagt? (20)

Excel Power Query Secrets: How to Cut Data Prep Time by 75%
Excel Power Query Secrets: How to Cut Data Prep Time by 75%Excel Power Query Secrets: How to Cut Data Prep Time by 75%
Excel Power Query Secrets: How to Cut Data Prep Time by 75%
 
Business Intelligence solutions using Excel 2013 and Power BI
Business Intelligence solutions using Excel 2013 and Power BIBusiness Intelligence solutions using Excel 2013 and Power BI
Business Intelligence solutions using Excel 2013 and Power BI
 
Summary of all tools and microsoft power bi
Summary of all tools and microsoft power biSummary of all tools and microsoft power bi
Summary of all tools and microsoft power bi
 
Power BI
Power BIPower BI
Power BI
 
Inside PerformancePoint
Inside PerformancePointInside PerformancePoint
Inside PerformancePoint
 
Power BI Overview
Power BI Overview Power BI Overview
Power BI Overview
 
Introducing power bi in your company - andrea martorana tusa
Introducing power bi in your company - andrea martorana tusaIntroducing power bi in your company - andrea martorana tusa
Introducing power bi in your company - andrea martorana tusa
 
Primer on Power BI 201501
Primer on Power BI 201501Primer on Power BI 201501
Primer on Power BI 201501
 
Personal bi to personal data science
Personal bi to personal data sciencePersonal bi to personal data science
Personal bi to personal data science
 
South Florida SQL Saturday - Power BI Report Server Enterprise Architecture, ...
South Florida SQL Saturday - Power BI Report Server Enterprise Architecture, ...South Florida SQL Saturday - Power BI Report Server Enterprise Architecture, ...
South Florida SQL Saturday - Power BI Report Server Enterprise Architecture, ...
 
vOffice365 - May 2016 - Overview of Microsoft's Power BI - Sean Wallbridge
vOffice365 - May 2016 - Overview of Microsoft's Power BI -  Sean WallbridgevOffice365 - May 2016 - Overview of Microsoft's Power BI -  Sean Wallbridge
vOffice365 - May 2016 - Overview of Microsoft's Power BI - Sean Wallbridge
 
Leveraging Microsoft Power BI To Support Enterprise Business Intelligence
Leveraging Microsoft Power BI To Support Enterprise Business IntelligenceLeveraging Microsoft Power BI To Support Enterprise Business Intelligence
Leveraging Microsoft Power BI To Support Enterprise Business Intelligence
 
Intro to BI Semantic Model &amp; Self-Service Reporting with Power View
Intro to BI Semantic Model &amp; Self-Service Reporting with Power ViewIntro to BI Semantic Model &amp; Self-Service Reporting with Power View
Intro to BI Semantic Model &amp; Self-Service Reporting with Power View
 
Microsoft Power BI
Microsoft Power BIMicrosoft Power BI
Microsoft Power BI
 
Solution Business Intelligent- linked in
Solution Business Intelligent- linked inSolution Business Intelligent- linked in
Solution Business Intelligent- linked in
 
Microsoft Power BI 101
Microsoft Power BI 101Microsoft Power BI 101
Microsoft Power BI 101
 
Self-Service Data Integration with Power Query - SQLSaturday #364 Boston
Self-Service Data Integration with Power Query - SQLSaturday #364 Boston  Self-Service Data Integration with Power Query - SQLSaturday #364 Boston
Self-Service Data Integration with Power Query - SQLSaturday #364 Boston
 
Power BI Secrets
Power BI SecretsPower BI Secrets
Power BI Secrets
 
What's New with BI in SQL Server Denali (SQL11)
What's New with BI in SQL Server Denali (SQL11)What's New with BI in SQL Server Denali (SQL11)
What's New with BI in SQL Server Denali (SQL11)
 
Dynamics Day 2014: Microsoft Dynamics AX - Business Insight Leveraging Analytics
Dynamics Day 2014: Microsoft Dynamics AX - Business Insight Leveraging AnalyticsDynamics Day 2014: Microsoft Dynamics AX - Business Insight Leveraging Analytics
Dynamics Day 2014: Microsoft Dynamics AX - Business Insight Leveraging Analytics
 

Ähnlich wie Choctaw Nation - Power bi dashboard, report server report in Day

General Presentation - DIAD and AIAD, Dashboard and Apps
General Presentation - DIAD and AIAD, Dashboard and AppsGeneral Presentation - DIAD and AIAD, Dashboard and Apps
General Presentation - DIAD and AIAD, Dashboard and AppsVishal Pawar
 
Power bi-dashboard-in-a-day-diad-mumbai-2019
Power bi-dashboard-in-a-day-diad-mumbai-2019Power bi-dashboard-in-a-day-diad-mumbai-2019
Power bi-dashboard-in-a-day-diad-mumbai-2019Priyanka Khanadali
 
Introduction to Microsoft Power BI
Introduction to Microsoft Power BIIntroduction to Microsoft Power BI
Introduction to Microsoft Power BICCG
 
20220205 Getting started with power bi
20220205 Getting started with power bi20220205 Getting started with power bi
20220205 Getting started with power biAroh Shukla
 
Power BI Overview, Deployment and Governance
Power BI Overview, Deployment and GovernancePower BI Overview, Deployment and Governance
Power BI Overview, Deployment and GovernanceJames Serra
 
All you must know about Power BI!.
All you must know about Power BI!.All you must know about Power BI!.
All you must know about Power BI!.TechSoup
 
All you must know about Power BI!
All you must know about Power BI!All you must know about Power BI!
All you must know about Power BI!ArethaSimons
 
Power BI vs Tableau - An Overview from EPC Group.pptx
Power BI vs Tableau - An Overview from EPC Group.pptxPower BI vs Tableau - An Overview from EPC Group.pptx
Power BI vs Tableau - An Overview from EPC Group.pptxEPC Group
 
Modern Business Intelligence - Design and Implementations
Modern Business Intelligence - Design and ImplementationsModern Business Intelligence - Design and Implementations
Modern Business Intelligence - Design and ImplementationsDavid J Rosenthal
 
PowerBI Convince your boss with your ideas.pdf
PowerBI Convince your boss with your ideas.pdfPowerBI Convince your boss with your ideas.pdf
PowerBI Convince your boss with your ideas.pdfRocky9949
 
Cherokee nation 2 day AIAD & DIAD - App in a day and Dashboard in day
Cherokee nation 2 day AIAD & DIAD - App in a day and Dashboard in dayCherokee nation 2 day AIAD & DIAD - App in a day and Dashboard in day
Cherokee nation 2 day AIAD & DIAD - App in a day and Dashboard in dayVishal Pawar
 
SharePoint Inspired 'Get more from your data with Office 365'
SharePoint Inspired 'Get more from your data with Office 365'SharePoint Inspired 'Get more from your data with Office 365'
SharePoint Inspired 'Get more from your data with Office 365'Xylos
 
PowerBI Quick Start
PowerBI Quick StartPowerBI Quick Start
PowerBI Quick StartMILL5
 
Product Management 101 for Data and Analytics
Product Management 101 for Data and Analytics Product Management 101 for Data and Analytics
Product Management 101 for Data and Analytics Ravi Padaki
 
SPS Vancouver 2018 - What is CDM and CDS
SPS Vancouver 2018 - What is CDM and CDSSPS Vancouver 2018 - What is CDM and CDS
SPS Vancouver 2018 - What is CDM and CDSNicolas Georgeault
 
Company Profile - NPC with TIBCO Spotfire solution
Company Profile - NPC with TIBCO Spotfire solution  Company Profile - NPC with TIBCO Spotfire solution
Company Profile - NPC with TIBCO Spotfire solution Sirinporn Setworaya
 
Power BI: From the Basics
Power BI: From the BasicsPower BI: From the Basics
Power BI: From the BasicsNikkia Carter
 

Ähnlich wie Choctaw Nation - Power bi dashboard, report server report in Day (20)

General Presentation - DIAD and AIAD, Dashboard and Apps
General Presentation - DIAD and AIAD, Dashboard and AppsGeneral Presentation - DIAD and AIAD, Dashboard and Apps
General Presentation - DIAD and AIAD, Dashboard and Apps
 
Dashboard in a Day
Dashboard in a DayDashboard in a Day
Dashboard in a Day
 
Power bi-dashboard-in-a-day-diad-mumbai-2019
Power bi-dashboard-in-a-day-diad-mumbai-2019Power bi-dashboard-in-a-day-diad-mumbai-2019
Power bi-dashboard-in-a-day-diad-mumbai-2019
 
Introduction to Microsoft Power BI
Introduction to Microsoft Power BIIntroduction to Microsoft Power BI
Introduction to Microsoft Power BI
 
20220205 Getting started with power bi
20220205 Getting started with power bi20220205 Getting started with power bi
20220205 Getting started with power bi
 
Power BI Overview, Deployment and Governance
Power BI Overview, Deployment and GovernancePower BI Overview, Deployment and Governance
Power BI Overview, Deployment and Governance
 
All you must know about Power BI!.
All you must know about Power BI!.All you must know about Power BI!.
All you must know about Power BI!.
 
All you must know about Power BI!
All you must know about Power BI!All you must know about Power BI!
All you must know about Power BI!
 
Power BI vs Tableau - An Overview from EPC Group.pptx
Power BI vs Tableau - An Overview from EPC Group.pptxPower BI vs Tableau - An Overview from EPC Group.pptx
Power BI vs Tableau - An Overview from EPC Group.pptx
 
Modern Business Intelligence - Design and Implementations
Modern Business Intelligence - Design and ImplementationsModern Business Intelligence - Design and Implementations
Modern Business Intelligence - Design and Implementations
 
PowerBI Convince your boss with your ideas.pdf
PowerBI Convince your boss with your ideas.pdfPowerBI Convince your boss with your ideas.pdf
PowerBI Convince your boss with your ideas.pdf
 
Cherokee nation 2 day AIAD & DIAD - App in a day and Dashboard in day
Cherokee nation 2 day AIAD & DIAD - App in a day and Dashboard in dayCherokee nation 2 day AIAD & DIAD - App in a day and Dashboard in day
Cherokee nation 2 day AIAD & DIAD - App in a day and Dashboard in day
 
Data analytics and powerbi intro
Data analytics and powerbi introData analytics and powerbi intro
Data analytics and powerbi intro
 
SharePoint Inspired 'Get more from your data with Office 365'
SharePoint Inspired 'Get more from your data with Office 365'SharePoint Inspired 'Get more from your data with Office 365'
SharePoint Inspired 'Get more from your data with Office 365'
 
PowerBI Quick Start
PowerBI Quick StartPowerBI Quick Start
PowerBI Quick Start
 
Product Management 101 for Data and Analytics
Product Management 101 for Data and Analytics Product Management 101 for Data and Analytics
Product Management 101 for Data and Analytics
 
SPS Vancouver 2018 - What is CDM and CDS
SPS Vancouver 2018 - What is CDM and CDSSPS Vancouver 2018 - What is CDM and CDS
SPS Vancouver 2018 - What is CDM and CDS
 
Company Profile - NPC with TIBCO Spotfire solution
Company Profile - NPC with TIBCO Spotfire solution  Company Profile - NPC with TIBCO Spotfire solution
Company Profile - NPC with TIBCO Spotfire solution
 
Power BI: From the Basics
Power BI: From the BasicsPower BI: From the Basics
Power BI: From the Basics
 
Bake-off Power BI
Bake-off Power BIBake-off Power BI
Bake-off Power BI
 

Mehr von Vishal Pawar

Architectural Guidance Connecting HANA Live to Power BI
Architectural Guidance Connecting HANA Live to Power BIArchitectural Guidance Connecting HANA Live to Power BI
Architectural Guidance Connecting HANA Live to Power BIVishal Pawar
 
Secrete of 5 min Power BI Report Development
Secrete of 5 min Power BI Report Development Secrete of 5 min Power BI Report Development
Secrete of 5 min Power BI Report Development Vishal Pawar
 
Pascua Yaqui Tribe App in a day and dashboard in day
Pascua Yaqui Tribe App in a day and dashboard in dayPascua Yaqui Tribe App in a day and dashboard in day
Pascua Yaqui Tribe App in a day and dashboard in dayVishal Pawar
 
Sql Saturday Jacksonville- Power BI Report Server Enterprise Architecture, to...
Sql Saturday Jacksonville- Power BI Report Server Enterprise Architecture, to...Sql Saturday Jacksonville- Power BI Report Server Enterprise Architecture, to...
Sql Saturday Jacksonville- Power BI Report Server Enterprise Architecture, to...Vishal Pawar
 
Power BI Report Server Enterprise Architecture, Tools to Publish reports and ...
Power BI Report Server Enterprise Architecture, Tools to Publish reports and ...Power BI Report Server Enterprise Architecture, Tools to Publish reports and ...
Power BI Report Server Enterprise Architecture, Tools to Publish reports and ...Vishal Pawar
 
All Microsoft Azure Service offering Consolidated in one page
All Microsoft Azure Service offering Consolidated in one pageAll Microsoft Azure Service offering Consolidated in one page
All Microsoft Azure Service offering Consolidated in one pageVishal Pawar
 
Groupby -Power bi dashboard in hour by vishal pawar-Presentation
Groupby -Power bi dashboard in hour by vishal pawar-Presentation Groupby -Power bi dashboard in hour by vishal pawar-Presentation
Groupby -Power bi dashboard in hour by vishal pawar-Presentation Vishal Pawar
 
Power bi dashboard in hour Agenda
Power bi dashboard in hour AgendaPower bi dashboard in hour Agenda
Power bi dashboard in hour AgendaVishal Pawar
 
Dashboard for Life Series “Episode 02 - David Kay's Kickstarter Funded Projec...
Dashboard for Life Series “Episode 02 - David Kay's Kickstarter Funded Projec...Dashboard for Life Series “Episode 02 - David Kay's Kickstarter Funded Projec...
Dashboard for Life Series “Episode 02 - David Kay's Kickstarter Funded Projec...Vishal Pawar
 
Dashboard for Life Series “Episode 1 - Vishal's Server SQL Info Dashboard
Dashboard for Life Series “Episode 1 - Vishal's Server SQL Info DashboardDashboard for Life Series “Episode 1 - Vishal's Server SQL Info Dashboard
Dashboard for Life Series “Episode 1 - Vishal's Server SQL Info DashboardVishal Pawar
 
Power BI February update with Recent Cool features
Power BI February update with Recent Cool features Power BI February update with Recent Cool features
Power BI February update with Recent Cool features Vishal Pawar
 
How to Get Lightning Fast Answers with Power BI Q&A and Cortana
How to Get Lightning Fast Answers with Power BI Q&A and CortanaHow to Get Lightning Fast Answers with Power BI Q&A and Cortana
How to Get Lightning Fast Answers with Power BI Q&A and CortanaVishal Pawar
 
SSIS coding conventions, best practices, tips and programming guidelines for ...
SSIS coding conventions, best practices, tips and programming guidelines for ...SSIS coding conventions, best practices, tips and programming guidelines for ...
SSIS coding conventions, best practices, tips and programming guidelines for ...Vishal Pawar
 
Fascinate with SQL SSIS Parallel processing
Fascinate with SQL SSIS Parallel processing Fascinate with SQL SSIS Parallel processing
Fascinate with SQL SSIS Parallel processing Vishal Pawar
 
SSAS, MDX , Cube understanding, Browsing and Tools information
SSAS, MDX , Cube understanding, Browsing and Tools information SSAS, MDX , Cube understanding, Browsing and Tools information
SSAS, MDX , Cube understanding, Browsing and Tools information Vishal Pawar
 
Business Analytics to solve your Business Problems
Business Analytics to solve your Business ProblemsBusiness Analytics to solve your Business Problems
Business Analytics to solve your Business ProblemsVishal Pawar
 
Introduction To SQL Server 2014
Introduction To SQL Server 2014Introduction To SQL Server 2014
Introduction To SQL Server 2014Vishal Pawar
 
Microsoft SQL Server 2012 Certifications and Training
Microsoft SQL Server 2012 Certifications and TrainingMicrosoft SQL Server 2012 Certifications and Training
Microsoft SQL Server 2012 Certifications and TrainingVishal Pawar
 
Introduction To Microsoft SharePoint 2013
Introduction To Microsoft SharePoint 2013Introduction To Microsoft SharePoint 2013
Introduction To Microsoft SharePoint 2013Vishal Pawar
 

Mehr von Vishal Pawar (20)

Architectural Guidance Connecting HANA Live to Power BI
Architectural Guidance Connecting HANA Live to Power BIArchitectural Guidance Connecting HANA Live to Power BI
Architectural Guidance Connecting HANA Live to Power BI
 
Secrete of 5 min Power BI Report Development
Secrete of 5 min Power BI Report Development Secrete of 5 min Power BI Report Development
Secrete of 5 min Power BI Report Development
 
Pascua Yaqui Tribe App in a day and dashboard in day
Pascua Yaqui Tribe App in a day and dashboard in dayPascua Yaqui Tribe App in a day and dashboard in day
Pascua Yaqui Tribe App in a day and dashboard in day
 
Sql Saturday Jacksonville- Power BI Report Server Enterprise Architecture, to...
Sql Saturday Jacksonville- Power BI Report Server Enterprise Architecture, to...Sql Saturday Jacksonville- Power BI Report Server Enterprise Architecture, to...
Sql Saturday Jacksonville- Power BI Report Server Enterprise Architecture, to...
 
Power BI Report Server Enterprise Architecture, Tools to Publish reports and ...
Power BI Report Server Enterprise Architecture, Tools to Publish reports and ...Power BI Report Server Enterprise Architecture, Tools to Publish reports and ...
Power BI Report Server Enterprise Architecture, Tools to Publish reports and ...
 
All Microsoft Azure Service offering Consolidated in one page
All Microsoft Azure Service offering Consolidated in one pageAll Microsoft Azure Service offering Consolidated in one page
All Microsoft Azure Service offering Consolidated in one page
 
Groupby -Power bi dashboard in hour by vishal pawar-Presentation
Groupby -Power bi dashboard in hour by vishal pawar-Presentation Groupby -Power bi dashboard in hour by vishal pawar-Presentation
Groupby -Power bi dashboard in hour by vishal pawar-Presentation
 
Power bi dashboard in hour Agenda
Power bi dashboard in hour AgendaPower bi dashboard in hour Agenda
Power bi dashboard in hour Agenda
 
Dashboard for Life Series “Episode 02 - David Kay's Kickstarter Funded Projec...
Dashboard for Life Series “Episode 02 - David Kay's Kickstarter Funded Projec...Dashboard for Life Series “Episode 02 - David Kay's Kickstarter Funded Projec...
Dashboard for Life Series “Episode 02 - David Kay's Kickstarter Funded Projec...
 
Dashboard for Life Series “Episode 1 - Vishal's Server SQL Info Dashboard
Dashboard for Life Series “Episode 1 - Vishal's Server SQL Info DashboardDashboard for Life Series “Episode 1 - Vishal's Server SQL Info Dashboard
Dashboard for Life Series “Episode 1 - Vishal's Server SQL Info Dashboard
 
Power BI for CEO
Power BI for CEOPower BI for CEO
Power BI for CEO
 
Power BI February update with Recent Cool features
Power BI February update with Recent Cool features Power BI February update with Recent Cool features
Power BI February update with Recent Cool features
 
How to Get Lightning Fast Answers with Power BI Q&A and Cortana
How to Get Lightning Fast Answers with Power BI Q&A and CortanaHow to Get Lightning Fast Answers with Power BI Q&A and Cortana
How to Get Lightning Fast Answers with Power BI Q&A and Cortana
 
SSIS coding conventions, best practices, tips and programming guidelines for ...
SSIS coding conventions, best practices, tips and programming guidelines for ...SSIS coding conventions, best practices, tips and programming guidelines for ...
SSIS coding conventions, best practices, tips and programming guidelines for ...
 
Fascinate with SQL SSIS Parallel processing
Fascinate with SQL SSIS Parallel processing Fascinate with SQL SSIS Parallel processing
Fascinate with SQL SSIS Parallel processing
 
SSAS, MDX , Cube understanding, Browsing and Tools information
SSAS, MDX , Cube understanding, Browsing and Tools information SSAS, MDX , Cube understanding, Browsing and Tools information
SSAS, MDX , Cube understanding, Browsing and Tools information
 
Business Analytics to solve your Business Problems
Business Analytics to solve your Business ProblemsBusiness Analytics to solve your Business Problems
Business Analytics to solve your Business Problems
 
Introduction To SQL Server 2014
Introduction To SQL Server 2014Introduction To SQL Server 2014
Introduction To SQL Server 2014
 
Microsoft SQL Server 2012 Certifications and Training
Microsoft SQL Server 2012 Certifications and TrainingMicrosoft SQL Server 2012 Certifications and Training
Microsoft SQL Server 2012 Certifications and Training
 
Introduction To Microsoft SharePoint 2013
Introduction To Microsoft SharePoint 2013Introduction To Microsoft SharePoint 2013
Introduction To Microsoft SharePoint 2013
 

Kürzlich hochgeladen

Best VIP Call Girls Noida Sector 39 Call Me: 8448380779
Best VIP Call Girls Noida Sector 39 Call Me: 8448380779Best VIP Call Girls Noida Sector 39 Call Me: 8448380779
Best VIP Call Girls Noida Sector 39 Call Me: 8448380779Delhi Call girls
 
Cheap Rate Call girls Sarita Vihar Delhi 9205541914 shot 1500 night
Cheap Rate Call girls Sarita Vihar Delhi 9205541914 shot 1500 nightCheap Rate Call girls Sarita Vihar Delhi 9205541914 shot 1500 night
Cheap Rate Call girls Sarita Vihar Delhi 9205541914 shot 1500 nightDelhi Call girls
 
Generative AI on Enterprise Cloud with NiFi and Milvus
Generative AI on Enterprise Cloud with NiFi and MilvusGenerative AI on Enterprise Cloud with NiFi and Milvus
Generative AI on Enterprise Cloud with NiFi and MilvusTimothy Spann
 
Determinants of health, dimensions of health, positive health and spectrum of...
Determinants of health, dimensions of health, positive health and spectrum of...Determinants of health, dimensions of health, positive health and spectrum of...
Determinants of health, dimensions of health, positive health and spectrum of...shambhavirathore45
 
100-Concepts-of-AI by Anupama Kate .pptx
100-Concepts-of-AI by Anupama Kate .pptx100-Concepts-of-AI by Anupama Kate .pptx
100-Concepts-of-AI by Anupama Kate .pptxAnupama Kate
 
Midocean dropshipping via API with DroFx
Midocean dropshipping via API with DroFxMidocean dropshipping via API with DroFx
Midocean dropshipping via API with DroFxolyaivanovalion
 
Call me @ 9892124323 Cheap Rate Call Girls in Vashi with Real Photo 100% Secure
Call me @ 9892124323  Cheap Rate Call Girls in Vashi with Real Photo 100% SecureCall me @ 9892124323  Cheap Rate Call Girls in Vashi with Real Photo 100% Secure
Call me @ 9892124323 Cheap Rate Call Girls in Vashi with Real Photo 100% SecurePooja Nehwal
 
CebaBaby dropshipping via API with DroFX.pptx
CebaBaby dropshipping via API with DroFX.pptxCebaBaby dropshipping via API with DroFX.pptx
CebaBaby dropshipping via API with DroFX.pptxolyaivanovalion
 
Ravak dropshipping via API with DroFx.pptx
Ravak dropshipping via API with DroFx.pptxRavak dropshipping via API with DroFx.pptx
Ravak dropshipping via API with DroFx.pptxolyaivanovalion
 
ALSO dropshipping via API with DroFx.pptx
ALSO dropshipping via API with DroFx.pptxALSO dropshipping via API with DroFx.pptx
ALSO dropshipping via API with DroFx.pptxolyaivanovalion
 
Edukaciniai dropshipping via API with DroFx
Edukaciniai dropshipping via API with DroFxEdukaciniai dropshipping via API with DroFx
Edukaciniai dropshipping via API with DroFxolyaivanovalion
 
Vip Model Call Girls (Delhi) Karol Bagh 9711199171✔️Body to body massage wit...
Vip Model  Call Girls (Delhi) Karol Bagh 9711199171✔️Body to body massage wit...Vip Model  Call Girls (Delhi) Karol Bagh 9711199171✔️Body to body massage wit...
Vip Model Call Girls (Delhi) Karol Bagh 9711199171✔️Body to body massage wit...shivangimorya083
 
FESE Capital Markets Fact Sheet 2024 Q1.pdf
FESE Capital Markets Fact Sheet 2024 Q1.pdfFESE Capital Markets Fact Sheet 2024 Q1.pdf
FESE Capital Markets Fact Sheet 2024 Q1.pdfMarinCaroMartnezBerg
 
Data-Analysis for Chicago Crime Data 2023
Data-Analysis for Chicago Crime Data  2023Data-Analysis for Chicago Crime Data  2023
Data-Analysis for Chicago Crime Data 2023ymrp368
 
VIP Call Girls Service Miyapur Hyderabad Call +91-8250192130
VIP Call Girls Service Miyapur Hyderabad Call +91-8250192130VIP Call Girls Service Miyapur Hyderabad Call +91-8250192130
VIP Call Girls Service Miyapur Hyderabad Call +91-8250192130Suhani Kapoor
 
VidaXL dropshipping via API with DroFx.pptx
VidaXL dropshipping via API with DroFx.pptxVidaXL dropshipping via API with DroFx.pptx
VidaXL dropshipping via API with DroFx.pptxolyaivanovalion
 

Kürzlich hochgeladen (20)

Best VIP Call Girls Noida Sector 39 Call Me: 8448380779
Best VIP Call Girls Noida Sector 39 Call Me: 8448380779Best VIP Call Girls Noida Sector 39 Call Me: 8448380779
Best VIP Call Girls Noida Sector 39 Call Me: 8448380779
 
Cheap Rate Call girls Sarita Vihar Delhi 9205541914 shot 1500 night
Cheap Rate Call girls Sarita Vihar Delhi 9205541914 shot 1500 nightCheap Rate Call girls Sarita Vihar Delhi 9205541914 shot 1500 night
Cheap Rate Call girls Sarita Vihar Delhi 9205541914 shot 1500 night
 
Abortion pills in Doha Qatar (+966572737505 ! Get Cytotec
Abortion pills in Doha Qatar (+966572737505 ! Get CytotecAbortion pills in Doha Qatar (+966572737505 ! Get Cytotec
Abortion pills in Doha Qatar (+966572737505 ! Get Cytotec
 
Delhi 99530 vip 56974 Genuine Escort Service Call Girls in Kishangarh
Delhi 99530 vip 56974 Genuine Escort Service Call Girls in  KishangarhDelhi 99530 vip 56974 Genuine Escort Service Call Girls in  Kishangarh
Delhi 99530 vip 56974 Genuine Escort Service Call Girls in Kishangarh
 
Generative AI on Enterprise Cloud with NiFi and Milvus
Generative AI on Enterprise Cloud with NiFi and MilvusGenerative AI on Enterprise Cloud with NiFi and Milvus
Generative AI on Enterprise Cloud with NiFi and Milvus
 
Determinants of health, dimensions of health, positive health and spectrum of...
Determinants of health, dimensions of health, positive health and spectrum of...Determinants of health, dimensions of health, positive health and spectrum of...
Determinants of health, dimensions of health, positive health and spectrum of...
 
100-Concepts-of-AI by Anupama Kate .pptx
100-Concepts-of-AI by Anupama Kate .pptx100-Concepts-of-AI by Anupama Kate .pptx
100-Concepts-of-AI by Anupama Kate .pptx
 
Midocean dropshipping via API with DroFx
Midocean dropshipping via API with DroFxMidocean dropshipping via API with DroFx
Midocean dropshipping via API with DroFx
 
Call me @ 9892124323 Cheap Rate Call Girls in Vashi with Real Photo 100% Secure
Call me @ 9892124323  Cheap Rate Call Girls in Vashi with Real Photo 100% SecureCall me @ 9892124323  Cheap Rate Call Girls in Vashi with Real Photo 100% Secure
Call me @ 9892124323 Cheap Rate Call Girls in Vashi with Real Photo 100% Secure
 
CebaBaby dropshipping via API with DroFX.pptx
CebaBaby dropshipping via API with DroFX.pptxCebaBaby dropshipping via API with DroFX.pptx
CebaBaby dropshipping via API with DroFX.pptx
 
Ravak dropshipping via API with DroFx.pptx
Ravak dropshipping via API with DroFx.pptxRavak dropshipping via API with DroFx.pptx
Ravak dropshipping via API with DroFx.pptx
 
ALSO dropshipping via API with DroFx.pptx
ALSO dropshipping via API with DroFx.pptxALSO dropshipping via API with DroFx.pptx
ALSO dropshipping via API with DroFx.pptx
 
꧁❤ Aerocity Call Girls Service Aerocity Delhi ❤꧂ 9999965857 ☎️ Hard And Sexy ...
꧁❤ Aerocity Call Girls Service Aerocity Delhi ❤꧂ 9999965857 ☎️ Hard And Sexy ...꧁❤ Aerocity Call Girls Service Aerocity Delhi ❤꧂ 9999965857 ☎️ Hard And Sexy ...
꧁❤ Aerocity Call Girls Service Aerocity Delhi ❤꧂ 9999965857 ☎️ Hard And Sexy ...
 
Edukaciniai dropshipping via API with DroFx
Edukaciniai dropshipping via API with DroFxEdukaciniai dropshipping via API with DroFx
Edukaciniai dropshipping via API with DroFx
 
Vip Model Call Girls (Delhi) Karol Bagh 9711199171✔️Body to body massage wit...
Vip Model  Call Girls (Delhi) Karol Bagh 9711199171✔️Body to body massage wit...Vip Model  Call Girls (Delhi) Karol Bagh 9711199171✔️Body to body massage wit...
Vip Model Call Girls (Delhi) Karol Bagh 9711199171✔️Body to body massage wit...
 
FESE Capital Markets Fact Sheet 2024 Q1.pdf
FESE Capital Markets Fact Sheet 2024 Q1.pdfFESE Capital Markets Fact Sheet 2024 Q1.pdf
FESE Capital Markets Fact Sheet 2024 Q1.pdf
 
Data-Analysis for Chicago Crime Data 2023
Data-Analysis for Chicago Crime Data  2023Data-Analysis for Chicago Crime Data  2023
Data-Analysis for Chicago Crime Data 2023
 
VIP Call Girls Service Miyapur Hyderabad Call +91-8250192130
VIP Call Girls Service Miyapur Hyderabad Call +91-8250192130VIP Call Girls Service Miyapur Hyderabad Call +91-8250192130
VIP Call Girls Service Miyapur Hyderabad Call +91-8250192130
 
VidaXL dropshipping via API with DroFx.pptx
VidaXL dropshipping via API with DroFx.pptxVidaXL dropshipping via API with DroFx.pptx
VidaXL dropshipping via API with DroFx.pptx
 
Sampling (random) method and Non random.ppt
Sampling (random) method and Non random.pptSampling (random) method and Non random.ppt
Sampling (random) method and Non random.ppt
 

Choctaw Nation - Power bi dashboard, report server report in Day

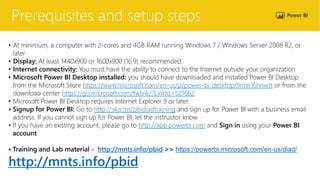
  • 1. Prerequisites and setup steps • At minimum, a computer with 2-cores and 4GB RAM running Windows 7 / Windows Server 2008 R2, or later • Display: At least 1440x900 or 1600x900 (16:9) recommended. • Internet connectivity: You must have the ability to connect to the Internet outside your organization • Microsoft Power BI Desktop installed: you should have downloaded and installed Power BI Desktop from the Microsoft Store https://www.microsoft.com/en-us/p/power-bi-desktop/9ntxr16hnw1t or from the download center https://go.microsoft.com/fwlink/?LinkId=521662. • Microsoft Power BI Desktop requires Internet Explorer 9 or later. • Signup for Power BI: Go to http://aka.ms/pbidiadtraining and sign up for Power BI with a business email address. If you cannot sign up for Power BI, let the instructor know. • If you have an existing account, please go to http://app.powerbi.com and Sign in using your Power BI account • Training and Lab material - http://mnts.info/pbid >> https://powerbi.microsoft.com/en-us/diad/ http://mnts.info/pbid
  • 2. Vishal Pawar Principal BI Architect, Green House Data Microsoft rMVP, MCT Dashboard in a Day
  • 3. Vishal Pawar • Principal BI Architect • Microsoft rMVP, Microsoft Certified Trainer • Founder of Global Power BI User Group • Blogger, Speaker and #PowerAddict
  • 4. Join a Global Power BI User Group ! • Udemy Free Course (53K+ Student) – http://bit.do/pbiu • Facebook Group (15K+ member)- http://bit.do/pbifb • LinkedIn (2K+ member) – http://bit.do/pbiln • Twitter (@GlobePUG) – http://bit.do/pbitw • YouTube (2K+ Subscriber)- http://bit.do/ytgpbi • Official Microsoft Community – http://bit.do/pbiug • Official website (2K+ Member) – http://bit.do/gpbiweb • Power BI news (2K+ Readers) – http://bit.do/pbinews • Session pins on Pinterest- http://bit.do/gpbisession • Google Plus – http://bit.do/pbigp • About user group – http://bit.do/aboutgpbi
  • 5. Free Power BI Template- Download & Use now !! http://bit.do/sqldash SQL Server Dashboard LinkedIn Dashboard https://gallery.technet.microsoft.com/LinkedIn-Connection-107605c5 NetFlix Dashboard http://bit.do/pbinetflix
  • 6. Agenda (times are approximate and will be fluid with the class) Morning • 9:00 AM – 10:00 AM – Introduction to Power BI and Power BI Desktop overview • 10:15 AM – 11:00 PM – Power BI Desktop – Lab • 11:15 PM – 12:15 PM – Power BI Desktop – Demos • 12:15 PM – 1:00 PM – Break and Q&A with speaker Afternoon • 01:00 PM – 02:00 PM – Power BI Desktop, Services – Lab (Continued) • 02:15 PM – 03:15 PM – Power BI Report Server Overview & Best Practice • 03:30 PM – 04:30 PM – Power Platform end to end Demo
  • 7. Agenda (times are approximate and will be fluid with the class) Morning • 9:00 AM – 10:00 AM – Introduction to Power BI and Power BI Desktop overview • 10:15 AM – 11:00 PM – Power BI Desktop – Lab • 11:15 PM – 12:15 PM – Power BI Desktop – Demos • 12:15 PM – 1:00 PM – Break and Q&A with speaker Afternoon • 01:00 PM – 02:00 PM – Power BI Desktop, Services – Lab (Continued) • 02:15 PM – 03:15 PM – Power BI Report Server Overview & Best Practice • 03:30 PM – 04:30 PM – Power Platform end to end Demo
  • 9. Data Capture digital signal across business 2 Intelligence Connect and synthesize data Action Improve business outcomes Data + intelligence Digital Feedback Loop Optimize operations Transform products Engage customers Empower employees
  • 10. Data + intelligence Data Capture digital signal across business 2 Intelligence Connect and synthesize data Action Improve business outcomes Digital Feedback Loop Optimize operations Transform products Engage customers Empower employees
  • 11. Microsoft Power Platform Microsoft FlowPowerAppsPower BI Analyze Make sense of your data through interactive, real-time dashboards and unlock the insights needed to drive your business forward Act Build apps in hours—not months—that easily connect to data, use Excel-like expressions to add logic, and run on the web, iOS, and Android devices Automate Include powerful workflow automation directly in your apps with a no-code approach that connects to hundreds of popular apps and services One connected platform that empowers everyone to innovate Power Platform
  • 12. Everyone Analysttoenduser ITtoenduser 2nd wave Self-service BI 1st wave Corporate BI 3rd wave End user BI The Evolution of BI
  • 14. Power BI Power BI: experience your data Any data, any way, anywhere
  • 15. • Data from Applications o SaaS services that you already use • Data from your organization o Content published by others in your org (Datasets and Dataflows) • Big data and more o Azure data services, e.g. SQL DW, ADLS. o On-premises data sources, e.g. Oracle & SSAS • Data from files o Import data from Text, CSV, Excel and Power BI Desktop files Access all your DATA SaaS solutions e.g. Marketo, Salesforce, GitHub, Google Analytics On-premises Data Data sources Organizational Corporate data sources or external data services Azure services Azure SQL, Stream Analytics… Power BI Desktop files Data from files, databases, Azure, and other sources Excel files
  • 16. Share & collaborate Visualize Explore Prepare • Consolidate data from a broad range of sources o Merge or append queries to combine data from multiple queries into a single query • Transform data to fit your needs using intuitive UI o Select data for inclusion o Cleanse data and remove errors • Define calculations to generate new fields for use in reports • Develop advanced analytics using a combination of measures and relationships o Uncover correlations, highlight exceptions and understand business outcomes Clean and mash-up your DATA
  • 17. Share & collaborate Visualize Explore Prepare • Explore data in a variety of ways and across multiple visualizations using drag and drop canvas • Dig deeper into your reports o Drill-down in your hierarchical data o Filter, sort, hover over and highlight data • Leverage Quick Insights to find insights in your data • Ask questions of your data in natural language with Q&A o Type questions in plain language o Q&A intelligently filters, sorts, aggregates, groups and displays data based on the question Explore your DATA
  • 18. • Visualize data in a variety of ways • Growing number of visualization types o Donuts, basic area, waterfall, filled maps, tree maps, funnel, gauges combo charts and more o Custom visuals available from Power BI Visuals Marketplace o Tools to develop, test, package new custom visuals • Visualizations on report page are connected – select value in one visualization to change other visualizations • Full screen pop out mode for report visuals to show additional details Share & collaborate Visualize Explore Prepare Visualize your DATA
  • 19. Share & collaborate Visualize Explore Prepare • Save Power BI Desktop report files and easily publish them to powerbi.com • Access dashboards using native mobile apps for Windows, iOS and Android • Share as appropriate with other Power BI users in your organization • Package your reports in apps for easy consumption and control • Easily embed interactive Power BI visualizations in blog posts, websites, through emails or social media With Power BI Publish to web Bring your story to life with DATA
  • 20. Power BI: experience your data Any data, any way, anywhere Power BI
  • 21.
  • 22.
  • 23.
  • 24.
  • 25.
  • 27. February 2019 *Gartner “Magic Quadrant for Analytics and Business Intelligence Platforms,” by Cindi Howson, James Richardson, Rita Sallam, Austin Kronz, 11 February 2019 The above graphics were published by Gartner, Inc. as part of a larger research document and should be evaluated in the context of the entire document. The Gartner document is available upon request from Microsoft. Gartner does not endorse any vendor, product or service depicted in its research publications, and does not advise technology users to select only those vendors with the highest ratings or other designation. Gartner research publications consist of the opinions of Gartner's research organization and should not be construed as statements of fact. Gartner disclaims all warranties, expressed or implied, with respect to this research, including any warranties of merchantability or fitness for a particular purpose. GARTNER is a registered trademark and service mark of Gartner, Inc. and/or its affiliates in the U.S. and internationally and is used herein with permission. All rights reserved.
  • 28. January 2019 *Gartner Magic Quadrant for Data Management Solutions for Analytics, Adam Ronthal, Roxane Edjlali, Rick Greenwald, 21 January 2019. The above graphics were published by Gartner, Inc. as part of a larger research document and should be evaluated in the context of the entire document. The Gartner document is available upon request from Microsoft. Gartner does not endorse any vendor, product or service depicted in its research publications, and does not advise technology users to select only those vendors with the highest ratings or other designation. Gartner research publications consist of the opinions of Gartner's research organization and should not be construed as statements of fact. Gartner disclaims all warranties, expressed or implied, with respect to this research, including any warranties of merchantability or fitness for a particular purpose. GARTNER is a registered trademark and service mark of Gartner, Inc. and/or its affiliates in the U.S. and internationally and is used herein with permission. All rights reserved.
  • 29. Agenda (times are approximate and will be fluid with the class) Morning • 9:00 AM – 10:00 AM – Introduction to Power BI and Power BI Desktop overview • 10:15 AM – 11:00 PM – Power BI Desktop – Lab • 11:15 PM – 12:15 PM – Power BI Desktop – Demos • 12:15 PM – 1:00 PM – Break and Q&A with speaker Afternoon • 01:00 PM – 02:00 PM – Power BI Desktop, Services – Lab (Continued) • 02:15 PM – 03:15 PM – Power BI Report Server Overview & Best Practice • 03:30 PM – 04:30 PM – Power Platform end to end Demo
  • 30. Agenda (times are approximate and will be fluid with the class) Morning • 9:00 AM – 10:00 AM – Introduction to Power BI and Power BI Desktop overview • 10:15 AM – 11:00 PM – Power BI Desktop – Lab • 11:15 PM – 12:15 PM – Power BI Desktop – Demos • 12:15 PM – 1:00 PM – Break and Q&A with speaker Afternoon • 01:00 PM – 02:00 PM – Power BI Desktop, Services – Lab (Continued) • 02:15 PM – 03:15 PM – Power BI Report Server Overview & Best Practice • 03:30 PM – 04:30 PM – Power Platform end to end Demo
  • 31. Power BI Desktop Labs - Hands-on learning
  • 32. Agenda (times are approximate and will be fluid with the class) Morning • 9:00 AM – 10:00 AM – Introduction to Power BI and Power BI Desktop overview • 10:15 AM – 11:00 PM – Power BI Desktop – Lab • 11:15 PM – 12:15 PM – Power BI Desktop – Demos • 12:15 PM – 1:00 PM – Break and Q&A with speaker Afternoon • 01:00 PM – 02:00 PM – Power BI Desktop, Services – Lab (Continued) • 02:15 PM – 03:15 PM – Power BI Report Server Overview & Best Practice • 03:30 PM – 04:30 PM – Power Platform end to end Demo
  • 33. Agenda (times are approximate and will be fluid with the class) Morning • 9:00 AM – 10:00 AM – Introduction to Power BI and Power BI Desktop overview • 10:15 AM – 11:00 PM – Power BI Desktop – Lab • 11:15 PM – 12:15 PM – Power BI Desktop – Demos • 12:15 PM – 1:00 PM – Break and Q&A with speaker Afternoon • 01:00 PM – 02:00 PM – Power BI Desktop, Services – Lab (Continued) • 02:15 PM – 03:15 PM – Power BI Report Server Overview & Best Practice • 03:30 PM – 04:30 PM – Power Platform end to end Demo
  • 34. Explore and share your data stories In the Data Stories Gallery
  • 36. Agenda (times are approximate and will be fluid with the class) Morning • 9:00 AM – 10:00 AM – Introduction to Power BI and Power BI Desktop overview • 10:15 AM – 11:00 PM – Power BI Desktop – Lab • 11:15 PM – 12:15 PM – Power BI Desktop – Demos • 12:15 PM – 1:00 PM – Break and Q&A with speaker Afternoon • 01:00 PM – 02:00 PM – Power BI Desktop, Services – Lab (Continued) • 02:15 PM – 03:15 PM – Power BI Report Server Overview & Best Practice • 03:30 PM – 04:30 PM – Power Platform end to end Demo
  • 37. Agenda (times are approximate and will be fluid with the class) Morning • 9:00 AM – 10:00 AM – Introduction to Power BI and Power BI Desktop overview • 10:15 AM – 11:00 PM – Power BI Desktop – Lab • 11:15 PM – 12:15 PM – Power BI Desktop – Demos • 12:15 PM – 1:00 PM – Break and Q&A with speaker Afternoon • 01:00 PM – 02:00 PM – Power BI Desktop, Services – Lab (Continued) • 02:15 PM – 03:15 PM – Power BI Report Server Overview & Best Practice • 03:30 PM – 04:30 PM – Power Platform end to end Demo
  • 38. Q & A..(AMA)Ask Me Anything ? ✓ Power BI ✓ Power Apps ✓ Power Automate ✓ Azure
  • 39. Agenda (times are approximate and will be fluid with the class) Morning • 9:00 AM – 10:00 AM – Introduction to Power BI and Power BI Desktop overview • 10:15 AM – 11:00 PM – Power BI Desktop – Lab • 11:15 PM – 12:15 PM – Power BI Desktop – Demos • 12:15 PM – 1:00 PM – Break and Q&A with speaker Afternoon • 01:00 PM – 02:00 PM – Power BI Desktop, Services – Lab (Continued) • 02:15 PM – 03:15 PM – Power BI Report Server Overview & Best Practice • 03:30 PM – 04:30 PM – Power Platform end to end Demo
  • 40. Agenda (times are approximate and will be fluid with the class) Morning • 9:00 AM – 10:00 AM – Introduction to Power BI and Power BI Desktop overview • 10:15 AM – 11:00 PM – Power BI Desktop – Lab • 11:15 PM – 12:15 PM – Power BI Desktop – Demos • 12:15 PM – 1:00 PM – Break and Q&A with speaker Afternoon • 01:00 PM – 02:00 PM – Power BI Desktop, Services – Lab (Continued) • 02:15 PM – 03:15 PM – Power BI Report Server Overview & Best Practice • 03:30 PM – 04:30 PM – Power Platform end to end Demo
  • 42. Agenda (times are approximate and will be fluid with the class) Morning • 9:00 AM – 10:00 AM – Introduction to Power BI and Power BI Desktop overview • 10:15 AM – 11:00 PM – Power BI Desktop – Lab • 11:15 PM – 12:15 PM – Power BI Desktop – Demos • 12:15 PM – 1:00 PM – Break and Q&A with speaker Afternoon • 01:00 PM – 02:00 PM – Power BI Desktop, Services – Lab (Continued) • 02:15 PM – 03:15 PM – Power BI Report Server Overview & Best Practice • 03:30 PM – 04:30 PM – Power Platform end to end Demo
  • 43. Agenda (times are approximate and will be fluid with the class) Morning • 9:00 AM – 10:00 AM – Introduction to Power BI and Power BI Desktop overview • 10:15 AM – 11:00 PM – Power BI Desktop – Lab • 11:15 PM – 12:15 PM – Power BI Desktop – Demos • 12:15 PM – 1:00 PM – Break and Q&A with speaker Afternoon • 01:00 PM – 02:00 PM – Power BI Desktop, Services – Lab (Continued) • 02:15 PM – 03:15 PM – Power BI Report Server Overview & Best Practice • 03:30 PM – 04:30 PM – Power Platform end to end Demo
  • 44.
  • 45. Power BI Report Server History SSRS
  • 46. Modern Lifecycle Policy – Future Release Year 1 Year 2 Security & Critical Updates Security Updates (Only) Security & Critical Updates Security Updates (Only) Security & Critical Updates Security Updates (Only) Release 1 Release 2 Release 3 Support EndsNew Release Frequent releases (planning ~3 per year) Security & critical updates until next release Security updates continue for remainder of 12 months
  • 47. Power BI Report Server Release
  • 49. How Organizations Use Power BI Report Server Create interactive reports in Power BI Desktop Create Publish Publish to Power BI Report Server Consume View and interact in Power BI Mobile or web browser
  • 50. How Organizations Consume PBRS HTML5 rs:Embed=true Mobile apps </> Windows Android iOS Web portal Embedded In your apps
  • 51. Power BI Report Server for Enterprise Lifecycle Frequent releases Security Integrate with ADFSScale up and out Scalability Migrate from SQL Server Reporting Services MigrationInstallation Lightweight download and installation
  • 52. Power BI Report Server topology
  • 53. Migrate from SSRS (Native mode) SSRS Power BI Report Server 1. Back up report server database 2. Install Power BI Report Server 3. Connect report server to database using Report Server Configuration Manager Copy/Move Report Server Database Report Server Database
  • 54. How to acquire Power BI Report Server
  • 55. PBI RS Installation Lightweight download and installation Requirements • Windows Server 2012+ • SQL Server Database Engine (2008+) • SQL Server Analysis Services (2012+) Zero impact on SQL Server
  • 57. Power BI Report Server - Demo • PBI RS – Site Setting ,Help overview • PBI Desktop OPTIMIZED to PBI RS ( Where to find?) • Tools to Publish Report to PBI RS • Power BI Optimized Desktop to PBI RS • Visual Studio SSDT SSRS publishing to PBI RS • Mobile Report publishing to PBI RS • Power BI Report Builder to PBI RS • Report Server DB – Metadata, Special Query • Branding - PBI Report Server • Report Server execution log – Publish • Full Screen ?rs:embed=true • Comment, Refresh Data and Scheduling • Open and Edit directly from tool and Publish • Access, Folder, and Many more things to do
  • 58. Best Practices for Power BI Report Server • Development – Version, Upgrade & Migration • Security - AD, SQL read account • Administration – Report for Report ☺ ! • Upgradation – Decide your strategy, 6 Month Good** • Scheduling - Shared Data Scheduling • Usage – Import VS Direct query • Metadata - Report Server DB
  • 59. This ugly report page needs a lot of work
  • 60. Agenda (times are approximate and will be fluid with the class) Morning • 9:00 AM – 10:00 AM – Introduction to Power BI and Power BI Desktop overview • 10:15 AM – 11:00 PM – Power BI Desktop – Lab • 11:15 PM – 12:15 PM – Power BI Desktop – Demos • 12:15 PM – 1:00 PM – Break and Q&A with speaker Afternoon • 01:00 PM – 02:00 PM – Power BI Desktop, Services – Lab (Continued) • 02:15 PM – 03:15 PM – Power BI Report Server Overview & Best Practice • 03:30 PM – 04:30 PM – Power Platform end to end Demo
  • 61. Agenda (times are approximate and will be fluid with the class) Morning • 9:00 AM – 10:00 AM – Introduction to Power BI and Power BI Desktop overview • 10:15 AM – 11:00 PM – Power BI Desktop – Lab • 11:15 PM – 12:15 PM – Power BI Desktop – Demos • 12:15 PM – 1:00 PM – Break and Q&A with speaker Afternoon • 01:00 PM – 02:00 PM – Power BI Desktop, Services – Lab (Continued) • 02:15 PM – 03:15 PM – Power BI Report Server Overview & Best Practice • 03:30 PM – 04:30 PM – Power Platform end to end Demo
  • 62. Dynamics 365 Office 365 Standalone Apps Microsoft Power platform Azure Common Data Service for Apps and Data Connectors
  • 64. What
  • 65. PowerApps An application Platform as a Service (aPaaS) for citizen- developers to build high-productivity business apps
  • 66. Model-driven apps leverage your data model, relationships, and business processes to automatically generate immersive, responsive applications Canvas apps start with user experience, with pixel-perfect control to build highly customized task- and role-based apps that mash up data from 230+ sources Types of PowerApps apps
  • 67. Connect to data & systems you’re already using easily Create apps, forms, and workflows without writing code Use apps on any device – both web and mobile Canvas Apps help business-power-users to create and use custom business apps across platforms using Excel and PowerPoint skills
  • 68. Craft forms and screens in a visual designer that helps you see exactly what you’ll get Take advantage of device capabilities like cameras, GPS, and digital ink Extend the capabilities of connected data sources, or focus just on the bits you need Build business logic into your apps with an Excel-inspired expression language PowerApps Studio for canvas apps
  • 69. Built-in connectivity to 230+ cloud services, content services, databases, APIs, etc. Seamless hybrid connectivity to on-premises systems via the On-Premises Data Gateway Custom Connector support allows the registration of developer / IT systems as a building block for citizen developers Use multiple data sources in a single application for processes that span systems 230+ Built-in Connectors + Custom Connectors
  • 70. Get apps to your team when and where they’re needed, whether that’s on the web, iOS or Android—no app store required.
  • 71. Embed apps into the tools you’re already using Customize SharePoint forms Customers can quickly customize standard forms on any SharePoint list, auto-generate rich mobile apps, and automate workflow and approval processes – all directly from within SharePoint. Embed apps in Power BI, Teams Build PowerApps to extend Power BI, Teams, and more. We’ve also recently announced that 3rd party ISVs will be able to take advantage of the same capabilities to extend their software.
  • 72. Complex responsive apps on web and mobile PowerApps Model-driven apps provides a metadata- driven architecture for creating and customizing apps without writing code Easily add Business rules and Business process flows to model your business processes Rich component- focused no-code design environments
  • 73. High-level architecture SaaS apps enterprise services business systems mobile tablet browser
  • 74.
  • 75.
  • 76. Entities, fields & relationships Entity: “An item with properties that you track, like contact or account.” like a database table Field: “A property that is associated with the entity.” like a database column in a table Relationships: “Defines how entities can be related to each other.” like relationships in database – 1:1, 1:N & N:N
  • 77. Forms • Definition: “a page that displays fields of a single record for a single entity”
  • 78. Views • Definition: “a page that displays fields from multiple records for a single entity”
  • 79. Interactive Dashboards • Definition: “a page that allows interactive filtering of data from one or more entities”
  • 80. Microsoft Flow >> Power Automate Microsoft Flow is a service for business users to automate workflows across apps and services
  • 81. What makes up a flow?
  • 82. Four types of flows Scheduled flows Automated flows Business process flows Instant flows
  • 83. Scheduled flows • Run regular reports—send out your team a summary everything that’s happened in the past week • Data backups—copy data from one system to another on a fixed interval • Everything from simple schedules like every day, to advanced schedules like every 3rd Monday • Scheduled flows can also be run on-demand by any Owners of the flow—including from the Teams Flow bot
  • 84. Instant flows • Click a button inside of Flow mobile, SharePoint, Dynamics, PowerApps or Excel that passes context directly in to your flow • These can be shared with Run only users so that other people can Run them without seeing the details or editing them
  • 85. Automated flows • Starts with an event or trigger • For example, Emails being received, RSS feeds, new items being added to a database • Over 170 different triggers available • Like the previous 2 types of flows—support any number of actions in 200+ connectors
  • 86. Business process flows • Create stages or screens that enforce a certain sequence of steps • For each stage, collect data from the user and/or and kick off automated workflows • Create branching logic based on the data
  • 87. Data sources? • Excel on OneDrive • Excel on Dropbox • Excel on Google Drive • Office 365 • SharePoint Online lists • Google Sheets • Salesforce • Dynamics CRM SaaS data sources
  • 88. Expressions Actions and Conditions Azure API App, Azure Function Azure Service Bus
  • 89. ▪ Step 1 ▪ Create a MS Form Demo – Together
  • 90. ▪ Step 2 ▪ Create Streaming Data Set in Power BI Demo – Together
  • 91. ▪ Step 3 ▪ Create Flow to add Row in Power BI Demo – Together
  • 92. ▪ Step 4 ▪ Power BI Desktop ▪ Publish data Demo – Together
  • 93. Power BI Best Practices – General • Limit the number of visuals in dashboards and reports • To improve Power BI report performance, remove unnecessary interactions between visuals • Enable Row-Level Security (RLS) where applicable • Use Microsoft AppSource certified custom visuals where applicable • If you observe poor performance in Power BI, do not use hierarchical filters • Provide data categorization for Power BI reports (HBI, MBI, LBI) • Use the On-premises data gateway instead of Personal Gateway • Use different Power BI gateways for “Direct Query” and “Scheduled Refresh” • Test each custom visual on a report for performance to ensure fast report load time • Limit complicated measures and aggregations in data models • Use slicers sparingly • Ensure that the Power BI report and the data source are in the same region • Import only necessary fields and tables instead of entire datasets • Ensure the cache update frequency aligns with the data source refresh frequency
  • 94. Reference & Call to action • Download Power BI Report Server • Read the documentation • Subscribe to the Power BI Blog • Follow @MSPowerBI on Twitter • Join the Power BI Community • https://docs.microsoft.com • https://www.blue-granite.com/blog/ • https://maqsoftware.com/expertise/powerbi/power-bi-best-practices • Best design practices for reports and visuals – Microsoft Corporation, published June 22, 2018 • Tips for designing a great Power BI dashboard – Microsoft Corporation, published June 22, 2018 • Power BI Performance Best Practices – Microsoft Corporation, published May 18, 2018
  • 95. 850K Active Community Members JOIN OUR THRIVING COMMUNITY 103,431 Users 16,432 Ideas Submitted 3,162 Active IdeasUSER VOICE: Join our Global Community today! community.powerbi.com
  • 96. Independent Power BI User Groups World Wide222 ENGAGE WITH A USER GROUP User Groups Members in over 60 countries49,685 Join your local PUG today! pbiusergroup.com
  • 97. Find industry solutions in the Partner Showcase
  • 98. Maximize your BI investments with analytics Free Gartner Report Free eBook Free eBook Get Started Today with Free Azure SQL Data Warehouse Trial Free Infographic
  • 99. Q&A