
Empfohlen
Weitere ähnliche Inhalte
Ähnlich wie ELECTROCARDIOGRAM.pptx
Ähnlich wie ELECTROCARDIOGRAM.pptx (20)
Mehr von VinodkumarMugada1
Kürzlich hochgeladen
Kürzlich hochgeladen (20)
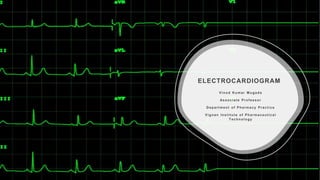
ELECTROCARDIOGRAM.pptx
- 1. ELECTROCARDIOGRAM Vinod Kumar M ugada Assoc ia te Professor Department of Pharmacy Practice Vignan Institute of Pharmaceuti cal T echnology
- 2. Autorhythmic fibers • An inherent and rhythmical electrical activity is the reason for the heart’s lifelong beat. • Autorhythmic fibers repeatedly generate action potentials that trigger heart contractions. • SA node cells do not have a stable resting potential. Rather, they repeatedly depolarize to threshold spontaneously. • The spontaneous depolarization is a pacemaker potential. • Spontaneous depolarization in SA node cells is the self-generated, gradual increase in the electrical potential across the cell membrane without any external stimulus.
- 3. Why the SA node do not have stable resting potential • This unique characteristic is due to the presence of specific ion channels and the spontaneous depolarization property of the SA node cells. • SA node cells exhibit a gradual depolarization phase known as the pacemaker potential (also called the diastolic depolarization). • This phase is characterized by a slow, steady increase in membrane potential toward the threshold potential, at which point an action potential is triggered. • When the threshold potential is reached, L-type calcium channels open, triggering an action potential. After the action potential, the membrane potential returns to its initial level, and the pacemaker potential phase begins again. • The lack of a stable resting potential in SA node cells enables them to generate rhythmic, spontaneous electrical activity, which is essential for initiating and regulating the heartbeat.
- 4. Autorhythmic fibers • There is a delay of action potential reaching from AV node to Bundle of His due to differences in the cell structure • This delay provides time for the atria to empty their blood into the ventricles. • This bundle is the only site where action potentials can conduct from the atria to the ventricles. • If the action potential is conducted between the atria and ventricles at other sites, it can lead to a range of potential issues and abnormal heart rhythms, known as arrhythmias.
- 5. What is ECG? • The electrical impulses from the SA node can be detected through electrodes placed on the skin, usually on the chest, arms, and legs • The ECG provides a graphical representation of the electrical impulses generated by the heart's muscle cells
- 7. What is ECG? • The 12-lead ECG comprises three standard limb leads (I, II, and III), three augmented limb leads (aVR, aVL, and aVF), and six precordial leads (V1, V2, V3, V4, V5, and V6). • By comparing these records with one another and with normal records, it is possible to determine • if the conducting pathway is abnormal, • if the heart is enlarged, • if certain regions of the heart are damaged, and • the cause of chest pain.
- 8. Limb Leads- I, II, and III Lead I: Primarily provides information about the heart's electrical activity in the left-to-right direction. Lead II: Particularly useful for assessing the heart's electrical activity in the superior-to-inferior direction. Lead-III: Helps evaluate the heart's electrical activity in the inferior and left direction.
- 9. Limb Leads- Significance Detection of myocardial infarction: leads II, III, and aVF provide crucial information about the inferior wall, while leads I and aVL focus on the lateral wall. Identification of arrhythmias: lead II, are commonly used for rhythm analysis and detecting arrhythmias such as atrial fibrillation, atrial flutter, and various forms of heart block.
- 10. Augmented Limb Leads- aVR, aVL, aVF aVR: Augmented vector right provides an "augmented" view of the heart's electrical activity from the right side. aVL: Augmented vector left provides an "augmented" view of the heart's electrical activity from the left side. aVF: Augmented vector foot provides an "augmented" view of the heart's electrical activity from the inferior aspect (foot).
- 11. Precordial leads- V1, V2, V3, V4, V5, and V6- significance Detection of myocardial infarction: help identify the presence and location of myocardial infarction (heart attack) in the anterior and lateral walls of the heart. Identification of arrhythmias: Precordial leads provide additional information about the origin and nature of arrhythmias.
- 12. Precordial leads- V1, V2, V3, V4, V5, and V6- significance Evaluation of ventricular hypertrophy: can help detect left or right ventricular hypertrophy, which is the enlargement and thickening of the heart's ventricular walls. Assessment of conduction abnormalities: can help identify various conduction abnormalities, such as bundle branch blocks or hemiblocks, by revealing specific patterns in the QRS complex.
- 13. P-wave, PR interval, PR segment • P-wave: Atrial depolarization • PR interval: Onset of P-wave to onset of QRS complex. Determine whether the impulse conduction from the atria to ventricles is normal. • PR segment: Line between the end of P- wave and the onset of the QRS complex. Reflects the slow impulse conduction through the AV node.
- 14. QRS Complex • Depolarization of the ventricles. • QRS duration: Time interval between onset and end of QRS complex. • Short QRS complex: Rapid depolarization of ventricles and proper conduction system. • Wide QRS complex: Slow ventricular depolarization and due to dysfunction in the conduction system.
- 15. J-point • J point in an ECG is the point where the QRS complex meets the ST segment. • Represents the beginning of repolarization • J point helps assess the presence and magnitude of ST segment deviations, which can indicate various cardiac conditions • ST segment elevation (when the J point and ST segment are above the baseline) can be indicative of an acute myocardial infarction
- 16. ST Segment • The ST segment corresponds to the plateau shape of the action potential. • The ST segment is of particular interest in the setting of acute myocardial ischemia
- 17. QT interval and QTc interval • Reflects total duration of ventricular depolarization and repolarization. • Onset of QRS complex to the end of the T-wave. • QT duration is inversely related to the heart rate • The heart-rate adjusted QT interval is QTc interval • A long QTc interval increases the risk of ventricular arrythmias
- 18. T-wave • Reflects ventricular repolarization. • The T wave is flatter than normal when the heart muscle is receiving insufficient oxygen—as, for example, in coronary artery disease. • The T wave may be elevated in hyperkalemia (high blood K+ level).