
Empfohlen
Empfohlen
Weitere ähnliche Inhalte
Ähnlich wie Phillip Curve(1).pptx
Ähnlich wie Phillip Curve(1).pptx (20)
Mehr von Vinodha Devi
Mehr von Vinodha Devi (8)
Kürzlich hochgeladen
Kürzlich hochgeladen (20)
Phillip Curve(1).pptx
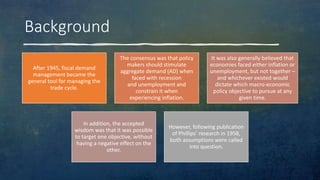
- 1. Background After 1945, fiscal demand management became the general tool for managing the trade cycle. The consensus was that policy makers should stimulate aggregate demand (AD) when faced with recession and unemployment and constrain it when experiencing inflation. It was also generally believed that economies faced either inflation or unemployment, but not together – and whichever existed would dictate which macro-economic policy objective to pursue at any given time. In addition, the accepted wisdom was that it was possible to target one objective, without having a negative effect on the other. However, following publication of Phillips’ research in 1958, both assumptions were called into question.
- 2. Origin Phillips analyzed annual wage inflation and unemployment rates in the UK for the period 1860 – 1957, and then plotted them on a scatter diagram. The data appeared to demonstrate an inverse and stable relationship between wage inflation and unemployment. Later economists substituted price inflation for wage inflation and the Phillips curve was born. When economists from other countries undertook similar research, they also found very similar curves for their own economies.
- 3. Phillips Curve The Phillips curve states that inflation and unemployment have an inverse relationship. Higher inflation is associated with lower unemployment and vice versa. The Phillips curve was a concept used to guide macroeconomic policy in the 20th century, but was called into question by the stagflation of the 1970’s. Understanding the Phillips curve in light of consumer and worker expectations, shows that the relationship between inflation and unemployment may not hold in the long run, or even potentially in the short run.
- 4. Diagram
- 7. Stop-go policies • Stop-go policies refer to macroeconomic policies which result in economic boom or recession. • To manage the economy, the government can change monetary and/or fiscal policy, but the danger is that they might over-react and the economy can go from very fast 'unsustainable growth' to very slow/negative growth.
- 8. Why its Stop and Go ? Stop • For example, if inflation increased the government may respond by putting up interest rates. However, the rise in interest rates will lead to an economic slowdown. This is because borrowing is more expensive and it will discourage consumer spending and investment. If interest rates increased too much it can cause an economy to go into recession. Go • On the other hand, if economic growth was below the trend rate of growth and there was unemployment, the government may respond by cutting interest rates. This provides a boost to domestic spending and could cause a rapid increase in economic growth. This will lead to an uptick in inflation and could cause an
- 9. Why fine-tuning doesn’t work and we end up with stop-go policies?
- 10. Examples of stop- go policies • In 1973, the UK experienced a ‘boom’ -known as the barber boom. In the 1972 budget, the chancellor Anthony Barber introduced an inflationary budget – designed to boost economic growth and reduce unemployment. It was successful in causing a surge in growth, but at the expense of inflation. The oil price shock of 1973, exacerbated this problem and the economy went into recession by the end of 1973.
- 11. Lawson Boom • In the late 1980s, the UK economy expanded at a rapid rate – annual growth of over 4% – this led to high inflation, and in 1990/91, the policy was reversed and interest rates increased. The economy went from boom to recession in 1990/91.
- 12. Case Study - Monetary policy 2008 • India faced a steep inflationary pressure right from the beginning of the year 2008. In May 2008, inflation touched double digit figures and continued to move in an upward direction. The inflation was feared to choke the steady growth of the Indian economy. The Indian government took several steps to combat inflation. In July, the Reserve Bank, the central bank of India, also took action to tame the inflation as soon as it reached a thirteen year high, crossing 12.5%. RBI increased the repo rate and cash reserve ratio to indicate a tight monetary policy to be implemented. The central bank was able to withdraw a substantial amount of money through the tight monetary policy. However, this raised anguish and anger among the industrialists and businessmen in India. The tight monetary policy was viewed as a double whammy in the face of rising inflation. Some feared, that the policy would hamper business environment and affect the price sensitive sectors like manufacturing, automobiles and real estate etc. On the other hand, some economists argued that RBI's step was appropriate and quite expected. Those who are in favour of the policy believed that tight monetary policy would be an obstacle to economic growth in the short run, but would improve the growth prospects of the economy in the long-run. Pedagogical Objectives: • To understand the background of implementing strict monetary policy by the Reserve Bank of India. • To analyse the sectoral impact of strict monetary policy. • To highlight the net effect of the strict monetary policy.
- 13. RBI - reaction • The policy endeavour would be to contain inflation close to 5.0 per cent in 2007-08 while conditioning expectations in the range of 4.0- 4.5 per cent. • https://www.elibrary.imf.org/view/IMF071/24708- 9781484325940/24708- 9781484325940/ch11.xml?language=en&redirect=true
- 14. Why was inflation so high in 2008? • The biggest culprit in driving up inflation was the cost of energy, which increased by 4% on a monthly basis and 29.3% annually. The big hits on energy include a 61.1% annual surge in household fuel oil and a 37.9% jump in the price of gasoline. Monthly food prices increased 0.9% and 8.4% annually. • The key factors behind this drop were improved fiscal performance, downward price pressures from increased global competition, improved monetary policy frameworks, and central bank independence in many countries.