SlideShare ist ein Scribd-Unternehmen logo
1 von 9
Downloaden Sie, um offline zu lesen
News Release
FOR IMMEDIATE RELEASE:
Home buyer activity increases in October
VANCOUVER, BC – November 4, 2019 – The Metro Vancouver* housing market is
experiencing a fall pickup in home sale activity.
The Real Estate Board of Greater Vancouver (REBGV) reports that residential home sales in the
region totalled 2,858 in October 2019, a 45.4 per cent increase from the 1,966 sales recorded in
October 2018, and a 22.5 per cent increase from the 2,333 homes sold in September 2019.
Last month’s sales were 9.8 per cent above the 10-year October sales average.
“Home buyers have more confidence today than we saw in the first half of the year,” says Ashley
Smith, REBGV president. “With prices edging down over the last year and interest rates
remaining low, hopeful home buyers are becoming more active this fall.”
There were 4,074 detached, attached and apartment homes newly listed for sale on the Multiple
Listing Service® (MLS®) in Metro Vancouver in October 2019. This represents a 16.4 per cent
decrease compared to the 4,873 homes listed in October 2018 and a 16.3 per cent decrease
compared to September 2019 when 4,866 homes were listed.
The total number of homes currently listed for sale on the MLS® system in Metro Vancouver is
12,236, a 5.8 per cent decrease compared to October 2018 (12,984) and a nine per cent decrease
compared to September 2019 (13,439).
For all property types, the sales-to-active listings ratio for October 2019 is 23.4 per cent. By
property type, the ratio is 17.3 per cent for detached homes, 26.2 per cent for townhomes, and 29
per cent for apartments.
Generally, analysts say downward pressure on home prices occurs when the ratio dips below 12
per cent for a sustained period, while home prices often experience upward pressure when it
surpasses 20 per cent over several months.
“The recent uptick in home sales is moving us into a more historically typical market,” Smith
said. “Both sale and listing activity is trending around our long-term averages in recent months.”
The MLS® Home Price Index composite benchmark price for all residential properties in Metro
Vancouver is currently $992,900. This represents a 6.4 per cent decrease from October 2018, a
1.7 per cent decrease over the past six months, and a 0.2 per cent increase compared to
September 2019.
Sales of detached homes in October 2019 reached 938, a 47.3 per cent increase from the 637
detached sales recorded in October 2018. The benchmark price for a detached home is
$1,410,500. This represents a 7.5 per cent decrease from October 2018, a 1.3 per cent decrease
over the past six months, and a 0.3 per cent increase compared to September 2019.
Sales of apartment homes reached 1,384 in October 2019, a 40.5 per cent increase compared to
the 985 sales in October 2018. The benchmark price of an apartment home is $652,500. This
represents a 5.9 per cent decrease from October 2018, a 2.2 per cent decrease over the past six
months, and a 0.2 per cent increase compared to September 2019.
Attached home sales in October 2019 totalled 536, a 55.8 per cent increase compared to the 344
sales in October 2018. The benchmark price of an attached home is $771,600. This represents a
5.8 per cent decrease from October 2018, a 0.4 per cent decrease over the past six months, and a
0.5 per cent increase compared to September 2019.
*Editor’s Note: Areas covered by the Real Estate Board of Greater Vancouver include: Burnaby, Coquitlam, Maple
Ridge, New Westminster, North Vancouver, Pitt Meadows, Port Coquitlam, Port Moody, Richmond, South Delta,
Squamish, Sunshine Coast, Vancouver, West Vancouver, and Whistler.
-30-
The real estate industry is a key economic driver in British Columbia. In 2018, 24,619 homes changed ownership in
the Board’s area, generating $1.7 billion in economic spin-off activity and an estimated 11,720 jobs. The total dollar
value of residential sales transacted through the MLS® system in Greater Vancouver totalled $26 billion in 2018.
The Real Estate Board of Greater Vancouver is an association representing more than 14,000 REALTORS® and
their companies. The Board provides a variety of member services, including the Multiple Listing Service®. For
more information on real estate, statistics, and buying or selling a home, contact a local REALTOR® or visit
www.rebgv.org.
For more information please contact:
Craig Munn
Manager, Communication
Real Estate Board of Greater Vancouver
604.730.3146
cmunn@rebgv.org
Property Type Area
Benchmark
Price
Price
Index
1 Month
Change %
3 Month
Change %
6 Month
Change %
1 Year
Change %
3 Year
Change %
5 Year
Change %
10 Year
Change %
Residential / Composite Lower Mainland $939,600 258.6 0.1% -0.4% -1.8% -5.6% 10.4% 59.5% 83.7%
Greater Vancouver $992,900 258.3 0.2% -0.2% -1.7% -6.4% 6.1% 52.8% 80.0%
Bowen Island $973,700 211.1 -0.2% 2.4% -1.8% 0.6% 22.8% 65.4% 60.4%
Burnaby East $922,300 255.8 0.2% -0.8% -3.0% -8.0% 6.4% 50.1% 78.9%
Burnaby North $850,800 256.9 0.1% -2.1% -2.4% -6.9% 9.0% 55.3% 80.2%
Burnaby South $938,200 265.0 -0.3% -0.7% -3.8% -8.0% 8.8% 54.7% 84.9%
Coquitlam $883,600 262.1 -0.4% -0.8% -1.6% -6.2% 12.8% 63.1% 92.7%
Ladner $778,300 219.1 0.3% -1.7% -3.6% -8.8% -6.0% 39.8% 59.6%
Maple Ridge $746,500 237.7 0.2% -0.8% -1.2% -4.7% 20.1% 72.9% 80.3%
New Westminster $637,600 280.5 -0.4% -1.4% -3.1% -8.9% 23.6% 68.4% 91.7%
North Vancouver $1,019,400 229.1 0.6% -0.9% -2.3% -6.0% 1.7% 46.3% 67.3%
Pitt Meadows $734,700 267.1 0.5% -0.9% -1.0% -5.2% 24.8% 76.5% 95.8%
Port Coquitlam $727,700 249.1 0.5% -1.5% -1.9% -5.1% 16.3% 67.1% 78.8%
Port Moody $894,700 247.3 -0.6% -2.0% -1.2% -5.9% 16.4% 64.4% 84.6%
Richmond $909,900 270.5 0.5% 0.8% -1.8% -7.7% 4.5% 54.0% 82.8%
Squamish $784,800 249.7 1.0% 2.9% 1.8% 1.7% 23.2% 83.1% 99.3%
Sunshine Coast $604,000 211.6 0.6% 0.4% -2.0% 0.8% 24.3% 70.0% 61.2%
Tsawwassen $908,800 227.8 0.7% -2.2% -4.0% -8.9% -7.3% 45.3% 67.9%
Vancouver East $1,038,200 304.8 0.5% 0.4% -2.3% -6.3% 2.3% 54.3% 95.9%
Vancouver West $1,227,100 255.7 0.2% 0.4% -1.1% -7.8% -1.8% 39.7% 72.0%
West Vancouver $2,095,300 230.7 1.1% -1.4% -1.8% -8.9% -19.4% 26.1% 70.8%
Whistler $917,400 213.8 0.1% 2.7% 3.0% 2.7% 28.6% 83.5% 73.0%
Single Family Detached Lower Mainland $1,212,900 257.2 0.3% -0.5% -1.3% -5.7% -2.2% 49.9% 86.6%
Greater Vancouver $1,410,500 259.5 0.3% -0.5% -1.3% -7.5% -8.9% 41.0% 82.7%
Bowen Island $973,700 211.1 -0.2% 2.4% -1.8% 0.6% 22.8% 65.4% 60.4%
Burnaby East $1,153,300 257.9 -0.6% -2.4% -1.7% -7.8% -2.3% 45.1% 82.3%
Burnaby North $1,366,200 264.2 1.6% -0.5% -1.9% -8.1% -11.8% 37.5% 84.4%
Burnaby South $1,473,100 282.0 1.0% -0.3% -3.8% -9.6% -11.1% 40.6% 98.5%
Coquitlam $1,151,200 255.5 -0.5% -1.5% -0.5% -8.1% -3.8% 50.2% 88.4%
Ladner $916,800 221.0 -2.1% -3.1% -4.7% -6.9% -11.5% 40.9% 65.0%
Maple Ridge $804,200 229.1 -0.5% -2.3% -1.4% -5.7% 12.5% 68.8% 79.3%
New Westminster $1,017,000 253.7 -0.9% -2.8% -3.5% -9.3% -1.5% 44.1% 77.7%
North Vancouver $1,465,700 230.8 0.2% -1.5% -3.0% -6.7% -11.7% 40.3% 70.5%
Pitt Meadows $881,900 248.5 0.8% -2.0% -1.7% -2.9% 11.3% 68.4% 85.2%
Port Coquitlam $914,700 243.9 0.7% -0.5% -0.2% -6.2% 3.9% 55.8% 79.3%
Port Moody $1,394,300 257.5 -1.0% -3.3% 2.1% -6.4% 1.2% 54.1% 90.9%
Richmond $1,501,600 290.9 1.7% 1.8% -1.9% -8.1% -12.3% 43.7% 91.8%
Squamish $986,600 260.0 1.2% 0.6% 2.2% 3.3% 21.7% 80.6% 100.0%
Sunshine Coast $598,300 209.6 0.6% 0.4% -2.1% 0.1% 23.7% 69.2% 59.6%
Tsawwassen $1,130,400 243.4 -0.4% -3.6% -4.3% -8.6% -9.8% 49.4% 81.8%
Vancouver East $1,360,500 302.6 0.1% 0.6% 0.3% -7.8% -10.1% 42.8% 104.6%
Vancouver West $2,912,000 298.6 0.6% 0.6% -1.2% -10.7% -18.2% 26.3% 87.1%
West Vancouver $2,523,300 238.2 0.1% -1.0% -2.2% -8.5% -22.9% 23.5% 77.8%
Whistler $1,659,200 230.8 0.9% 0.6% 6.0% 5.1% 19.8% 67.9% 75.8%
HOW TO READ THE TABLE:
• Benchmark Price: Estimated sale price of a benchmark property. Benchmarks represent a typical property within each market.
• Price Index: Index numbers estimate the percentage change in price on typical and constant quality properties over time. All figures are based on past sales.
• x Month/Year Change %: Percentage change of index over a period of x month(s)/year(s) *
In January 2005, the indexes are set to 100.
Townhome properties are similar to Attached properties, a category that was used in the previous MLSLink HPI, but do not included duplexes.
The above info is deemed reliable, but is not guaranteed. All dollar amounts in CDN.
October 2019*
* MLS®, Multiple Listing Service®, and all related graphics are trademarks of The Canadian Real Estate Association 1 of 16
Property Type Area
Benchmark
Price
Price
Index
1 Month
Change %
3 Month
Change %
6 Month
Change %
1 Year
Change %
3 Year
Change %
5 Year
Change %
10 Year
Change %
October 2019*
Townhouse Lower Mainland $662,500 238.7 -0.1% -0.3% -0.7% -5.1% 17.2% 61.3% 74.2%
Greater Vancouver $771,600 247.6 0.5% 0.2% -0.4% -5.8% 14.9% 56.8% 76.7%
Burnaby East $653,000 241.2 1.1% 0.7% -0.6% -8.3% 22.3% 51.7% 69.9%
Burnaby North $723,900 270.2 -0.8% 0.1% 2.1% -4.9% 20.9% 60.5% 86.7%
Burnaby South $776,600 267.5 2.6% 2.1% 1.1% -4.3% 19.4% 60.1% 84.1%
Coquitlam $648,600 238.0 -0.4% -0.7% -2.1% -4.8% 18.8% 57.9% 78.0%
Ladner $632,300 224.9 4.0% 0.2% -2.8% -13.1% 5.8% 36.6% 54.0%
Maple Ridge $528,800 245.5 1.2% 0.9% -2.5% -4.4% 26.2% 76.0% 80.6%
New Westminster $724,800 265.8 2.6% 1.5% -1.0% -6.8% 23.3% 56.5% 84.7%
North Vancouver $936,300 227.5 -0.1% -0.8% -1.1% -8.8% 10.2% 50.1% 67.5%
Pitt Meadows $597,900 258.7 0.4% -0.3% -0.9% -9.7% 26.0% 81.8% 94.4%
Port Coquitlam $621,800 235.4 -0.2% -1.6% 1.0% -3.8% 12.5% 60.4% 71.3%
Port Moody $620,200 209.6 -2.3% -5.6% -6.2% -8.4% 18.4% 43.6% 55.5%
Richmond $773,400 253.9 0.8% 0.3% -0.6% -9.2% 9.3% 50.7% 77.2%
Squamish $705,900 232.1 -2.0% 2.6% 4.4% -2.9% 23.1% 81.3% 94.4%
Tsawwassen $607,400 239.1 2.9% -1.0% -4.9% -13.6% 9.6% 42.5% 63.8%
Vancouver East $852,800 273.2 1.1% 0.6% -1.8% -1.9% 11.4% 53.9% 83.5%
Vancouver West $1,113,400 260.3 1.3% -0.1% 0.5% -4.1% 5.1% 50.7% 80.0%
Whistler $923,300 222.6 -2.6% 0.9% 3.1% -2.1% 31.1% 87.2% 86.4%
Apartment Lower Mainland $639,300 268.8 0.1% -0.4% -2.6% -5.8% 27.9% 72.5% 83.9%
Greater Vancouver $652,500 260.8 0.2% -0.1% -2.2% -5.9% 22.2% 65.3% 78.6%
Burnaby East $711,300 272.9 -0.4% -1.4% -5.8% -6.6% 20.1% 57.7% 79.9%
Burnaby North $590,300 252.0 -0.2% -3.2% -3.5% -6.5% 27.4% 70.5% 78.1%
Burnaby South $645,300 259.1 -1.4% -1.3% -5.0% -8.0% 21.7% 64.7% 80.6%
Coquitlam $517,000 283.7 -0.2% 0.1% 1.1% -2.3% 39.8% 88.1% 106.3%
Ladner $431,500 204.5 2.3% -0.3% -0.5% -7.2% 4.3% 37.4% 45.7%
Maple Ridge $350,400 250.2 0.6% 0.8% 0.5% -3.7% 39.3% 74.0% 73.4%
New Westminster $508,100 287.9 -0.6% -1.4% -3.3% -9.3% 32.5% 77.0% 94.9%
North Vancouver $554,100 226.0 1.4% -0.1% -1.7% -5.0% 20.8% 54.4% 62.8%
Pitt Meadows $490,600 289.3 0.7% 0.4% 0.1% -4.7% 38.2% 80.5% 100.5%
Port Coquitlam $437,400 261.6 0.9% -1.9% -4.1% -4.5% 33.6% 85.5% 80.7%
Port Moody $630,600 262.8 0.6% 0.3% -0.4% -4.3% 32.2% 88.3% 97.7%
Richmond $625,500 267.8 -0.3% 0.5% -2.2% -6.2% 29.5% 73.3% 80.9%
Squamish $511,400 252.1 4.0% 6.9% -1.3% 4.5% 32.1% 107.8% 105.6%
Tsawwassen $462,700 195.1 2.7% 0.9% -1.5% -6.9% 8.3% 42.8% 39.0%
Vancouver East $552,000 315.0 0.7% 0.3% -4.4% -5.9% 19.2% 70.4% 87.4%
Vancouver West $754,100 244.7 -0.1% 0.2% -1.4% -6.9% 9.8% 50.5% 67.9%
West Vancouver $1,048,800 213.1 2.7% -3.4% -2.0% -9.2% 11.3% 48.5% 54.3%
Whistler $503,700 197.3 2.3% 5.8% 1.2% 5.1% 33.3% 99.9% 60.9%
HOW TO READ THE TABLE:
• Benchmark Price: Estimated sale price of a benchmark property. Benchmarks represent a typical property within each market.
• Price Index: Index numbers estimate the percentage change in price on typical and constant quality properties over time. All figures are based on past sales.
• x Month/Year Change %: Percentage change of index over a period of x month(s)/year(s)
In January 2005, the indexes are set to 100. *
Townhome properties are similar to attached properties, a category that was used in the previous MLSLink HPI, but do not included duplexes.
Lower Mainland includes areas serviced by both Real Estate Board of Greater Vancouver & Fraser Valley Real Estate Board.
The above info is deemed reliable, but is not guaranteed. All dollar amounts in CDN.
* MLS®, Multiple Listing Service®, and all related graphics are trademarks of The Canadian Real Estate Association 2 of 16
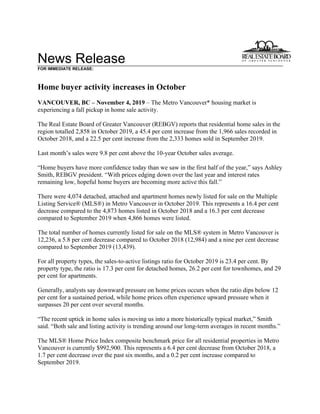
C:DATAMonthEndHpiexporthi_resgv-hpi2.tifGreaterVancouver
5YearTrend
60
110
160
210
260
310
Oct 2014
Dec 2014
Feb 2015
Apr 2015
Jun 2015
Aug 2015
Oct 2015
Dec 2015
Feb 2016
Apr 2016
Jun 2016
Aug 2016
Oct 2016
Dec 2016
Feb 2017
Apr 2017
Jun 2017
Aug 2017
Oct 2017
Dec 2017
Feb 2018
Apr 2018
Jun 2018
Aug 2018
Oct 2018
Dec 2018
Feb 2019
Apr 2019
Jun 2019
Aug 2019
Oct 2019
Price
Index
ResidentialDetachedTownhouseApartment
Jan2005HPI=100
10262019MLS®
SALESFacts
Burnaby
Coquitlam
Delta-South
Islands-Gulf
MapleRidge/PittMeadows
NewWestminster
NorthVancouver
PortCoquitlam
PortMoody/Belcarra
Richmond
Squamish
SunshineCoast
VancouverEast
VancouverWest
WestVancouver/HoweSound
Whistler/Pemberton
Detached8697424126238930131082452108784612938
Attached6353904715463126852054563721536
Apartment1961031503698125442515124316236312271,384
Detached$1,390,000$1,185,000$973,500n/a$849,980$1,092,000$1,540,000$874,000n/a$1,485,000$979,000$595,000$1,422,500$3,044,444$2,225,000n/a
Attached$835,000$749,900n/an/a$519,000n/a$1,008,700$631,000$771,500$808,000$712,500n/a$1,020,000$1,400,000n/a$1,118,000n/a
Apartment$575,000$535,000n/an/a$366,500$490,750$630,000$390,000$585,000$525,000$437,450n/a$573,000$728,000n/a$512,000
Detached63802679622591813722246109613516745
Attached5146100549242211771753739218422
Apartment1658718037798338241346714730312261,166
Detached$1,400,000$1,161,500$959,500n/a$830,000$1,154,834$1,598,000n/an/a$1,497,500$1,026,500$640,000$1,400,000$2,480,000$2,325,000n/a
Attached$775,000$798,900n/an/a$529,500n/a$941,500$677,500n/a$763,000n/an/a$992,500$1,338,000n/an/an/a
Apartment$590,000$524,800n/an/a$342,500$475,000$605,000$428,500$587,250$546,000n/an/a$561,500$789,000n/a$670,000
Detached4545273851468171159154980663617637
Attached322870463262111471253546322344
Apartment103621204371793714124641192681528985
Detached$1,565,000$1,155,000$1,000,000n/a$877,000n/a$1,580,000n/an/a$1,598,000n/a$589,888$1,547,500$3,465,000$2,825,000n/a
Attached$825,000$759,500n/an/a$525,000n/a$929,000$675,000n/a$838,000n/an/a$960,000$1,131,500n/a$960,000n/a
Apartment$600,000$525,000n/an/a$395,000$466,000$659,000$419,900n/a$572,500n/an/a$595,000$749,000n/a$270,000
Detached560670299438361766702451216651794238206283541026,791
Attached47637111714608430721512452814656370428311603,874
Apartment1,38575514903307548223132221,148105641,1272,6929820810,172
Detached$1,410,000$1,195,000$1,000,000$566,000$830,000$1,100,000$1,550,000$908,500$1,228,000$1,465,000$982,000$619,524$1,385,000$2,820,000$2,390,000$1,786,650
Attached$760,450$768,900$680,000n/a$523,000$703,500$985,000$650,000$739,500$786,000$659,250$446,500$991,250$1,280,000$1,600,000$955,000n/a
Apartment$577,000$520,000$499,000n/a$355,000$495,000$618,250$410,000$565,000$530,000$452,000$432,400$560,000$745,000$1,030,000$486,500
Detached515609320458631955932691036821684708236112881246,678
Attached4492999514059629720312961313675357424402163,835
Apartment1,31680015305148238493872281,488127501,2693,00215626411,426
Detached$1,600,000$1,305,000$1,100,000$485,000$877,000$1,250,000$1,675,000$1,002,500$1,400,000$1,680,000$984,000$657,500$1,595,000$3,100,000$2,800,000$1,897,000
Attached$790,000$805,000$759,900n/a$555,000$765,172$990,000$690,000$755,000$870,000$685,000$445,000$1,059,000$1,376,400$1,584,000$1,089,000n/a
Apartment$600,000$548,000$552,000n/a$394,000$510,000$659,900$442,000$599,000$580,000$449,000$399,450$615,000$815,000$1,197,500$397,450
Note:MedianSellingPricesarenotreportedforareaswithlessthan20salesorfortheGulfIslands
Median
Selling
Price
Number
of
Sales
Median
Selling
Price
September
2019
October
2018
Jan.-
Oct.2019
Jan.-
Oct.2018
Median
Selling
Price
Number
of
Sales
Median
Selling
Price
Number
of
Sales
October
2019
Number
of
Sales
Median
Selling
Price
Number
of
Sales
October
2019
Year-to-date
Year-to-date
10262019MLS®
LISTINGSFacts
Burnaby
Coquitlam
Delta-South
Islands-Gulf
MapleRidge/PittMeadows
NewWestminster
NorthVancouver
PortCoquitlam
PortMoody/Belcarra
Richmond
Squamish
SunshineCoast
VancouverEast
VancouverWest
WestVancouver/HoweSound
Whistler/Pemberton
Detached1081407461633913135231452861144170112191,398
Attached100622507020552528126151090127629788
Apartment2771264315399152662923024519851735331,888
Detached80%69%57%67%77%59%68%86%57%74%86%85%75%46%41%63%
Attached63%85%36%n/a67%75%84%124%93%67%133%50%50%50%117%72%n/a
Apartment71%82%35%0%68%99%82%67%86%66%100%60%82%70%34%82%
Detached14115476102124417244281953556174182166231,712
Attached10672180693583342512930191071181632893
Apartment28715540048134184623922926829368244302,261
Detached45%52%34%70%45%50%34%41%46%37%63%82%63%34%21%70%
Attached48%64%56%n/a78%26%29%65%44%60%57%26%35%33%13%56%n/a
Apartment57%56%45%n/a77%59%45%61%62%59%23%88%50%44%27%87%
Detached1861317151644517648282012464197207144141,705
Attached104783208635784613120256761042131855
Apartment29015227061157209662825923425470143392,313
Detached24%34%38%60%52%31%39%35%39%29%63%77%41%32%25%121%
Attached31%36%22%n/a53%9%33%46%85%39%48%83%46%44%14%71%n/a
Apartment36%41%44%n/a70%45%38%56%50%48%26%100%47%38%35%72%
Detached1,4251,636821821,7944111,4884893242,0723369001,8451,8941,36123117,109
Attached1,09575125057531976814032441,4052311507661,1641333108,538
Apartment2,8381,51835516071,4341,7976323492,6642091482,2246,20237734121,696
Detached39%41%36%52%47%43%45%50%37%32%53%47%44%33%26%44%
Attached43%49%47%20%61%43%45%53%51%38%63%37%48%37%23%52%n/a
Apartment49%50%42%0%54%53%46%50%64%43%50%43%51%43%26%61%
Detached1,7471,705866991,7184301,7626273192,4493969142,3242,3121,53922319,430
Attached956675197167181996054152141,2722421107781,1031523387,990
Apartment2,4651,52426717661,3881,5875933952,730229762,3786,17938536321,326
Detached29%36%37%45%50%45%34%43%32%28%42%51%35%26%19%56%
Attached47%44%48%6%56%48%49%49%60%48%56%68%46%38%26%64%n/a
Apartment53%52%57%0%67%59%53%65%58%55%55%66%53%49%41%73%
*Year-to-datelistingsrepresentacumulativetotaloflistingsratherthantotalactivelistings.
Number
of
Listings
October
2019
Number
of
Listings
%Salesto
Listings
Number
of
Listings
%Salesto
Listings
Number
of
Listings
%Salesto
Listings
September
2019
October
2018
Jan.-
Oct.2019
Jan.-
Oct.2018
%Salesto
Listings
Number
of
Listings
%Salesto
Listings
October
2019
Year-to-date*
Year-to-date*
Listing & Sales Activity Summary
Listings Sales
1 2 3 Col. 2 & 3 5 6 7 Col. 6 & 7 9 10 Col. 9 & 10
Oct Sep Oct Percentage Oct Sep Oct Percentage Aug 2018 - Aug 2019 - Percentage
2018 2019 2019 Variance 2018 2019 2019 Variance Oct 2018 Oct 2019 Variance
BURNABY % % %
DETACHED 186 141 108 -23.4 45 63 86 36.5 124 211 70.2
ATTACHED 104 106 100 -5.7 32 51 63 23.5 105 178 69.5
APARTMENTS 290 287 277 -3.5 103 165 196 18.8 322 521 61.8
COQUITLAM
DETACHED 131 154 140 -9.1 45 80 97 21.3 154 255 65.6
ATTACHED 78 72 62 -13.9 28 46 53 15.2 91 138 51.6
APARTMENTS 152 155 126 -18.7 62 87 103 18.4 202 271 34.2
DELTA
DETACHED 71 76 74 -2.6 27 26 42 61.5 80 100 25.0
ATTACHED 32 18 25 38.9 7 10 9 -10.0 31 31 0.0
APARTMENTS 27 40 43 7.5 12 18 15 -16.7 38 52 36.8
MAPLE RIDGE/PITT MEADOWS
DETACHED 164 212 163 -23.1 85 96 126 31.3 205 312 52.2
ATTACHED 86 69 70 1.4 46 54 47 -13.0 112 145 29.5
APARTMENTS 61 48 53 10.4 43 37 36 -2.7 103 109 5.8
NORTH VANCOUVER
DETACHED 176 172 131 -23.8 68 59 89 50.8 140 212 51.4
ATTACHED 78 83 55 -33.7 26 24 46 91.7 77 102 32.5
APARTMENTS 209 184 152 -17.4 79 83 125 50.6 205 296 44.4
NEW WESTMINSTER
DETACHED 45 44 39 -11.4 14 22 23 4.5 42 59 40.5
ATTACHED 35 35 20 -42.9 3 9 15 66.7 13 32 146.2
APARTMENTS 157 134 99 -26.1 71 79 98 24.1 199 252 26.6
PORT MOODY/BELCARRA
DETACHED 28 28 23 -17.9 11 13 13 0.0 25 38 52.0
ATTACHED 13 25 28 12.0 11 11 26 136.4 25 48 92.0
APARTMENTS 28 39 29 -25.6 14 24 25 4.2 49 65 32.7
PORT COQUITLAM
DETACHED 48 44 35 -20.5 17 18 30 66.7 58 79 36.2
ATTACHED 46 34 25 -26.5 21 22 31 40.9 53 71 34.0
APARTMENTS 66 62 66 6.5 37 38 44 15.8 108 112 3.7
RICHMOND
DETACHED 201 195 145 -25.6 59 72 108 50.0 176 247 40.3
ATTACHED 120 129 126 -2.3 47 77 85 10.4 140 218 55.7
APARTMENTS 259 229 230 0.4 124 134 151 12.7 374 412 10.2
SUNSHINE COAST
DETACHED 64 56 61 8.9 49 46 52 13.0 140 147 5.0
ATTACHED 6 19 10 -47.4 5 5 5 0.0 16 16 0.0
APARTMENTS 4 8 5 -37.5 4 7 3 -57.1 9 15 66.7
SQUAMISH
DETACHED 24 35 28 -20.0 15 22 24 9.1 48 66 37.5
ATTACHED 25 30 15 -50.0 12 17 20 17.6 28 52 85.7
APARTMENTS 23 26 24 -7.7 6 6 24 300.0 30 35 16.7
VANCOUVER EAST
DETACHED 197 174 144 -17.2 80 109 108 -0.9 210 290 38.1
ATTACHED 76 107 90 -15.9 35 37 45 21.6 84 119 41.7
APARTMENTS 254 293 198 -32.4 119 147 162 10.2 325 433 33.2
VANCOUVER WEST
DETACHED 207 182 170 -6.6 66 61 78 27.9 162 199 22.8
ATTACHED 104 118 127 7.6 46 39 63 61.5 117 151 29.1
APARTMENTS 701 682 517 -24.2 268 303 363 19.8 751 980 30.5
WHISTLER/PEMBERTON
DETACHED 14 23 19 -17.4 17 16 12 -25.0 41 40 -2.4
ATTACHED 31 32 29 -9.4 22 18 21 16.7 55 56 1.8
APARTMENTS 39 30 33 10.0 28 26 27 3.8 71 81 14.1
WEST VANCOUVER/HOWE SOUND
DETACHED 144 166 112 -32.5 36 35 46 31.4 88 121 37.5
ATTACHED 21 16 6 -62.5 3 2 7 250.0 9 10 11.1
APARTMENTS 43 44 35 -20.5 15 12 12 0.0 36 32 -11.1
GRAND TOTALS
DETACHED 1700 1702 1392 -18.2 634 738 934 26.6 1693 2376 40.3
ATTACHED 855 893 788 -11.8 344 422 536 27.0 956 1367 43.0
APARTMENTS 2313 2261 1887 -16.5 985 1166 1384 18.7 2822 3666 29.9
ResidentialAverageSalePrices-January1977toOctober2019
0
200
400
600
800
1000
1200
1400
1600
1800
2000
1977
1978
1979
1980
1981
1982
1983
1984
1985
1986
1987
1988
1989
1990
1991
1992
1993
1994
1995
1996
1997
1998
1999
2000
2001
2002
2003
2004
2005
2006
2007
2008
2009
2010
2011
2012
2013
2014
2015
2016
2017
2018
2019
DETACHEDCONDOMINIUMATTACHEDAPARTMENTS
INTHOUSANDS($)
NOTE:From1977-1984condominiumaverageswerenotseparatedintoattached&apartment.
$909,258
$656,691
$1,527,296

Weitere ähnliche Inhalte

Was ist angesagt?

REBGV Statistics Package April 2021
REBGV Statistics Package April 2021REBGV Statistics Package April 2021
REBGV Statistics Package April 2021Vicky Aulakh
 
Rebgv stats-pkg-april-2018
Rebgv stats-pkg-april-2018Rebgv stats-pkg-april-2018
Rebgv stats-pkg-april-2018Kathryn Huang
 
Rebgv stats-pkg-may-2018
Rebgv stats-pkg-may-2018Rebgv stats-pkg-may-2018
Rebgv stats-pkg-may-2018Kathryn Huang
 
Rebgv stats-pkg-february-2019
Rebgv stats-pkg-february-2019Rebgv stats-pkg-february-2019
Rebgv stats-pkg-february-2019Kathryn Huang
 
Real Estate Board of Greater Vancouver Statistics Package July 2021
Real Estate Board of Greater Vancouver Statistics Package July 2021Real Estate Board of Greater Vancouver Statistics Package July 2021
Real Estate Board of Greater Vancouver Statistics Package July 2021Vicky Aulakh
 
Real Estate Board of Greater Vancouver Statistics Package August 2021
Real Estate Board of Greater Vancouver Statistics Package August 2021Real Estate Board of Greater Vancouver Statistics Package August 2021
Real Estate Board of Greater Vancouver Statistics Package August 2021Vicky Aulakh
 
Rebgv stats-pkg-july-2019
Rebgv stats-pkg-july-2019Rebgv stats-pkg-july-2019
Rebgv stats-pkg-july-2019Vicky Aulakh
 
Real Estate Board of Greater Vancouver Statistics Package - November 2021
Real Estate Board of Greater Vancouver Statistics Package - November 2021Real Estate Board of Greater Vancouver Statistics Package - November 2021
Real Estate Board of Greater Vancouver Statistics Package - November 2021VickyAulakh1
 
2021 June - REBGV Statistics Package
2021 June - REBGV Statistics Package2021 June - REBGV Statistics Package
2021 June - REBGV Statistics PackageVicky Aulakh
 
Rebgv stats-pkg-may-2019
Rebgv stats-pkg-may-2019Rebgv stats-pkg-may-2019
Rebgv stats-pkg-may-2019Kathryn Huang
 
Rebgv stats-pkg-september-2018
Rebgv stats-pkg-september-2018Rebgv stats-pkg-september-2018
Rebgv stats-pkg-september-2018Kathryn Huang
 
Rebgv stats-pkg-april-2019
Rebgv stats-pkg-april-2019Rebgv stats-pkg-april-2019
Rebgv stats-pkg-april-2019Kathryn Huang
 
201807 rebgv-stats-package-for-media
201807 rebgv-stats-package-for-media201807 rebgv-stats-package-for-media
201807 rebgv-stats-package-for-mediaKathryn Huang
 
Rebgv stats-pkg-august-2019
Rebgv stats-pkg-august-2019Rebgv stats-pkg-august-2019
Rebgv stats-pkg-august-2019Vicky Aulakh
 
Rebgv stats-pkg-june-2018
Rebgv stats-pkg-june-2018Rebgv stats-pkg-june-2018
Rebgv stats-pkg-june-2018Kathryn Huang
 
REBGV Stats Package February 2021
REBGV Stats Package February 2021REBGV Stats Package February 2021
REBGV Stats Package February 2021Vicky Aulakh
 
Rebgv stats-pkg-february-2020
Rebgv stats-pkg-february-2020Rebgv stats-pkg-february-2020
Rebgv stats-pkg-february-2020Vicky Aulakh
 
REBGV Statistics Package August 2020
REBGV Statistics Package August 2020REBGV Statistics Package August 2020
REBGV Statistics Package August 2020Vicky Aulakh
 
REBGV Statistics package July 2020
REBGV Statistics package July 2020REBGV Statistics package July 2020
REBGV Statistics package July 2020Vicky Aulakh
 

Was ist angesagt? (19)

REBGV Statistics Package April 2021
REBGV Statistics Package April 2021REBGV Statistics Package April 2021
REBGV Statistics Package April 2021
 
Rebgv stats-pkg-april-2018
Rebgv stats-pkg-april-2018Rebgv stats-pkg-april-2018
Rebgv stats-pkg-april-2018
 
Rebgv stats-pkg-may-2018
Rebgv stats-pkg-may-2018Rebgv stats-pkg-may-2018
Rebgv stats-pkg-may-2018
 
Rebgv stats-pkg-february-2019
Rebgv stats-pkg-february-2019Rebgv stats-pkg-february-2019
Rebgv stats-pkg-february-2019
 
Real Estate Board of Greater Vancouver Statistics Package July 2021
Real Estate Board of Greater Vancouver Statistics Package July 2021Real Estate Board of Greater Vancouver Statistics Package July 2021
Real Estate Board of Greater Vancouver Statistics Package July 2021
 
Real Estate Board of Greater Vancouver Statistics Package August 2021
Real Estate Board of Greater Vancouver Statistics Package August 2021Real Estate Board of Greater Vancouver Statistics Package August 2021
Real Estate Board of Greater Vancouver Statistics Package August 2021
 
Rebgv stats-pkg-july-2019
Rebgv stats-pkg-july-2019Rebgv stats-pkg-july-2019
Rebgv stats-pkg-july-2019
 
Real Estate Board of Greater Vancouver Statistics Package - November 2021
Real Estate Board of Greater Vancouver Statistics Package - November 2021Real Estate Board of Greater Vancouver Statistics Package - November 2021
Real Estate Board of Greater Vancouver Statistics Package - November 2021
 
2021 June - REBGV Statistics Package
2021 June - REBGV Statistics Package2021 June - REBGV Statistics Package
2021 June - REBGV Statistics Package
 
Rebgv stats-pkg-may-2019
Rebgv stats-pkg-may-2019Rebgv stats-pkg-may-2019
Rebgv stats-pkg-may-2019
 
Rebgv stats-pkg-september-2018
Rebgv stats-pkg-september-2018Rebgv stats-pkg-september-2018
Rebgv stats-pkg-september-2018
 
Rebgv stats-pkg-april-2019
Rebgv stats-pkg-april-2019Rebgv stats-pkg-april-2019
Rebgv stats-pkg-april-2019
 
201807 rebgv-stats-package-for-media
201807 rebgv-stats-package-for-media201807 rebgv-stats-package-for-media
201807 rebgv-stats-package-for-media
 
Rebgv stats-pkg-august-2019
Rebgv stats-pkg-august-2019Rebgv stats-pkg-august-2019
Rebgv stats-pkg-august-2019
 
Rebgv stats-pkg-june-2018
Rebgv stats-pkg-june-2018Rebgv stats-pkg-june-2018
Rebgv stats-pkg-june-2018
 
REBGV Stats Package February 2021
REBGV Stats Package February 2021REBGV Stats Package February 2021
REBGV Stats Package February 2021
 
Rebgv stats-pkg-february-2020
Rebgv stats-pkg-february-2020Rebgv stats-pkg-february-2020
Rebgv stats-pkg-february-2020
 
REBGV Statistics Package August 2020
REBGV Statistics Package August 2020REBGV Statistics Package August 2020
REBGV Statistics Package August 2020
 
REBGV Statistics package July 2020
REBGV Statistics package July 2020REBGV Statistics package July 2020
REBGV Statistics package July 2020
 

Ähnlich wie Rebgv stats-pkg-october-2019

Rebgv stats-pkg-november-2019-f
Rebgv stats-pkg-november-2019-fRebgv stats-pkg-november-2019-f
Rebgv stats-pkg-november-2019-fVicky Aulakh
 
Rebgv stats-pkg-september-2019
Rebgv stats-pkg-september-2019Rebgv stats-pkg-september-2019
Rebgv stats-pkg-september-2019Vicky Aulakh
 
May-2019 Stats Package for Greater Vancouver
May-2019 Stats Package for Greater VancouverMay-2019 Stats Package for Greater Vancouver
May-2019 Stats Package for Greater VancouverBC PRIME Realty
 
Rebgv Stats Package September 2020
Rebgv Stats Package September 2020Rebgv Stats Package September 2020
Rebgv Stats Package September 2020Vicky Aulakh
 
Rebgv stats-pkg-august-2018
Rebgv stats-pkg-august-2018Rebgv stats-pkg-august-2018
Rebgv stats-pkg-august-2018Kathryn Huang
 
Rebgv stats-pkg-march-2019
Rebgv stats-pkg-march-2019Rebgv stats-pkg-march-2019
Rebgv stats-pkg-march-2019Sherryl Jacobs
 
Rebgv stats-pkg-october-2018 .pdf
Rebgv stats-pkg-october-2018 .pdf Rebgv stats-pkg-october-2018 .pdf
Rebgv stats-pkg-october-2018 .pdf Kathryn Huang
 
Rebgv stats-pkg-january-2018 2
Rebgv stats-pkg-january-2018 2Rebgv stats-pkg-january-2018 2
Rebgv stats-pkg-january-2018 2Kathryn Huang
 
REBGV Statistics Package May 2020
REBGV Statistics Package May 2020REBGV Statistics Package May 2020
REBGV Statistics Package May 2020Vicky Aulakh
 
August 2017 REBGV Stats Mike Stewart Realtor
August 2017 REBGV Stats Mike Stewart RealtorAugust 2017 REBGV Stats Mike Stewart Realtor
August 2017 REBGV Stats Mike Stewart RealtorMike Stewart
 
Rebgv stats-pkg-january-2019
Rebgv stats-pkg-january-2019Rebgv stats-pkg-january-2019
Rebgv stats-pkg-january-2019Kathryn Huang
 
November 2017 rebgv stats mike stewart real estate agent
November 2017 rebgv stats mike stewart real estate agentNovember 2017 rebgv stats mike stewart real estate agent
November 2017 rebgv stats mike stewart real estate agentMike Stewart
 
REBGV Statistics Package June 2020
REBGV Statistics Package June 2020REBGV Statistics Package June 2020
REBGV Statistics Package June 2020Vicky Aulakh
 
REBGV September 2016 Stats Package Mike Stewart Vancouver Realtor
REBGV September 2016 Stats Package Mike Stewart Vancouver RealtorREBGV September 2016 Stats Package Mike Stewart Vancouver Realtor
REBGV September 2016 Stats Package Mike Stewart Vancouver RealtorMike Stewart
 
Real Estate Board of Greater Vancouver Statistics Package November 2020
Real Estate Board of Greater Vancouver Statistics Package November 2020Real Estate Board of Greater Vancouver Statistics Package November 2020
Real Estate Board of Greater Vancouver Statistics Package November 2020Vicky Aulakh
 
Real Estate Board of Greater Vancouver Statistics Package January 2021
Real Estate Board of Greater Vancouver Statistics Package January 2021 Real Estate Board of Greater Vancouver Statistics Package January 2021
Real Estate Board of Greater Vancouver Statistics Package January 2021 Vicky Aulakh
 

Ähnlich wie Rebgv stats-pkg-october-2019 (18)

Rebgv stats-pkg-november-2019-f
Rebgv stats-pkg-november-2019-fRebgv stats-pkg-november-2019-f
Rebgv stats-pkg-november-2019-f
 
Rebgv stats-pkg-september-2019
Rebgv stats-pkg-september-2019Rebgv stats-pkg-september-2019
Rebgv stats-pkg-september-2019
 
May-2019 Stats Package for Greater Vancouver
May-2019 Stats Package for Greater VancouverMay-2019 Stats Package for Greater Vancouver
May-2019 Stats Package for Greater Vancouver
 
Rebgv Stats Package September 2020
Rebgv Stats Package September 2020Rebgv Stats Package September 2020
Rebgv Stats Package September 2020
 
Rebgv stats-pkg-august-2018
Rebgv stats-pkg-august-2018Rebgv stats-pkg-august-2018
Rebgv stats-pkg-august-2018
 
Rebgv stats-pkg-october-2020
Rebgv stats-pkg-october-2020Rebgv stats-pkg-october-2020
Rebgv stats-pkg-october-2020
 
Rebgv stats-pkg-march-2019
Rebgv stats-pkg-march-2019Rebgv stats-pkg-march-2019
Rebgv stats-pkg-march-2019
 
Rebgv stats-pkg-october-2018 .pdf
Rebgv stats-pkg-october-2018 .pdf Rebgv stats-pkg-october-2018 .pdf
Rebgv stats-pkg-october-2018 .pdf
 
Rebgv stats-pkg-january-2018 2
Rebgv stats-pkg-january-2018 2Rebgv stats-pkg-january-2018 2
Rebgv stats-pkg-january-2018 2
 
REBGV Statistics Package May 2020
REBGV Statistics Package May 2020REBGV Statistics Package May 2020
REBGV Statistics Package May 2020
 
August 2017 REBGV Stats Mike Stewart Realtor
August 2017 REBGV Stats Mike Stewart RealtorAugust 2017 REBGV Stats Mike Stewart Realtor
August 2017 REBGV Stats Mike Stewart Realtor
 
Rebgv stats-pkg-january-2019
Rebgv stats-pkg-january-2019Rebgv stats-pkg-january-2019
Rebgv stats-pkg-january-2019
 
November 2017 rebgv stats mike stewart real estate agent
November 2017 rebgv stats mike stewart real estate agentNovember 2017 rebgv stats mike stewart real estate agent
November 2017 rebgv stats mike stewart real estate agent
 
REBGV Statistics Package June 2020
REBGV Statistics Package June 2020REBGV Statistics Package June 2020
REBGV Statistics Package June 2020
 
REBGV September 2016 Stats Package Mike Stewart Vancouver Realtor
REBGV September 2016 Stats Package Mike Stewart Vancouver RealtorREBGV September 2016 Stats Package Mike Stewart Vancouver Realtor
REBGV September 2016 Stats Package Mike Stewart Vancouver Realtor
 
Rebgv stats-pkg-november-2020
Rebgv stats-pkg-november-2020Rebgv stats-pkg-november-2020
Rebgv stats-pkg-november-2020
 
Real Estate Board of Greater Vancouver Statistics Package November 2020
Real Estate Board of Greater Vancouver Statistics Package November 2020Real Estate Board of Greater Vancouver Statistics Package November 2020
Real Estate Board of Greater Vancouver Statistics Package November 2020
 
Real Estate Board of Greater Vancouver Statistics Package January 2021
Real Estate Board of Greater Vancouver Statistics Package January 2021 Real Estate Board of Greater Vancouver Statistics Package January 2021
Real Estate Board of Greater Vancouver Statistics Package January 2021
 

Mehr von Vicky Aulakh

Okanagan Statistics May2023.pdf
Okanagan Statistics May2023.pdfOkanagan Statistics May2023.pdf
Okanagan Statistics May2023.pdfVicky Aulakh
 
FVREB May 2023 Statistics Package.pdf
FVREB May 2023 Statistics Package.pdfFVREB May 2023 Statistics Package.pdf
FVREB May 2023 Statistics Package.pdfVicky Aulakh
 
Metro Vancouver Stats.pdf
Metro Vancouver Stats.pdfMetro Vancouver Stats.pdf
Metro Vancouver Stats.pdfVicky Aulakh
 
REBGV-Stats-Pkg-July-2022
REBGV-Stats-Pkg-July-2022REBGV-Stats-Pkg-July-2022
REBGV-Stats-Pkg-July-2022Vicky Aulakh
 
Okanagan Stats June 2022
Okanagan Stats June 2022Okanagan Stats June 2022
Okanagan Stats June 2022Vicky Aulakh
 
Okanagan Stats May 2022
Okanagan Stats May 2022Okanagan Stats May 2022
Okanagan Stats May 2022Vicky Aulakh
 
VREB June 2022 Stats
VREB June 2022 StatsVREB June 2022 Stats
VREB June 2022 StatsVicky Aulakh
 
FVREB June 2022 Stats
FVREB June 2022 StatsFVREB June 2022 Stats
FVREB June 2022 StatsVicky Aulakh
 
REBGV Statistics Package May 2022
REBGV Statistics Package May 2022REBGV Statistics Package May 2022
REBGV Statistics Package May 2022Vicky Aulakh
 
VREB May 2022 Statistics Package.pdf
VREB May 2022 Statistics Package.pdfVREB May 2022 Statistics Package.pdf
VREB May 2022 Statistics Package.pdfVicky Aulakh
 
The Okanagan Real Estate April 2022 Statistics
The Okanagan Real Estate April 2022 StatisticsThe Okanagan Real Estate April 2022 Statistics
The Okanagan Real Estate April 2022 StatisticsVicky Aulakh
 
FVREB April 2022 Stats Package .pdf
FVREB April 2022 Stats Package .pdfFVREB April 2022 Stats Package .pdf
FVREB April 2022 Stats Package .pdfVicky Aulakh
 
VREB April 2022 Stats Package .pdf
VREB April 2022 Stats Package .pdfVREB April 2022 Stats Package .pdf
VREB April 2022 Stats Package .pdfVicky Aulakh
 
REBGV-Stats-Pkg-April-2022.pdf
REBGV-Stats-Pkg-April-2022.pdfREBGV-Stats-Pkg-April-2022.pdf
REBGV-Stats-Pkg-April-2022.pdfVicky Aulakh
 
March 2022 Okanagan Statistics
March 2022 Okanagan StatisticsMarch 2022 Okanagan Statistics
March 2022 Okanagan StatisticsVicky Aulakh
 

Mehr von Vicky Aulakh (20)

Okanagan Statistics May2023.pdf
Okanagan Statistics May2023.pdfOkanagan Statistics May2023.pdf
Okanagan Statistics May2023.pdf
 
FVREB May 2023 Statistics Package.pdf
FVREB May 2023 Statistics Package.pdfFVREB May 2023 Statistics Package.pdf
FVREB May 2023 Statistics Package.pdf
 
Metro Vancouver Stats.pdf
Metro Vancouver Stats.pdfMetro Vancouver Stats.pdf
Metro Vancouver Stats.pdf
 
FVREB July 2022
FVREB July 2022FVREB July 2022
FVREB July 2022
 
REBGV-Stats-Pkg-July-2022
REBGV-Stats-Pkg-July-2022REBGV-Stats-Pkg-July-2022
REBGV-Stats-Pkg-July-2022
 
VREB July 2022
VREB July 2022VREB July 2022
VREB July 2022
 
BCRE June 2022
BCRE June 2022BCRE June 2022
BCRE June 2022
 
Okanagan Stats June 2022
Okanagan Stats June 2022Okanagan Stats June 2022
Okanagan Stats June 2022
 
Okanagan Stats May 2022
Okanagan Stats May 2022Okanagan Stats May 2022
Okanagan Stats May 2022
 
VREB June 2022 Stats
VREB June 2022 StatsVREB June 2022 Stats
VREB June 2022 Stats
 
FVREB June 2022 Stats
FVREB June 2022 StatsFVREB June 2022 Stats
FVREB June 2022 Stats
 
FVREB May 2022
FVREB May 2022FVREB May 2022
FVREB May 2022
 
REBGV Statistics Package May 2022
REBGV Statistics Package May 2022REBGV Statistics Package May 2022
REBGV Statistics Package May 2022
 
VREB May 2022 Statistics Package.pdf
VREB May 2022 Statistics Package.pdfVREB May 2022 Statistics Package.pdf
VREB May 2022 Statistics Package.pdf
 
The Okanagan Real Estate April 2022 Statistics
The Okanagan Real Estate April 2022 StatisticsThe Okanagan Real Estate April 2022 Statistics
The Okanagan Real Estate April 2022 Statistics
 
FVREB April 2022 Stats Package .pdf
FVREB April 2022 Stats Package .pdfFVREB April 2022 Stats Package .pdf
FVREB April 2022 Stats Package .pdf
 
VREB April 2022 Stats Package .pdf
VREB April 2022 Stats Package .pdfVREB April 2022 Stats Package .pdf
VREB April 2022 Stats Package .pdf
 
REBGV-Stats-Pkg-April-2022.pdf
REBGV-Stats-Pkg-April-2022.pdfREBGV-Stats-Pkg-April-2022.pdf
REBGV-Stats-Pkg-April-2022.pdf
 
BCREA.pdf
BCREA.pdfBCREA.pdf
BCREA.pdf
 
March 2022 Okanagan Statistics
March 2022 Okanagan StatisticsMarch 2022 Okanagan Statistics
March 2022 Okanagan Statistics
 

Kürzlich hochgeladen

Call girls in Shakti Nagar Delhi~8447779280°/=@/ Short 1500 Night 6000}ESCORT...
Call girls in Shakti Nagar Delhi~8447779280°/=@/ Short 1500 Night 6000}ESCORT...Call girls in Shakti Nagar Delhi~8447779280°/=@/ Short 1500 Night 6000}ESCORT...
Call girls in Shakti Nagar Delhi~8447779280°/=@/ Short 1500 Night 6000}ESCORT...asmaqueen5
 
Eldeco Dwarka Project In Delhi-brochure.pdf.pdf
Eldeco Dwarka Project In Delhi-brochure.pdf.pdfEldeco Dwarka Project In Delhi-brochure.pdf.pdf
Eldeco Dwarka Project In Delhi-brochure.pdf.pdfkratirudram
 
Kohinoor Courtyard One Wakad Pune | Elegant Living Spaces
Kohinoor Courtyard One Wakad Pune | Elegant Living SpacesKohinoor Courtyard One Wakad Pune | Elegant Living Spaces
Kohinoor Courtyard One Wakad Pune | Elegant Living Spacesaidasheikh47
 
Top tourism places in Dubai - Inch & Brick Realty
Top tourism places in Dubai - Inch & Brick RealtyTop tourism places in Dubai - Inch & Brick Realty
Top tourism places in Dubai - Inch & Brick Realtypunitranainchbrick02
 
Rohan Harita Tathawade Pune Brochure.pdf
Rohan Harita Tathawade Pune Brochure.pdfRohan Harita Tathawade Pune Brochure.pdf
Rohan Harita Tathawade Pune Brochure.pdfabbu831446
 
~Call Girls In Roop Nagar {8447779280}(Low Price) Escort Service In Delhi
~Call Girls In Roop Nagar {8447779280}(Low Price) Escort Service In Delhi~Call Girls In Roop Nagar {8447779280}(Low Price) Escort Service In Delhi
~Call Girls In Roop Nagar {8447779280}(Low Price) Escort Service In Delhiasmaqueen5
 
Retail Space for Lease - 1221 W. Main St., Sun Prairie, WI
Retail Space for Lease - 1221 W. Main St., Sun Prairie, WIRetail Space for Lease - 1221 W. Main St., Sun Prairie, WI
Retail Space for Lease - 1221 W. Main St., Sun Prairie, WILee & Associates of Madison, WI
 
Nyati Elite NIBM Road Pune E Brochure.pdf
Nyati Elite NIBM Road Pune E Brochure.pdfNyati Elite NIBM Road Pune E Brochure.pdf
Nyati Elite NIBM Road Pune E Brochure.pdfabbu831446
 
BPTP THE AMAARIO Luxury Project Invest Like Royalty in Sector 37D Gurgaon Dwa...
BPTP THE AMAARIO Luxury Project Invest Like Royalty in Sector 37D Gurgaon Dwa...BPTP THE AMAARIO Luxury Project Invest Like Royalty in Sector 37D Gurgaon Dwa...
BPTP THE AMAARIO Luxury Project Invest Like Royalty in Sector 37D Gurgaon Dwa...ApartmentWala1
 
Low Density Living New Project in BPTP THE AMAARIO Sector 37D Gurgaon Haryana...
Low Density Living New Project in BPTP THE AMAARIO Sector 37D Gurgaon Haryana...Low Density Living New Project in BPTP THE AMAARIO Sector 37D Gurgaon Haryana...
Low Density Living New Project in BPTP THE AMAARIO Sector 37D Gurgaon Haryana...ApartmentWala1
 
ACE Terra Yamuna Expressway | 8929888700
ACE Terra Yamuna Expressway | 8929888700ACE Terra Yamuna Expressway | 8929888700
ACE Terra Yamuna Expressway | 8929888700Truhomes
 
Kohinoor Teiko Hinjewadi Phase 2 Pune E-Brochure.pdf
Kohinoor Teiko Hinjewadi Phase 2 Pune  E-Brochure.pdfKohinoor Teiko Hinjewadi Phase 2 Pune  E-Brochure.pdf
Kohinoor Teiko Hinjewadi Phase 2 Pune E-Brochure.pdfManishSaxena95
 
Low Rate ✨➥9711108085▻✨Call Girls In East Of Kailash (E.K) (Delhi)
Low Rate ✨➥9711108085▻✨Call Girls In East Of Kailash (E.K) (Delhi)Low Rate ✨➥9711108085▻✨Call Girls In East Of Kailash (E.K) (Delhi)
Low Rate ✨➥9711108085▻✨Call Girls In East Of Kailash (E.K) (Delhi)delhi24hrs1
 
Low rate ↬Call girls in Sabzi Mandi Delhi | 8447779280}Escort Service In All ...
Low rate ↬Call girls in Sabzi Mandi Delhi | 8447779280}Escort Service In All ...Low rate ↬Call girls in Sabzi Mandi Delhi | 8447779280}Escort Service In All ...
Low rate ↬Call girls in Sabzi Mandi Delhi | 8447779280}Escort Service In All ...asmaqueen5
 
Call Girls in Maurice Nagar (Delhi) ꧁8447779280꧂ Female Escorts Service in De...
Call Girls in Maurice Nagar (Delhi) ꧁8447779280꧂ Female Escorts Service in De...Call Girls in Maurice Nagar (Delhi) ꧁8447779280꧂ Female Escorts Service in De...
Call Girls in Maurice Nagar (Delhi) ꧁8447779280꧂ Female Escorts Service in De...asmaqueen5
 
Prestige Sancoale Goa Residneces Brochure.pdf
Prestige Sancoale Goa Residneces Brochure.pdfPrestige Sancoale Goa Residneces Brochure.pdf
Prestige Sancoale Goa Residneces Brochure.pdfkishor21012022
 
Best Interior Design Services in Haldwani
Best Interior Design Services in HaldwaniBest Interior Design Services in Haldwani
Best Interior Design Services in HaldwaniGeomatrix
 
The Gale at Godrej Park World Hinjewadi Pune Brochure.pdf
The Gale at Godrej Park World Hinjewadi Pune Brochure.pdfThe Gale at Godrej Park World Hinjewadi Pune Brochure.pdf
The Gale at Godrej Park World Hinjewadi Pune Brochure.pdfPrachiRudram
 
MEQ Mainstreet Equity Corp Q2 2024 Investor Presentation
MEQ Mainstreet Equity Corp Q2 2024 Investor PresentationMEQ Mainstreet Equity Corp Q2 2024 Investor Presentation
MEQ Mainstreet Equity Corp Q2 2024 Investor PresentationMEQ - Mainstreet Equity Corp.
 
Low Rate Call girls in Sant Nagar{Delhi }8447779280} Service Escorts In South...
Low Rate Call girls in Sant Nagar{Delhi }8447779280} Service Escorts In South...Low Rate Call girls in Sant Nagar{Delhi }8447779280} Service Escorts In South...
Low Rate Call girls in Sant Nagar{Delhi }8447779280} Service Escorts In South...asmaqueen5
 

Kürzlich hochgeladen (20)

Call girls in Shakti Nagar Delhi~8447779280°/=@/ Short 1500 Night 6000}ESCORT...
Call girls in Shakti Nagar Delhi~8447779280°/=@/ Short 1500 Night 6000}ESCORT...Call girls in Shakti Nagar Delhi~8447779280°/=@/ Short 1500 Night 6000}ESCORT...
Call girls in Shakti Nagar Delhi~8447779280°/=@/ Short 1500 Night 6000}ESCORT...
 
Eldeco Dwarka Project In Delhi-brochure.pdf.pdf
Eldeco Dwarka Project In Delhi-brochure.pdf.pdfEldeco Dwarka Project In Delhi-brochure.pdf.pdf
Eldeco Dwarka Project In Delhi-brochure.pdf.pdf
 
Kohinoor Courtyard One Wakad Pune | Elegant Living Spaces
Kohinoor Courtyard One Wakad Pune | Elegant Living SpacesKohinoor Courtyard One Wakad Pune | Elegant Living Spaces
Kohinoor Courtyard One Wakad Pune | Elegant Living Spaces
 
Top tourism places in Dubai - Inch & Brick Realty
Top tourism places in Dubai - Inch & Brick RealtyTop tourism places in Dubai - Inch & Brick Realty
Top tourism places in Dubai - Inch & Brick Realty
 
Rohan Harita Tathawade Pune Brochure.pdf
Rohan Harita Tathawade Pune Brochure.pdfRohan Harita Tathawade Pune Brochure.pdf
Rohan Harita Tathawade Pune Brochure.pdf
 
~Call Girls In Roop Nagar {8447779280}(Low Price) Escort Service In Delhi
~Call Girls In Roop Nagar {8447779280}(Low Price) Escort Service In Delhi~Call Girls In Roop Nagar {8447779280}(Low Price) Escort Service In Delhi
~Call Girls In Roop Nagar {8447779280}(Low Price) Escort Service In Delhi
 
Retail Space for Lease - 1221 W. Main St., Sun Prairie, WI
Retail Space for Lease - 1221 W. Main St., Sun Prairie, WIRetail Space for Lease - 1221 W. Main St., Sun Prairie, WI
Retail Space for Lease - 1221 W. Main St., Sun Prairie, WI
 
Nyati Elite NIBM Road Pune E Brochure.pdf
Nyati Elite NIBM Road Pune E Brochure.pdfNyati Elite NIBM Road Pune E Brochure.pdf
Nyati Elite NIBM Road Pune E Brochure.pdf
 
BPTP THE AMAARIO Luxury Project Invest Like Royalty in Sector 37D Gurgaon Dwa...
BPTP THE AMAARIO Luxury Project Invest Like Royalty in Sector 37D Gurgaon Dwa...BPTP THE AMAARIO Luxury Project Invest Like Royalty in Sector 37D Gurgaon Dwa...
BPTP THE AMAARIO Luxury Project Invest Like Royalty in Sector 37D Gurgaon Dwa...
 
Low Density Living New Project in BPTP THE AMAARIO Sector 37D Gurgaon Haryana...
Low Density Living New Project in BPTP THE AMAARIO Sector 37D Gurgaon Haryana...Low Density Living New Project in BPTP THE AMAARIO Sector 37D Gurgaon Haryana...
Low Density Living New Project in BPTP THE AMAARIO Sector 37D Gurgaon Haryana...
 
ACE Terra Yamuna Expressway | 8929888700
ACE Terra Yamuna Expressway | 8929888700ACE Terra Yamuna Expressway | 8929888700
ACE Terra Yamuna Expressway | 8929888700
 
Kohinoor Teiko Hinjewadi Phase 2 Pune E-Brochure.pdf
Kohinoor Teiko Hinjewadi Phase 2 Pune  E-Brochure.pdfKohinoor Teiko Hinjewadi Phase 2 Pune  E-Brochure.pdf
Kohinoor Teiko Hinjewadi Phase 2 Pune E-Brochure.pdf
 
Low Rate ✨➥9711108085▻✨Call Girls In East Of Kailash (E.K) (Delhi)
Low Rate ✨➥9711108085▻✨Call Girls In East Of Kailash (E.K) (Delhi)Low Rate ✨➥9711108085▻✨Call Girls In East Of Kailash (E.K) (Delhi)
Low Rate ✨➥9711108085▻✨Call Girls In East Of Kailash (E.K) (Delhi)
 
Low rate ↬Call girls in Sabzi Mandi Delhi | 8447779280}Escort Service In All ...
Low rate ↬Call girls in Sabzi Mandi Delhi | 8447779280}Escort Service In All ...Low rate ↬Call girls in Sabzi Mandi Delhi | 8447779280}Escort Service In All ...
Low rate ↬Call girls in Sabzi Mandi Delhi | 8447779280}Escort Service In All ...
 
Call Girls in Maurice Nagar (Delhi) ꧁8447779280꧂ Female Escorts Service in De...
Call Girls in Maurice Nagar (Delhi) ꧁8447779280꧂ Female Escorts Service in De...Call Girls in Maurice Nagar (Delhi) ꧁8447779280꧂ Female Escorts Service in De...
Call Girls in Maurice Nagar (Delhi) ꧁8447779280꧂ Female Escorts Service in De...
 
Prestige Sancoale Goa Residneces Brochure.pdf
Prestige Sancoale Goa Residneces Brochure.pdfPrestige Sancoale Goa Residneces Brochure.pdf
Prestige Sancoale Goa Residneces Brochure.pdf
 
Best Interior Design Services in Haldwani
Best Interior Design Services in HaldwaniBest Interior Design Services in Haldwani
Best Interior Design Services in Haldwani
 
The Gale at Godrej Park World Hinjewadi Pune Brochure.pdf
The Gale at Godrej Park World Hinjewadi Pune Brochure.pdfThe Gale at Godrej Park World Hinjewadi Pune Brochure.pdf
The Gale at Godrej Park World Hinjewadi Pune Brochure.pdf
 
MEQ Mainstreet Equity Corp Q2 2024 Investor Presentation
MEQ Mainstreet Equity Corp Q2 2024 Investor PresentationMEQ Mainstreet Equity Corp Q2 2024 Investor Presentation
MEQ Mainstreet Equity Corp Q2 2024 Investor Presentation
 
Low Rate Call girls in Sant Nagar{Delhi }8447779280} Service Escorts In South...
Low Rate Call girls in Sant Nagar{Delhi }8447779280} Service Escorts In South...Low Rate Call girls in Sant Nagar{Delhi }8447779280} Service Escorts In South...
Low Rate Call girls in Sant Nagar{Delhi }8447779280} Service Escorts In South...
 

Rebgv stats-pkg-october-2019