SlideShare ist ein Scribd-Unternehmen logo
1 von 9
Downloaden Sie, um offline zu lesen
News Release
FOR IMMEDIATE RELEASE:
Home sales increase in July
VANCOUVER, BC – August 2, 2019 – Home buyer demand picked up across Metro
Vancouver* last month, making July, a traditionally quieter month in real estate, the second
highest selling month so far this year.
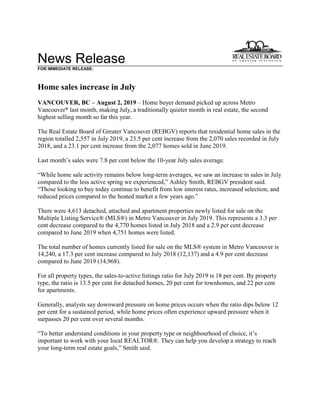
The Real Estate Board of Greater Vancouver (REBGV) reports that residential home sales in the
region totalled 2,557 in July 2019, a 23.5 per cent increase from the 2,070 sales recorded in July
2018, and a 23.1 per cent increase from the 2,077 homes sold in June 2019.
Last month’s sales were 7.8 per cent below the 10-year July sales average.
“While home sale activity remains below long-term averages, we saw an increase in sales in July
compared to the less active spring we experienced,” Ashley Smith, REBGV president said.
“Those looking to buy today continue to benefit from low interest rates, increased selection, and
reduced prices compared to the heated market a few years ago.”
There were 4,613 detached, attached and apartment properties newly listed for sale on the
Multiple Listing Service® (MLS®) in Metro Vancouver in July 2019. This represents a 3.3 per
cent decrease compared to the 4,770 homes listed in July 2018 and a 2.9 per cent decrease
compared to June 2019 when 4,751 homes were listed.
The total number of homes currently listed for sale on the MLS® system in Metro Vancouver is
14,240, a 17.3 per cent increase compared to July 2018 (12,137) and a 4.9 per cent decrease
compared to June 2019 (14,968).
For all property types, the sales-to-active listings ratio for July 2019 is 18 per cent. By property
type, the ratio is 13.5 per cent for detached homes, 20 per cent for townhomes, and 22 per cent
for apartments.
Generally, analysts say downward pressure on home prices occurs when the ratio dips below 12
per cent for a sustained period, while home prices often experience upward pressure when it
surpasses 20 per cent over several months.
“To better understand conditions in your property type or neighbourhood of choice, it’s
important to work with your local REALTOR®. They can help you develop a strategy to reach
your long-term real estate goals,” Smith said.
The MLS® Home Price Index composite benchmark price for all residential properties in Metro
Vancouver is currently $995,200. This represents a 9.4 per cent decrease over July 2018 and a
0.3 per cent decrease compared to June 2019.
Sales of detached homes in July 2019 reached 841, a 32 per cent increase from the 637 detached
sales recorded in July 2018. The benchmark price for detached properties is $1,417,000. This
represents a 10.5 per cent decrease from July 2018, and a 0.5 per cent decrease compared to June
2019.
Sales of apartment homes reached 1,243 in July 2019, a 15.2 per cent increase compared to the
1,079 sales in July 2018. The benchmark price of an apartment property is $653,200. This
represents an 8.8 per cent decrease from July 2018, and a 0.2 per cent decrease compared to June
2019.
Attached home sales in July 2019 totalled 473, a 33.6 per cent increase compared to the 354
sales in July 2018. The benchmark price of an attached unit is $770,000. This represents a nine
per cent decrease from July 2018, and a 0.6 per cent decrease compared to June 2019.
-30-
*Editor’s Note: Areas covered by the Real Estate Board of Greater Vancouver include: Burnaby, Coquitlam, Maple
Ridge, New Westminster, North Vancouver, Pitt Meadows, Port Coquitlam, Port Moody, Richmond, South Delta,
Squamish, Sunshine Coast, Vancouver, West Vancouver, and Whistler.
The real estate industry is a key economic driver in British Columbia. In 2018, 24,619 homes changed ownership in
the Board’s area, generating $1.7 billion in economic spin-off activity and an estimated 11,720 jobs. The total dollar
value of residential sales transacted through the MLS® system in Greater Vancouver totalled $26 billion in 2018.
The Real Estate Board of Greater Vancouver is an association representing more than 14,000 REALTORS® and
their companies. The Board provides a variety of member services, including the Multiple Listing Service®. For
more information on real estate, statistics, and buying or selling a home, contact a local REALTOR® or visit
www.rebgv.org.
For more information please contact:
Mark Moldowan
Senior Writer/Communication Strategist
Real Estate Board of Greater Vancouver
604.730.3153
mmoldowan@rebgv.org
Property Type Area
Benchmark
Price
Price
Index
1 Month
Change %
3 Month
Change %
6 Month
Change %
1 Year
Change %
3 Year
Change %
5 Year
Change %
10 Year
Change %
Residential / Composite Lower Mainland $943,600 259.7 -0.3% -1.4% -1.4% -8.4% 10.1% 61.9% 91.7%
Greater Vancouver $995,200 258.9 -0.3% -1.5% -2.5% -9.4% 5.0% 55.0% 88.6%
Bowen Island $950,600 206.1 -2.6% -4.1% -2.0% -6.7% 19.9% 60.0% 63.2%
Burnaby East $929,800 257.9 -0.5% -2.2% -2.8% -11.0% 6.0% 52.6% 88.2%
Burnaby North $869,000 262.4 -0.4% -0.3% -0.6% -8.9% 10.2% 59.3% 91.7%
Burnaby South $944,900 266.9 -1.3% -3.1% -4.4% -10.9% 7.7% 58.1% 94.8%
Coquitlam $891,000 264.3 0.1% -0.8% -2.3% -9.1% 12.6% 68.6% 103.0%
Ladner $792,100 223.0 -1.1% -1.8% -3.7% -9.7% -5.3% 45.8% 69.1%
Maple Ridge $752,400 239.6 -0.8% -0.4% 0.0% -6.9% 23.3% 76.2% 86.9%
New Westminster $646,700 284.5 -0.8% -1.8% -1.6% -9.8% 24.3% 73.2% 102.5%
North Vancouver $1,028,300 231.1 -0.8% -1.4% -1.2% -9.2% -0.7% 49.4% 77.2%
Pitt Meadows $741,300 269.5 -1.4% -0.1% -2.4% -8.3% 30.4% 83.7% 101.7%
Port Coquitlam $738,800 252.9 -0.6% -0.4% -2.3% -8.1% 17.0% 72.0% 88.6%
Port Moody $913,200 252.4 1.1% 0.9% 0.0% -6.1% 18.6% 70.3% 95.8%
Richmond $902,800 268.4 -0.8% -2.5% -4.4% -11.1% 2.6% 53.3% 91.7%
Squamish $762,800 242.7 -0.4% -1.0% 1.0% -3.6% 20.3% 81.9% 94.5%
Sunshine Coast $601,400 210.7 -0.6% -2.4% -0.5% -3.9% 28.2% 68.8% 64.0%
Tsawwassen $929,200 232.9 -0.3% -1.8% -1.7% -8.8% -6.4% 51.1% 76.3%
Vancouver East $1,034,500 303.7 -0.5% -2.7% -3.0% -9.5% 1.6% 54.9% 105.1%
Vancouver West $1,222,800 254.8 0.6% -1.4% -4.1% -11.0% -4.1% 41.9% 78.9%
West Vancouver $2,124,300 233.9 0.9% -0.5% -1.9% -12.9% -21.3% 27.0% 84.2%
Whistler $893,400 208.2 0.0% 0.3% 1.8% -1.9% 27.4% 78.3% 67.5%
Single Family Detached Lower Mainland $1,219,000 258.5 -0.3% -0.8% -1.3% -8.7% -3.6% 52.6% 96.0%
Greater Vancouver $1,417,000 260.7 -0.5% -0.9% -2.7% -10.5% -10.5% 43.6% 93.5%
Bowen Island $950,600 206.1 -2.6% -4.1% -2.0% -6.7% 19.9% 60.0% 63.2%
Burnaby East $1,181,900 264.3 0.1% 0.7% 1.2% -10.8% -5.5% 49.3% 94.8%
Burnaby North $1,373,400 265.6 -1.9% -1.4% -3.0% -11.7% -14.4% 39.7% 93.7%
Burnaby South $1,477,300 282.8 -1.3% -3.5% -3.7% -12.3% -13.6% 44.6% 108.1%
Coquitlam $1,169,300 259.5 0.3% 1.1% -2.1% -10.7% -4.8% 55.6% 100.2%
Ladner $946,300 228.1 -1.4% -1.6% 0.3% -6.9% -8.4% 49.6% 76.8%
Maple Ridge $823,500 234.6 -0.1% 1.0% 2.4% -6.0% 16.7% 74.0% 89.3%
New Westminster $1,045,900 260.9 -0.5% -0.8% -0.7% -10.4% -4.5% 49.6% 90.9%
North Vancouver $1,488,600 234.4 -2.4% -1.5% -1.6% -9.9% -13.3% 44.8% 82.6%
Pitt Meadows $900,300 253.7 -0.4% 0.4% -0.1% -5.8% 17.3% 74.8% 95.8%
Port Coquitlam $919,200 245.1 -0.5% 0.2% -2.5% -9.6% -0.4% 59.5% 89.3%
Port Moody $1,442,000 266.3 1.0% 5.5% -0.9% -5.7% 3.3% 60.6% 106.0%
Richmond $1,474,800 285.7 -0.7% -3.7% -6.8% -13.3% -16.8% 42.7% 100.5%
Squamish $980,900 258.5 2.8% 1.7% 3.9% 0.4% 18.1% 82.7% 104.7%
Sunshine Coast $596,000 208.8 -0.5% -2.5% -0.7% -4.3% 27.6% 68.4% 62.5%
Tsawwassen $1,172,700 252.5 0.1% -0.7% 1.8% -7.3% -7.6% 58.4% 93.0%
Vancouver East $1,352,800 300.9 0.2% -0.2% -4.6% -11.3% -11.4% 45.5% 115.4%
Vancouver West $2,895,400 296.9 -0.6% -1.8% -5.0% -13.6% -19.2% 27.4% 100.9%
West Vancouver $2,549,700 240.7 -0.6% -1.2% -2.8% -12.5% -24.7% 24.0% 92.4%
Whistler $1,649,100 229.4 4.7% 5.3% 7.2% 7.1% 18.3% 66.6% 78.7%
HOW TO READ THE TABLE:
• Benchmark Price: Estimated sale price of a benchmark property. Benchmarks represent a typical property within each market.
• Price Index: Index numbers estimate the percentage change in price on typical and constant quality properties over time. All figures are based on past sales.
• x Month/Year Change %: Percentage change of index over a period of x month(s)/year(s) *
In January 2005, the indexes are set to 100.
Townhome properties are similar to Attached properties, a category that was used in the previous MLSLink HPI, but do not included duplexes.
The above info is deemed reliable, but is not guaranteed. All dollar amounts in CDN.
July 2019*
* MLS®, Multiple Listing Service®, and all related graphics are trademarks of The Canadian Real Estate Association 1 of 15
Property Type Area
Benchmark
Price
Price
Index
1 Month
Change %
3 Month
Change %
6 Month
Change %
1 Year
Change %
3 Year
Change %
5 Year
Change %
10 Year
Change %
July 2019*
Townhouse Lower Mainland $664,700 239.5 -0.7% -0.4% -1.3% -8.0% 18.6% 63.4% 80.9%
Greater Vancouver $770,000 247.1 -0.6% -0.6% -2.3% -9.0% 14.0% 58.1% 83.4%
Burnaby East $648,400 239.5 0.6% -1.3% -4.7% -11.6% 28.6% 51.3% 76.5%
Burnaby North $723,100 269.9 -0.3% 2.0% -0.1% -7.6% 22.3% 63.2% 90.6%
Burnaby South $760,600 262.0 -0.3% -1.0% -4.1% -10.2% 16.9% 55.3% 88.5%
Coquitlam $653,200 239.7 -0.6% -1.4% -2.8% -8.1% 19.9% 63.4% 85.8%
Ladner $631,200 224.5 -1.1% -2.9% -9.1% -16.3% -0.9% 38.6% 61.4%
Maple Ridge $524,100 243.3 -1.1% -3.4% -2.7% -7.7% 27.3% 75.8% 83.6%
New Westminster $713,900 261.8 -1.1% -2.5% -4.5% -9.3% 14.8% 56.9% 90.7%
North Vancouver $944,100 229.4 -0.3% -0.3% -3.7% -8.6% 5.4% 55.9% 77.0%
Pitt Meadows $599,500 259.4 -1.6% -0.7% -5.5% -11.3% 28.2% 84.0% 95.8%
Port Coquitlam $631,800 239.2 -1.6% 2.7% -0.9% -7.9% 16.2% 66.1% 80.5%
Port Moody $656,900 222.0 0.4% -0.6% 2.0% -4.8% 21.2% 58.7% 70.9%
Richmond $770,900 253.1 -1.1% -0.9% -4.6% -11.4% 7.4% 50.8% 85.8%
Squamish $687,900 226.2 0.5% 1.8% 1.0% -7.2% 20.6% 81.7% 87.3%
Tsawwassen $613,500 241.5 -0.7% -3.9% -9.1% -15.3% 5.8% 47.7% 73.6%
Vancouver East $847,400 271.5 -1.6% -2.4% 0.8% -8.5% 9.7% 49.6% 87.9%
Vancouver West $1,114,700 260.6 -1.0% 0.7% -0.6% -8.8% 5.6% 50.5% 89.7%
Whistler $915,400 220.7 3.9% 2.2% 3.1% -5.6% 29.7% 91.2% 82.7%
Apartment Lower Mainland $641,900 269.9 -0.2% -2.2% -1.6% -8.5% 30.0% 74.7% 91.0%
Greater Vancouver $653,200 261.1 -0.2% -2.1% -2.5% -8.8% 22.9% 67.1% 85.8%
Burnaby East $721,200 276.7 -2.0% -4.5% -3.0% -8.4% 21.4% 63.6% 91.4%
Burnaby North $609,500 260.2 0.3% -0.4% 0.5% -7.8% 32.6% 74.9% 92.5%
Burnaby South $653,500 262.4 -1.9% -3.8% -5.0% -10.7% 22.2% 69.1% 91.5%
Coquitlam $516,400 283.4 0.4% 1.0% 0.2% -5.9% 42.4% 94.2% 115.7%
Ladner $432,800 205.1 0.1% -0.2% -6.6% -8.4% 5.2% 39.1% 51.6%
Maple Ridge $347,800 248.3 -2.1% -0.2% -3.3% -9.8% 46.4% 78.1% 74.9%
New Westminster $515,200 291.9 -0.9% -2.0% -1.8% -10.1% 37.4% 82.2% 105.6%
North Vancouver $554,600 226.2 0.4% -1.6% -0.4% -9.1% 18.9% 54.2% 70.5%
Pitt Meadows $488,700 288.2 -1.9% -0.3% -2.9% -9.9% 45.9% 90.0% 103.0%
Port Coquitlam $446,000 266.7 -0.1% -2.2% -2.8% -7.3% 40.9% 90.0% 89.1%
Port Moody $628,700 262.0 1.4% -0.7% -0.1% -6.7% 36.7% 87.1% 104.7%
Richmond $622,500 266.5 -1.0% -2.6% -2.7% -9.0% 35.3% 70.6% 89.8%
Squamish $478,600 235.9 -6.5% -7.6% -3.6% -5.8% 30.8% 100.1% 88.6%
Tsawwassen $458,400 193.3 -0.4% -2.4% -7.9% -9.0% 6.8% 42.0% 42.9%
Vancouver East $550,600 314.2 -0.6% -4.6% -2.6% -8.0% 21.0% 68.4% 95.6%
Vancouver West $752,300 244.1 1.1% -1.6% -4.0% -9.9% 7.2% 53.8% 72.8%
West Vancouver $1,085,700 220.6 4.9% 1.5% 1.6% -12.2% 12.6% 52.3% 67.2%
Whistler $475,800 186.4 -6.1% -4.4% -2.8% -4.3% 33.5% 81.0% 49.0%
HOW TO READ THE TABLE:
• Benchmark Price: Estimated sale price of a benchmark property. Benchmarks represent a typical property within each market.
• Price Index: Index numbers estimate the percentage change in price on typical and constant quality properties over time. All figures are based on past sales.
• x Month/Year Change %: Percentage change of index over a period of x month(s)/year(s)
In January 2005, the indexes are set to 100. *
Townhome properties are similar to attached properties, a category that was used in the previous MLSLink HPI, but do not included duplexes.
Lower Mainland includes areas serviced by both Real Estate Board of Greater Vancouver & Fraser Valley Real Estate Board.
The above info is deemed reliable, but is not guaranteed. All dollar amounts in CDN.
* MLS®, Multiple Listing Service®, and all related graphics are trademarks of The Canadian Real Estate Association 2 of 15
C:DATAMonthEndHpiexporthi_resgv-hpi2.tifGreaterVancouver
5YearTrend
60
110
160
210
260
310
Jul 2014
Sep 2014
Nov 2014
Jan 2015
Mar 2015
May 2015
Jul 2015
Sep 2015
Nov 2015
Jan 2016
Mar 2016
May 2016
Jul 2016
Sep 2016
Nov 2016
Jan 2017
Mar 2017
May 2017
Jul 2017
Sep 2017
Nov 2017
Jan 2018
Mar 2018
May 2018
Jul 2018
Sep 2018
Nov 2018
Jan 2019
Mar 2019
May 2019
Jul 2019
Price
Index
ResidentialDetachedTownhouseApartment
Jan2005HPI=100
7262019MLS®
SALESFacts
Burnaby
Coquitlam
Delta-South
Islands-Gulf
MapleRidge/PittMeadows
NewWestminster
NorthVancouver
PortCoquitlam
PortMoody/Belcarra
Richmond
Squamish
SunshineCoast
VancouverEast
VancouverWest
WestVancouver/HoweSound
Whistler/Pemberton
Detached77864171001776311185136310479438841
Attached5756160589322516671274258315473
Apartment16494230429596292914711612835213141,243
Detached$1,475,000$1,192,750$978,000n/a$790,000n/a$1,452,500$934,000n/a$1,443,500n/a$620,000$1,355,000$3,025,000$2,050,000n/a
Attached$720,000$768,900n/an/a$515,000n/a$982,500$655,000n/a$750,000n/an/a$1,065,000$1,181,000n/an/an/a
Apartment$569,000$504,000$573,000n/a$335,000$489,900$616,900$429,000$540,000$527,500n/an/a$564,850$750,000n/an/a
Detached608040581268227119017448560308746
Attached5232101444332212621154341513390
Apartment12864180316787281911811587254816941
Detached$1,440,000$1,231,548$989,394n/a$842,800$1,002,500$1,492,550$917,500n/a$1,315,000n/a$636,250$1,444,000$2,850,000$2,703,500n/a
Attached$763,000$784,950n/an/a$539,000n/a$1,009,000$668,500n/a$736,944n/an/a$973,000$1,200,000n/an/an/a
Apartment$540,000$530,000n/an/a$389,900$518,800$618,500$410,000n/a$512,000n/an/a$560,000$710,900n/an/a
Detached4548345792151221277215467583211637
Attached293440388242114571372948622354
Apartment11068140388575412514914113129418161,079
Detached$1,602,500$1,335,000$1,055,000n/a$880,000$1,200,000$1,594,000$987,500n/a$1,599,980$1,087,500$699,110$1,528,000$2,827,500$2,470,000n/a
Attached$786,000$798,750n/an/a$531,942n/a$1,080,000$677,000n/a$875,000n/an/a$933,000$1,366,000n/a$1,064,500n/a
Apartment$613,944$515,000n/an/a$430,750$502,000$674,000$435,000$610,000$584,500n/an/a$608,500$775,000n/an/a
Detached3494151993052411745816683418113276530429233624,402
Attached29823386131552205144763109440251277211042,507
Apartment86448497022150252620115773670496941,712661276,506
Detached$1,420,000$1,198,500$1,005,000$722,500$820,000$1,088,000$1,547,500$915,000$1,225,000$1,450,000$989,000$615,000$1,377,500$2,840,000$2,350,000$1,726,650
Attached$747,500$768,900$679,400n/a$524,900$694,000$1,005,000$653,500$743,500$795,000$641,000$472,000$986,500$1,227,500$1,600,000$980,000n/a
Apartment$575,000$520,000$495,000n/a$355,000$497,500$616,250$415,000$549,000$525,000$435,500$424,900$560,450$740,000$1,075,000$425,000
Detached3914552402665815345321178506120330613449200834,966
Attached3442086412938322015010447310859273307311612,879
Apartment99459811504116246442791791,11497419442,2511201938,604
Detached$1,600,000$1,335,000$1,134,000$457,500$881,750$1,250,000$1,699,000$1,005,000$1,463,500$1,700,000$1,012,450$652,500$1,600,000$3,150,000$2,830,000$2,045,000
Attached$788,900$795,725$717,000n/a$565,000$775,000$1,005,000$700,000$760,000$874,000$688,000$439,900$1,095,000$1,381,000$1,700,000$1,100,000n/a
Apartment$606,000$550,000$535,000n/a$395,000$510,500$666,000$445,000$605,000$585,000$447,000$399,900$619,000$825,000$1,235,000$395,000
Note:MedianSellingPricesarenotreportedforareaswithlessthan20salesorfortheGulfIslands
Number
of
Sales
July
2019
Number
of
Sales
Median
Selling
Price
Number
of
Sales
Median
Selling
Price
Number
of
Sales
Median
Selling
Price
June
2019
July
2018
Jan.-
Jul.2019
Jan.-
Jul.2018
Median
Selling
Price
Number
of
Sales
Median
Selling
Price
July
2019
Year-to-date
Year-to-date
7262019MLS®
LISTINGSFacts
Burnaby
Coquitlam
Delta-South
Islands-Gulf
MapleRidge/PittMeadows
NewWestminster
NorthVancouver
PortCoquitlam
PortMoody/Belcarra
Richmond
Squamish
SunshineCoast
VancouverEast
VancouverWest
WestVancouver/HoweSound
Whistler/Pemberton
Detached1321598191873411647281763191182181105331,592
Attached103932308123574221148221272108926840
Apartment279178240821421896225286161821160238292,181
Detached58%54%51%78%53%50%66%66%39%48%42%69%57%44%41%24%
Attached55%60%70%n/a72%39%56%60%76%45%55%58%58%54%33%58%n/a
Apartment59%53%96%n/a51%67%51%47%116%51%69%33%61%58%34%48%
Detached138175911717636150692921531107196178126181,752
Attached1287322082166748311562626641151529898
Apartment27714034067149192562525517721659835332,101
Detached43%46%44%29%46%72%55%39%38%42%55%41%43%34%24%44%
Attached41%44%45%n/a54%25%49%46%39%40%42%19%67%36%33%45%n/a
Apartment46%46%53%n/a46%45%45%50%76%46%65%71%40%42%23%48%
Detached157195611215339130553122642116197184114231,735
Attached9289222642249612413121971891234792
Apartment27417620098143144664928524826961045322,243
Detached29%25%56%42%52%54%39%40%39%34%50%47%34%32%28%48%
Attached32%38%18%0%59%36%49%34%58%44%62%78%41%54%50%65%n/a
Apartment40%39%70%n/a39%59%52%62%51%52%58%13%49%48%40%50%
Detached1,0681,197607591,2902981,0933742441,5802447091,3771,41697616512,697
Attached78555618555581274943101721,027168102524853972136,176
Apartment1,9751,10022004551,0861,3424582561,9671441201,5724,55928424515,783
Detached33%35%33%51%41%39%42%44%34%26%46%39%38%30%24%38%
Attached38%42%46%20%56%41%41%46%44%30%56%39%48%32%22%49%n/a
Apartment44%44%44%n/a49%46%39%44%61%37%49%41%44%38%23%52%
Detached1,2781,237645821,2423091,2564612301,8013026851,7321,7271,12616314,276
Attached65744811013467139414289172913170905747691052505,580
Apartment1,6911,04519405699361,0324162871,944171561,6474,34226326414,857
Detached31%37%37%32%53%50%36%46%34%28%40%48%35%26%18%51%
Attached52%46%58%8%63%60%53%52%60%52%64%66%48%40%30%64%n/a
Apartment59%57%59%n/a72%67%62%67%62%57%57%73%57%52%46%73%
*Year-to-datelistingsrepresentacumulativetotaloflistingsratherthantotalactivelistings.
%Salesto
Listings
Number
of
Listings
%Salesto
Listings
June
2019
July
2018
Jan.-
Jul.2019
Jan.-
Jul.2018
%Salesto
Listings
Number
of
Listings
%Salesto
Listings
Number
of
Listings
July
2019
Number
of
Listings
%Salesto
Listings
Number
of
Listings
July
2019
Year-to-date*
Year-to-date*
Listing & Sales Activity Summary
Listings Sales
1 2 3 Col. 2 & 3 5 6 7 Col. 6 & 7 9 10 Col. 9 & 10
Jul Jun Jul Percentage Jul Jun Jul Percentage May 2018 - May 2019 - Percentage
2018 2019 2019 Variance 2018 2019 2019 Variance Jul 2018 Jul 2019 Variance
BURNABY % % %
DETACHED 157 138 132 -4.3 45 60 77 28.3 179 204 14.0
ATTACHED 92 128 103 -19.5 29 52 57 9.6 131 167 27.5
APARTMENTS 274 277 279 0.7 110 128 164 28.1 428 446 4.2
COQUITLAM
DETACHED 195 175 159 -9.1 48 80 86 7.5 184 237 28.8
ATTACHED 89 73 93 27.4 34 32 56 75.0 93 123 32.3
APARTMENTS 176 140 178 27.1 68 64 94 46.9 248 256 3.2
DELTA
DETACHED 61 91 81 -11.0 34 40 41 2.5 117 119 1.7
ATTACHED 22 22 23 4.5 4 10 16 60.0 32 42 31.3
APARTMENTS 20 34 24 -29.4 14 18 23 27.8 54 66 22.2
MAPLE RIDGE/PITT MEADOWS
DETACHED 153 176 187 6.3 79 81 100 23.5 263 292 11.0
ATTACHED 64 82 81 -1.2 38 44 58 31.8 115 156 35.7
APARTMENTS 98 67 82 22.4 38 31 42 35.5 156 118 -24.4
NORTH VANCOUVER
DETACHED 130 150 116 -22.7 51 82 76 -7.3 221 263 19.0
ATTACHED 49 67 57 -14.9 24 33 32 -3.0 101 110 8.9
APARTMENTS 144 192 189 -1.6 75 87 96 10.3 264 289 9.5
NEW WESTMINSTER
DETACHED 39 36 34 -5.6 21 26 17 -34.6 73 69 -5.5
ATTACHED 22 16 23 43.8 8 4 9 125.0 30 21 -30.0
APARTMENTS 143 149 142 -4.7 85 67 95 41.8 282 255 -9.6
PORT MOODY/BELCARRA
DETACHED 31 29 28 -3.4 12 11 11 0.0 39 45 15.4
ATTACHED 24 31 21 -32.3 14 12 16 33.3 48 43 -10.4
APARTMENTS 49 25 25 0.0 25 19 29 52.6 75 72 -4.0
PORT COQUITLAM
DETACHED 55 69 47 -31.9 22 27 31 14.8 106 99 -6.6
ATTACHED 61 48 42 -12.5 21 22 25 13.6 66 83 25.8
APARTMENTS 66 56 62 10.7 41 28 29 3.6 123 111 -9.8
RICHMOND
DETACHED 226 215 176 -18.1 77 90 85 -5.6 246 257 4.5
ATTACHED 131 156 148 -5.1 57 62 67 8.1 200 184 -8.0
APARTMENTS 285 255 286 12.2 149 118 147 24.6 498 398 -20.1
SUNSHINE COAST
DETACHED 116 107 91 -15.0 54 44 63 43.2 173 154 -11.0
ATTACHED 9 26 12 -53.8 7 5 7 40.0 29 18 -37.9
APARTMENTS 8 7 18 157.1 1 5 6 20.0 14 20 42.9
SQUAMISH
DETACHED 42 31 31 0.0 21 17 13 -23.5 47 51 8.5
ATTACHED 21 26 22 -15.4 13 11 12 9.1 47 40 -14.9
APARTMENTS 24 17 16 -5.9 14 11 11 0.0 53 34 -35.8
VANCOUVER EAST
DETACHED 197 196 182 -7.1 67 85 104 22.4 305 313 2.6
ATTACHED 71 64 72 12.5 29 43 42 -2.3 114 145 27.2
APARTMENTS 269 216 211 -2.3 131 87 128 47.1 452 357 -21.0
VANCOUVER WEST
DETACHED 184 178 181 1.7 58 60 79 31.7 229 225 -1.7
ATTACHED 89 115 108 -6.1 48 41 58 41.5 153 154 0.7
APARTMENTS 610 598 602 0.7 294 254 352 38.6 977 925 -5.3
WHISTLER/PEMBERTON
DETACHED 23 18 33 83.3 11 8 8 0.0 29 24 -17.2
ATTACHED 34 29 26 -10.3 22 13 15 15.4 74 43 -41.9
APARTMENTS 32 33 29 -12.1 16 16 14 -12.5 75 51 -32.0
WEST VANCOUVER/HOWE SOUND
DETACHED 114 126 105 -16.7 32 30 43 43.3 103 129 25.2
ATTACHED 12 15 9 -40.0 6 5 3 -40.0 16 12 -25.0
APARTMENTS 45 35 38 8.6 18 8 13 62.5 51 32 -37.3
GRAND TOTALS
DETACHED 1723 1735 1583 -8.8 632 741 834 12.6 2314 2481 7.2
ATTACHED 790 898 840 -6.5 354 389 473 21.6 1249 1341 7.4
APARTMENTS 2243 2101 2181 3.8 1079 941 1243 32.1 3750 3430 -8.5
ResidentialAverageSalePrices-January1977toJuly2019
0
200
400
600
800
1000
1200
1400
1600
1800
2000
1977
1978
1979
1980
1981
1982
1983
1984
1985
1986
1987
1988
1989
1990
1991
1992
1993
1994
1995
1996
1997
1998
1999
2000
2001
2002
2003
2004
2005
2006
2007
2008
2009
2010
2011
2012
2013
2014
2015
2016
2017
2018
2019
DETACHEDCONDOMINIUMATTACHEDAPARTMENTS
INTHOUSANDS($)
NOTE:From1977-1984condominiumaverageswerenotseparatedintoattached&apartment.
$851,981
$654,692
$1,491,343

Weitere ähnliche Inhalte

Was ist angesagt?

Was ist angesagt? (20)

Real Estate Board of Greater Vancouver Statistics Package July 2021
Real Estate Board of Greater Vancouver Statistics Package July 2021Real Estate Board of Greater Vancouver Statistics Package July 2021
Real Estate Board of Greater Vancouver Statistics Package July 2021
 
REBGV Statistics Package August 2020
REBGV Statistics Package August 2020REBGV Statistics Package August 2020
REBGV Statistics Package August 2020
 
REBGV Stats Package February 2021
REBGV Stats Package February 2021REBGV Stats Package February 2021
REBGV Stats Package February 2021
 
Rebgv stats-pkg-december-2019
Rebgv stats-pkg-december-2019Rebgv stats-pkg-december-2019
Rebgv stats-pkg-december-2019
 
Metro Vancouver Statistics September 2021
Metro Vancouver Statistics September 2021 Metro Vancouver Statistics September 2021
Metro Vancouver Statistics September 2021
 
Rebgv stats-pkg-february-2019
Rebgv stats-pkg-february-2019Rebgv stats-pkg-february-2019
Rebgv stats-pkg-february-2019
 
REBGV January 2020 Statistics Package
REBGV January 2020 Statistics Package REBGV January 2020 Statistics Package
REBGV January 2020 Statistics Package
 
Real Estate Board of Greater Vancouver Statistics Package March 2021
Real Estate Board of Greater Vancouver Statistics Package March 2021Real Estate Board of Greater Vancouver Statistics Package March 2021
Real Estate Board of Greater Vancouver Statistics Package March 2021
 
REBGV Statistics Package April 2021
REBGV Statistics Package April 2021REBGV Statistics Package April 2021
REBGV Statistics Package April 2021
 
Real Estate Board of Greater Vancouver Statistics Package August 2021
Real Estate Board of Greater Vancouver Statistics Package August 2021Real Estate Board of Greater Vancouver Statistics Package August 2021
Real Estate Board of Greater Vancouver Statistics Package August 2021
 
Rebgv stats-pkg-april-2020
Rebgv stats-pkg-april-2020Rebgv stats-pkg-april-2020
Rebgv stats-pkg-april-2020
 
Rebgv stats-pkg-september-2019
Rebgv stats-pkg-september-2019Rebgv stats-pkg-september-2019
Rebgv stats-pkg-september-2019
 
Rebgv stats-pkg-may-2019
Rebgv stats-pkg-may-2019Rebgv stats-pkg-may-2019
Rebgv stats-pkg-may-2019
 
Rebgv stats-pkg-august-2019
Rebgv stats-pkg-august-2019Rebgv stats-pkg-august-2019
Rebgv stats-pkg-august-2019
 
Real Estate Board of Greater Vancouver Statistics Package November 2020
Real Estate Board of Greater Vancouver Statistics Package November 2020Real Estate Board of Greater Vancouver Statistics Package November 2020
Real Estate Board of Greater Vancouver Statistics Package November 2020
 
REBGV Statistic Package December 2020
REBGV Statistic Package December 2020REBGV Statistic Package December 2020
REBGV Statistic Package December 2020
 
Rebgv Stats Package September 2020
Rebgv Stats Package September 2020Rebgv Stats Package September 2020
Rebgv Stats Package September 2020
 
Real Estate Board of Greater Vancouver Statistics Package October 2021
Real Estate Board of Greater Vancouver Statistics Package October 2021Real Estate Board of Greater Vancouver Statistics Package October 2021
Real Estate Board of Greater Vancouver Statistics Package October 2021
 
REBGV Statistics Package October 2020
REBGV Statistics Package October 2020REBGV Statistics Package October 2020
REBGV Statistics Package October 2020
 
Rebgv stats-pkg-march-2019
Rebgv stats-pkg-march-2019Rebgv stats-pkg-march-2019
Rebgv stats-pkg-march-2019
 

Ähnlich wie Rebgv stats-pkg-july-2019

Ähnlich wie Rebgv stats-pkg-july-2019 (20)

Rebgv stats-pkg-october-2019
Rebgv stats-pkg-october-2019Rebgv stats-pkg-october-2019
Rebgv stats-pkg-october-2019
 
201807 rebgv-stats-package-for-media
201807 rebgv-stats-package-for-media201807 rebgv-stats-package-for-media
201807 rebgv-stats-package-for-media
 
May-2019 Stats Package for Greater Vancouver
May-2019 Stats Package for Greater VancouverMay-2019 Stats Package for Greater Vancouver
May-2019 Stats Package for Greater Vancouver
 
Rebgv stats-pkg-june-2018
Rebgv stats-pkg-june-2018Rebgv stats-pkg-june-2018
Rebgv stats-pkg-june-2018
 
REBGV Statistics package July 2020
REBGV Statistics package July 2020REBGV Statistics package July 2020
REBGV Statistics package July 2020
 
Rebgv stats-pkg-may-2018
Rebgv stats-pkg-may-2018Rebgv stats-pkg-may-2018
Rebgv stats-pkg-may-2018
 
Rebgv stats-pkg-january-2018 2
Rebgv stats-pkg-january-2018 2Rebgv stats-pkg-january-2018 2
Rebgv stats-pkg-january-2018 2
 
Rebgv stats-pkg-august-2018
Rebgv stats-pkg-august-2018Rebgv stats-pkg-august-2018
Rebgv stats-pkg-august-2018
 
August 2017 REBGV Stats Mike Stewart Realtor
August 2017 REBGV Stats Mike Stewart RealtorAugust 2017 REBGV Stats Mike Stewart Realtor
August 2017 REBGV Stats Mike Stewart Realtor
 
Rebgv stats-pkg-october-2020
Rebgv stats-pkg-october-2020Rebgv stats-pkg-october-2020
Rebgv stats-pkg-october-2020
 
Rebgv stats-pkg-march-2019
Rebgv stats-pkg-march-2019Rebgv stats-pkg-march-2019
Rebgv stats-pkg-march-2019
 
Rebgv stats-pkg-september-2018
Rebgv stats-pkg-september-2018Rebgv stats-pkg-september-2018
Rebgv stats-pkg-september-2018
 
Rebgv stats-pkg-april-2018
Rebgv stats-pkg-april-2018Rebgv stats-pkg-april-2018
Rebgv stats-pkg-april-2018
 
Rebgv stats-pkg-february-2019
Rebgv stats-pkg-february-2019Rebgv stats-pkg-february-2019
Rebgv stats-pkg-february-2019
 
July 2017 Real Estate Board of Greater Vancouver Stats Package Mike Stewart r...
July 2017 Real Estate Board of Greater Vancouver Stats Package Mike Stewart r...July 2017 Real Estate Board of Greater Vancouver Stats Package Mike Stewart r...
July 2017 Real Estate Board of Greater Vancouver Stats Package Mike Stewart r...
 
REBGV STATS PACKAGE JULY 2017
REBGV STATS PACKAGE JULY 2017REBGV STATS PACKAGE JULY 2017
REBGV STATS PACKAGE JULY 2017
 
Rebgv stats-pkg-february-2018
Rebgv stats-pkg-february-2018Rebgv stats-pkg-february-2018
Rebgv stats-pkg-february-2018
 
Rebgv stats-pkg-november-2018
Rebgv stats-pkg-november-2018Rebgv stats-pkg-november-2018
Rebgv stats-pkg-november-2018
 
Rebgv stats-pkg-january-2019
Rebgv stats-pkg-january-2019Rebgv stats-pkg-january-2019
Rebgv stats-pkg-january-2019
 
REBGV September 2016 Stats Package Mike Stewart Vancouver Realtor
REBGV September 2016 Stats Package Mike Stewart Vancouver RealtorREBGV September 2016 Stats Package Mike Stewart Vancouver Realtor
REBGV September 2016 Stats Package Mike Stewart Vancouver Realtor
 

Mehr von Vicky Aulakh

Mehr von Vicky Aulakh (20)

Okanagan Statistics May2023.pdf
Okanagan Statistics May2023.pdfOkanagan Statistics May2023.pdf
Okanagan Statistics May2023.pdf
 
FVREB May 2023 Statistics Package.pdf
FVREB May 2023 Statistics Package.pdfFVREB May 2023 Statistics Package.pdf
FVREB May 2023 Statistics Package.pdf
 
Metro Vancouver Stats.pdf
Metro Vancouver Stats.pdfMetro Vancouver Stats.pdf
Metro Vancouver Stats.pdf
 
FVREB July 2022
FVREB July 2022FVREB July 2022
FVREB July 2022
 
REBGV-Stats-Pkg-July-2022
REBGV-Stats-Pkg-July-2022REBGV-Stats-Pkg-July-2022
REBGV-Stats-Pkg-July-2022
 
VREB July 2022
VREB July 2022VREB July 2022
VREB July 2022
 
BCRE June 2022
BCRE June 2022BCRE June 2022
BCRE June 2022
 
Okanagan Stats June 2022
Okanagan Stats June 2022Okanagan Stats June 2022
Okanagan Stats June 2022
 
Okanagan Stats May 2022
Okanagan Stats May 2022Okanagan Stats May 2022
Okanagan Stats May 2022
 
VREB June 2022 Stats
VREB June 2022 StatsVREB June 2022 Stats
VREB June 2022 Stats
 
FVREB June 2022 Stats
FVREB June 2022 StatsFVREB June 2022 Stats
FVREB June 2022 Stats
 
FVREB May 2022
FVREB May 2022FVREB May 2022
FVREB May 2022
 
REBGV Statistics Package May 2022
REBGV Statistics Package May 2022REBGV Statistics Package May 2022
REBGV Statistics Package May 2022
 
VREB May 2022 Statistics Package.pdf
VREB May 2022 Statistics Package.pdfVREB May 2022 Statistics Package.pdf
VREB May 2022 Statistics Package.pdf
 
The Okanagan Real Estate April 2022 Statistics
The Okanagan Real Estate April 2022 StatisticsThe Okanagan Real Estate April 2022 Statistics
The Okanagan Real Estate April 2022 Statistics
 
FVREB April 2022 Stats Package .pdf
FVREB April 2022 Stats Package .pdfFVREB April 2022 Stats Package .pdf
FVREB April 2022 Stats Package .pdf
 
VREB April 2022 Stats Package .pdf
VREB April 2022 Stats Package .pdfVREB April 2022 Stats Package .pdf
VREB April 2022 Stats Package .pdf
 
REBGV-Stats-Pkg-April-2022.pdf
REBGV-Stats-Pkg-April-2022.pdfREBGV-Stats-Pkg-April-2022.pdf
REBGV-Stats-Pkg-April-2022.pdf
 
BCREA.pdf
BCREA.pdfBCREA.pdf
BCREA.pdf
 
March 2022 Okanagan Statistics
March 2022 Okanagan StatisticsMarch 2022 Okanagan Statistics
March 2022 Okanagan Statistics
 

Kürzlich hochgeladen

9990771857 Call Girls in Dwarka Sector 1 Delhi (Call Girls) Delhi
9990771857 Call Girls in Dwarka Sector 1 Delhi (Call Girls) Delhi9990771857 Call Girls in Dwarka Sector 1 Delhi (Call Girls) Delhi
9990771857 Call Girls in Dwarka Sector 1 Delhi (Call Girls) Delhi
delhimodel235
 
9990771857 Call Girls Dwarka Sector 8 Delhi (Call Girls ) Delhi
9990771857 Call Girls  Dwarka Sector 8 Delhi (Call Girls ) Delhi9990771857 Call Girls  Dwarka Sector 8 Delhi (Call Girls ) Delhi
9990771857 Call Girls Dwarka Sector 8 Delhi (Call Girls ) Delhi
delhimodel235
 
9990771857 Call Girls in Dwarka Sector 6 Delhi (Call Girls) Delhi
9990771857 Call Girls in Dwarka Sector 6 Delhi (Call Girls) Delhi9990771857 Call Girls in Dwarka Sector 6 Delhi (Call Girls) Delhi
9990771857 Call Girls in Dwarka Sector 6 Delhi (Call Girls) Delhi
delhimodel235
 
Acibadem Konaklari Uskudar - Listin Turkey
Acibadem Konaklari Uskudar - Listin TurkeyAcibadem Konaklari Uskudar - Listin Turkey
Acibadem Konaklari Uskudar - Listin Turkey
Listing Turkey
 
ACE Terra Yamuna Expressway | 8929888700
ACE Terra Yamuna Expressway | 8929888700ACE Terra Yamuna Expressway | 8929888700
ACE Terra Yamuna Expressway | 8929888700
Truhomes
 
Bptp The Amaario Launch Luxury Project Sector 37D Gurgaon Dwarka Expressway...
Bptp The Amaario Launch  Luxury Project  Sector 37D Gurgaon Dwarka Expressway...Bptp The Amaario Launch  Luxury Project  Sector 37D Gurgaon Dwarka Expressway...
Bptp The Amaario Launch Luxury Project Sector 37D Gurgaon Dwarka Expressway...
ApartmentWala1
 
9990771857 Call Girls in Dwarka Sector 7 Delhi (Call Girls) Delhi
9990771857 Call Girls in Dwarka Sector 7 Delhi (Call Girls) Delhi9990771857 Call Girls in Dwarka Sector 7 Delhi (Call Girls) Delhi
9990771857 Call Girls in Dwarka Sector 7 Delhi (Call Girls) Delhi
delhimodel235
 
BPTP THE AMAARIO Luxury Project Invest Like Royalty in Sector 37D Gurgaon Dwa...
BPTP THE AMAARIO Luxury Project Invest Like Royalty in Sector 37D Gurgaon Dwa...BPTP THE AMAARIO Luxury Project Invest Like Royalty in Sector 37D Gurgaon Dwa...
BPTP THE AMAARIO Luxury Project Invest Like Royalty in Sector 37D Gurgaon Dwa...
ApartmentWala1
 
Call Girls in Anand Vihar Delhi +91 8447779280}Call Girls In Delhi Best in D...
Call Girls in Anand Vihar Delhi +91 8447779280}Call Girls In Delhi Best  in D...Call Girls in Anand Vihar Delhi +91 8447779280}Call Girls In Delhi Best  in D...
Call Girls in Anand Vihar Delhi +91 8447779280}Call Girls In Delhi Best in D...
asmaqueen5
 

Kürzlich hochgeladen (20)

2k Shot Call girls Karol Bagh Delhi 9205541914
2k Shot Call girls Karol Bagh Delhi 92055419142k Shot Call girls Karol Bagh Delhi 9205541914
2k Shot Call girls Karol Bagh Delhi 9205541914
 
Premium Villa Projects in Sarjapur Road Bengaluru
Premium Villa Projects in Sarjapur Road BengaluruPremium Villa Projects in Sarjapur Road Bengaluru
Premium Villa Projects in Sarjapur Road Bengaluru
 
9990771857 Call Girls in Dwarka Sector 1 Delhi (Call Girls) Delhi
9990771857 Call Girls in Dwarka Sector 1 Delhi (Call Girls) Delhi9990771857 Call Girls in Dwarka Sector 1 Delhi (Call Girls) Delhi
9990771857 Call Girls in Dwarka Sector 1 Delhi (Call Girls) Delhi
 
M3M The Line Brochure - Premium Investment Opportunity for Commercial Ventures
M3M The Line Brochure - Premium Investment Opportunity for Commercial VenturesM3M The Line Brochure - Premium Investment Opportunity for Commercial Ventures
M3M The Line Brochure - Premium Investment Opportunity for Commercial Ventures
 
9990771857 Call Girls Dwarka Sector 8 Delhi (Call Girls ) Delhi
9990771857 Call Girls  Dwarka Sector 8 Delhi (Call Girls ) Delhi9990771857 Call Girls  Dwarka Sector 8 Delhi (Call Girls ) Delhi
9990771857 Call Girls Dwarka Sector 8 Delhi (Call Girls ) Delhi
 
9990771857 Call Girls in Dwarka Sector 6 Delhi (Call Girls) Delhi
9990771857 Call Girls in Dwarka Sector 6 Delhi (Call Girls) Delhi9990771857 Call Girls in Dwarka Sector 6 Delhi (Call Girls) Delhi
9990771857 Call Girls in Dwarka Sector 6 Delhi (Call Girls) Delhi
 
Yedi Mavi TOBB Zeytinburnu - Listing Turkey
Yedi Mavi TOBB Zeytinburnu - Listing TurkeyYedi Mavi TOBB Zeytinburnu - Listing Turkey
Yedi Mavi TOBB Zeytinburnu - Listing Turkey
 
Enjoy Night ≽ 8448380779 ≼ Call Girls In Iffco Chowk (Gurgaon)
Enjoy Night ≽ 8448380779 ≼ Call Girls In Iffco Chowk (Gurgaon)Enjoy Night ≽ 8448380779 ≼ Call Girls In Iffco Chowk (Gurgaon)
Enjoy Night ≽ 8448380779 ≼ Call Girls In Iffco Chowk (Gurgaon)
 
Shapoorji Pallonji Joyville Vista Pune | Spend Your Family Time Together
Shapoorji Pallonji Joyville Vista Pune | Spend Your Family Time TogetherShapoorji Pallonji Joyville Vista Pune | Spend Your Family Time Together
Shapoorji Pallonji Joyville Vista Pune | Spend Your Family Time Together
 
Acibadem Konaklari Uskudar - Listin Turkey
Acibadem Konaklari Uskudar - Listin TurkeyAcibadem Konaklari Uskudar - Listin Turkey
Acibadem Konaklari Uskudar - Listin Turkey
 
ACE Terra Yamuna Expressway | 8929888700
ACE Terra Yamuna Expressway | 8929888700ACE Terra Yamuna Expressway | 8929888700
ACE Terra Yamuna Expressway | 8929888700
 
Retail Center For Sale - 1019 River St., Belleville, WI
Retail Center For Sale - 1019 River St., Belleville, WIRetail Center For Sale - 1019 River St., Belleville, WI
Retail Center For Sale - 1019 River St., Belleville, WI
 
Bptp The Amaario Launch Luxury Project Sector 37D Gurgaon Dwarka Expressway...
Bptp The Amaario Launch  Luxury Project  Sector 37D Gurgaon Dwarka Expressway...Bptp The Amaario Launch  Luxury Project  Sector 37D Gurgaon Dwarka Expressway...
Bptp The Amaario Launch Luxury Project Sector 37D Gurgaon Dwarka Expressway...
 
9990771857 Call Girls in Dwarka Sector 7 Delhi (Call Girls) Delhi
9990771857 Call Girls in Dwarka Sector 7 Delhi (Call Girls) Delhi9990771857 Call Girls in Dwarka Sector 7 Delhi (Call Girls) Delhi
9990771857 Call Girls in Dwarka Sector 7 Delhi (Call Girls) Delhi
 
David Litt Foreclosure Specialist - Your Partner in Real Estate Success
David Litt Foreclosure Specialist - Your Partner in Real Estate SuccessDavid Litt Foreclosure Specialist - Your Partner in Real Estate Success
David Litt Foreclosure Specialist - Your Partner in Real Estate Success
 
2k Shot Call girls Aiims Delhi 9205541914
2k Shot Call girls Aiims Delhi 92055419142k Shot Call girls Aiims Delhi 9205541914
2k Shot Call girls Aiims Delhi 9205541914
 
Kohinoor Teiko Hinjewadi Phase 2 Pune E-Brochure.pdf
Kohinoor Teiko Hinjewadi Phase 2 Pune  E-Brochure.pdfKohinoor Teiko Hinjewadi Phase 2 Pune  E-Brochure.pdf
Kohinoor Teiko Hinjewadi Phase 2 Pune E-Brochure.pdf
 
BPTP THE AMAARIO Luxury Project Invest Like Royalty in Sector 37D Gurgaon Dwa...
BPTP THE AMAARIO Luxury Project Invest Like Royalty in Sector 37D Gurgaon Dwa...BPTP THE AMAARIO Luxury Project Invest Like Royalty in Sector 37D Gurgaon Dwa...
BPTP THE AMAARIO Luxury Project Invest Like Royalty in Sector 37D Gurgaon Dwa...
 
Call Girls in Anand Vihar Delhi +91 8447779280}Call Girls In Delhi Best in D...
Call Girls in Anand Vihar Delhi +91 8447779280}Call Girls In Delhi Best  in D...Call Girls in Anand Vihar Delhi +91 8447779280}Call Girls In Delhi Best  in D...
Call Girls in Anand Vihar Delhi +91 8447779280}Call Girls In Delhi Best in D...
 
Kohinoor Hinjewadi Phase 2 Pune E-Brochure.pdf
Kohinoor Hinjewadi Phase 2 Pune  E-Brochure.pdfKohinoor Hinjewadi Phase 2 Pune  E-Brochure.pdf
Kohinoor Hinjewadi Phase 2 Pune E-Brochure.pdf
 

Rebgv stats-pkg-july-2019