SlideShare ist ein Scribd-Unternehmen logo
1 von 9
Downloaden Sie, um offline zu lesen
News Release
FOR IMMEDIATE RELEASE:
Steady demand and low supply benefits home sellers
VANCOUVER, BC – March 3, 2020 – February saw steady home buyer demand and reduced
home seller supply across Metro Vancouver*.
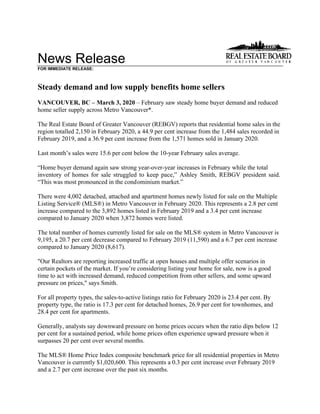
The Real Estate Board of Greater Vancouver (REBGV) reports that residential home sales in the
region totalled 2,150 in February 2020, a 44.9 per cent increase from the 1,484 sales recorded in
February 2019, and a 36.9 per cent increase from the 1,571 homes sold in January 2020.
Last month’s sales were 15.6 per cent below the 10-year February sales average.
“Home buyer demand again saw strong year-over-year increases in February while the total
inventory of homes for sale struggled to keep pace,” Ashley Smith, REBGV president said.
“This was most pronounced in the condominium market.”
There were 4,002 detached, attached and apartment homes newly listed for sale on the Multiple
Listing Service® (MLS®) in Metro Vancouver in February 2020. This represents a 2.8 per cent
increase compared to the 3,892 homes listed in February 2019 and a 3.4 per cent increase
compared to January 2020 when 3,872 homes were listed.
The total number of homes currently listed for sale on the MLS® system in Metro Vancouver is
9,195, a 20.7 per cent decrease compared to February 2019 (11,590) and a 6.7 per cent increase
compared to January 2020 (8,617).
"Our Realtors are reporting increased traffic at open houses and multiple offer scenarios in
certain pockets of the market. If you’re considering listing your home for sale, now is a good
time to act with increased demand, reduced competition from other sellers, and some upward
pressure on prices," says Smith.
For all property types, the sales-to-active listings ratio for February 2020 is 23.4 per cent. By
property type, the ratio is 17.3 per cent for detached homes, 26.9 per cent for townhomes, and
28.4 per cent for apartments.
Generally, analysts say downward pressure on home prices occurs when the ratio dips below 12
per cent for a sustained period, while home prices often experience upward pressure when it
surpasses 20 per cent over several months.
The MLS® Home Price Index composite benchmark price for all residential properties in Metro
Vancouver is currently $1,020,600. This represents a 0.3 per cent increase over February 2019
and a 2.7 per cent increase over the past six months.
Sales of detached homes in February 2020 reached 685, a 52.9 per cent increase from the 448
detached sales recorded in February 2019. The benchmark price for a detached home is
$1,433,900. This represents a 0.7 per cent decrease from February 2019 and a 1.9 per cent
increase over the past six months.
Sales of apartment homes reached 1,061 in February 2020, a 39.8 per cent increase compared to
the 759 sales in February 2019. The benchmark price of an apartment property is $677,200. This
represents a 0.9 per cent increase from February 2019 and a 3.6 per cent increase over the past
six months.
Attached home sales in February 2020 totalled 404, a 45.8 per cent increase compared to the 277
sales in February 2019. The benchmark price of an attached home is $785,000. This represents a
0.6 per cent increase from February 2019 and a 1.7 per cent increase over the past six months.
-30-
*Editor’s Note: Areas covered by the Real Estate Board of Greater Vancouver include: Burnaby, Coquitlam, Maple
Ridge, New Westminster, North Vancouver, Pitt Meadows, Port Coquitlam, Port Moody, Richmond, South Delta,
Squamish, Sunshine Coast, Vancouver, West Vancouver, and Whistler.
The real estate industry is a key economic driver in British Columbia. In 2019, 25,351 homes changed ownership in
the Board’s area, generating $1.8 billion in economic spin-off activity and an estimated 12,910 jobs. The total dollar
value of residential sales transacted through the MLS® system in Greater Vancouver totalled $25.3 billion in 2019.
The Real Estate Board of Greater Vancouver is an association representing approximately 14,000 REALTORS®
and their companies. The Board provides a variety of member services, including the Multiple Listing Service®. For
more information on real estate, statistics, and buying or selling a home, contact a local REALTOR® or visit
www.rebgv.org.
For more information please contact:
Craig Munn
Manager, Communication
Real Estate Board of Greater Vancouver
604.730.3146
cmunn@rebgv.org
Property Type Area
Benchmark
Price
Price
Index
1 Month
Change %
3 Month
Change %
6 Month
Change %
1 Year
Change %
3 Year
Change %
5 Year
Change %
10 Year
Change %
Residential / Composite Lower Mainland $962,500 264.9 1.2% 2.4% 2.2% 0.7% 13.9% 60.4% 80.4%
Greater Vancouver $1,020,600 265.5 1.2% 2.7% 2.7% 0.3% 10.2% 53.8% 76.6%
Bowen Island $906,800 196.6 -1.3% -5.5% -5.0% -8.4% 10.4% 54.3% 47.4%
Burnaby East $943,500 261.7 1.4% 1.5% 3.0% -0.7% 9.6% 50.5% 73.8%
Burnaby North $880,600 265.9 0.8% 2.5% 2.1% 1.9% 10.5% 57.2% 79.3%
Burnaby South $967,600 273.3 1.3% 2.7% 3.0% -2.5% 9.2% 55.1% 82.4%
Coquitlam $910,900 270.2 1.6% 3.1% 2.1% -0.3% 17.8% 66.3% 90.6%
Ladner $794,900 223.8 0.4% 1.5% 1.6% -1.8% 2.6% 40.2% 56.5%
Maple Ridge $756,500 240.9 1.9% 1.6% 0.7% 1.3% 21.7% 74.1% 75.6%
New Westminster $650,800 286.3 1.3% 1.9% 2.2% 0.2% 22.8% 71.5% 88.2%
North Vancouver $1,060,300 238.3 1.4% 3.8% 3.2% 2.3% 7.6% 48.3% 69.6%
Pitt Meadows $742,200 269.8 2.1% 2.4% 0.4% -0.9% 26.5% 78.1% 89.6%
Port Coquitlam $749,900 256.7 0.6% 1.5% 2.9% -0.8% 20.0% 71.1% 76.2%
Port Moody $910,600 251.7 0.8% 1.9% 0.7% 1.6% 18.3% 63.8% 80.7%
Richmond $925,300 275.1 0.9% 2.0% 2.3% -1.2% 7.5% 52.7% 74.2%
Squamish $787,600 250.6 0.9% 1.4% 0.7% 4.7% 21.2% 77.7% 97.3%
Sunshine Coast $561,100 196.6 -1.5% -5.4% -4.9% -7.8% 10.9% 59.8% 49.7%
Tsawwassen $912,800 228.8 -1.0% 0.1% -1.0% -4.7% 0.8% 45.0% 62.5%
Vancouver East $1,085,600 318.7 1.0% 4.0% 5.0% 1.4% 9.3% 56.3% 96.4%
Vancouver West $1,275,600 265.8 1.6% 4.2% 4.0% 0.1% 3.5% 42.4% 69.0%
West Vancouver $2,092,600 230.4 -0.3% -0.1% -0.1% -3.0% -13.2% 21.5% 64.7%
Whistler $923,400 215.2 1.2% 0.6% 0.4% 5.1% 28.9% 81.1% 70.7%
Single Family Detached Lower Mainland $1,234,600 261.8 0.6% 1.6% 1.9% 0.2% 2.9% 48.6% 80.7%
Greater Vancouver $1,433,900 263.8 0.2% 1.3% 1.9% -0.7% -3.1% 38.8% 75.2%
Bowen Island $906,800 196.6 -1.3% -5.5% -5.0% -8.4% 10.4% 54.3% 47.4%
Burnaby East $1,195,800 267.4 1.7% 3.1% 2.6% 2.0% 3.0% 50.6% 78.6%
Burnaby North $1,418,400 274.3 0.1% 2.7% 3.1% 1.3% -5.4% 37.2% 79.8%
Burnaby South $1,477,800 282.9 -1.0% -0.6% 0.7% -4.2% -9.7% 36.7% 90.1%
Coquitlam $1,173,300 260.4 0.3% 1.6% 1.4% -0.8% 4.7% 48.8% 83.0%
Ladner $940,500 226.7 0.4% 2.2% 0.2% 0.8% -0.9% 41.6% 62.6%
Maple Ridge $824,900 235.0 1.9% 2.7% 0.8% 2.2% 16.0% 71.5% 74.9%
New Westminster $1,054,300 263.0 1.0% 3.0% 2.0% -0.5% 2.1% 49.0% 72.5%
North Vancouver $1,546,400 243.5 0.6% 3.3% 4.8% 3.0% -1.9% 42.1% 74.2%
Pitt Meadows $884,700 249.3 0.8% 1.4% -0.8% -1.3% 14.6% 65.1% 78.2%
Port Coquitlam $952,600 254.0 0.4% 2.3% 4.9% 2.6% 10.7% 60.1% 78.6%
Port Moody $1,411,700 260.7 0.9% 1.2% -0.6% 0.5% 5.3% 52.5% 84.2%
Richmond $1,509,900 292.5 0.4% 1.3% 3.5% -2.4% -6.6% 38.3% 76.3%
Squamish $1,001,400 263.9 1.3% 2.2% 0.5% 10.1% 19.4% 78.0% 96.9%
Sunshine Coast $556,900 195.1 -1.4% -5.3% -4.7% -7.8% 10.9% 59.5% 48.6%
Tsawwassen $1,138,300 245.1 -1.6% -0.3% -2.1% -4.5% -1.1% 49.4% 76.0%
Vancouver East $1,407,700 313.1 0.0% 2.2% 4.5% 0.1% -0.8% 42.0% 101.0%
Vancouver West $2,914,000 298.8 -0.5% 0.3% 1.2% -3.9% -14.8% 21.3% 70.5%
West Vancouver $2,544,400 240.2 -0.9% 0.0% 1.0% -2.8% -14.2% 19.6% 71.0%
Whistler $1,680,000 233.7 4.2% 2.8% 2.4% 15.7% 19.1% 63.3% 70.2%
HOW TO READ THE TABLE:
• Benchmark Price: Estimated sale price of a benchmark property. Benchmarks represent a typical property within each market.
• Price Index: Index numbers estimate the percentage change in price on typical and constant quality properties over time. All figures are based on past sales.
• x Month/Year Change %: Percentage change of index over a period of x month(s)/year(s) *
In January 2005, the indexes are set to 100.
Townhome properties are similar to Attached properties, a category that was used in the previous MLSLink HPI, but do not included duplexes.
The above info is deemed reliable, but is not guaranteed. All dollar amounts in CDN.
February 2020*
* MLS®, Multiple Listing Service®, and all related graphics are trademarks of The Canadian Real Estate Association 1 of 16
Property Type Area
Benchmark
Price
Price
Index
1 Month
Change %
3 Month
Change %
6 Month
Change %
1 Year
Change %
3 Year
Change %
5 Year
Change %
10 Year
Change %
February 2020*
Townhouse Lower Mainland $672,800 242.4 0.6% 1.6% 1.0% 0.9% 18.0% 62.2% 70.5%
Greater Vancouver $785,000 251.9 0.3% 1.6% 1.7% 0.6% 14.6% 57.6% 71.4%
Burnaby East $660,000 243.8 0.8% 0.2% 2.4% -3.9% 21.0% 50.8% 62.6%
Burnaby North $727,700 271.6 1.0% -0.1% 0.9% 1.7% 20.0% 57.1% 80.2%
Burnaby South $773,400 266.4 0.7% 0.5% 0.8% -4.2% 16.8% 54.6% 76.8%
Coquitlam $671,500 246.4 1.0% 4.2% 3.0% 2.3% 18.5% 61.5% 76.8%
Ladner $648,900 230.8 0.1% 0.3% 5.0% -5.0% 5.0% 39.5% 49.6%
Maple Ridge $523,900 243.2 0.3% -1.0% 0.2% -0.2% 23.4% 73.0% 72.7%
New Westminster $743,800 272.8 1.5% 1.1% 4.3% -1.0% 22.3% 59.5% 77.4%
North Vancouver $951,100 231.1 0.4% 1.5% -0.9% -0.6% 8.9% 51.4% 65.2%
Pitt Meadows $613,100 265.3 2.4% 4.0% 2.3% -0.4% 27.7% 86.4% 87.9%
Port Coquitlam $621,000 235.1 0.0% 0.5% -1.1% 0.0% 14.6% 63.6% 60.9%
Port Moody $629,100 212.6 0.3% 1.7% -4.1% -1.3% 21.8% 43.4% 52.2%
Richmond $784,000 257.4 1.1% 2.3% 1.2% -1.5% 8.2% 50.6% 69.1%
Squamish $727,800 239.3 -0.8% 2.7% 3.1% 7.2% 21.2% 80.9% 93.5%
Tsawwassen $628,800 247.5 -0.4% 2.2% 5.2% -4.5% 8.5% 48.9% 60.3%
Vancouver East $903,900 289.6 0.0% 5.0% 7.9% 3.6% 13.4% 61.0% 85.4%
Vancouver West $1,131,400 264.5 -1.4% -0.2% 1.5% 0.6% 6.1% 52.4% 74.6%
Whistler $950,200 229.1 -2.2% 1.0% 1.3% 7.5% 26.9% 87.9% 84.3%
Apartment Lower Mainland $660,700 277.8 1.9% 3.5% 2.9% 1.1% 27.7% 76.9% 83.6%
Greater Vancouver $677,200 270.7 2.1% 4.0% 3.6% 0.9% 23.2% 69.8% 78.8%
Burnaby East $733,800 281.5 2.7% 2.2% 4.7% 2.1% 21.3% 56.0% 77.7%
Burnaby North $613,200 261.8 1.0% 2.9% 1.9% 2.2% 22.5% 77.3% 80.6%
Burnaby South $678,200 272.3 2.5% 4.8% 4.6% -1.6% 20.8% 69.1% 80.9%
Coquitlam $539,000 295.8 3.3% 4.0% 2.8% 3.0% 38.1% 99.6% 107.9%
Ladner $435,100 206.2 1.1% 2.0% 1.9% -2.3% 14.4% 37.1% 43.6%
Maple Ridge $355,900 254.1 3.9% 2.5% 1.2% 0.6% 39.9% 77.6% 75.4%
New Westminster $517,000 292.9 1.4% 1.8% 2.1% 0.4% 29.7% 80.0% 93.0%
North Vancouver $572,000 233.3 2.5% 4.9% 2.9% 2.3% 20.9% 57.7% 64.8%
Pitt Meadows $494,300 291.5 3.0% 2.5% 0.8% -0.6% 37.4% 84.8% 97.2%
Port Coquitlam $455,000 272.1 1.1% 1.6% 3.8% -3.1% 33.6% 88.8% 81.3%
Port Moody $647,200 269.7 1.0% 2.8% 4.0% 4.0% 29.9% 88.9% 96.0%
Richmond $640,700 274.3 1.0% 2.2% 2.2% -0.2% 26.9% 75.8% 76.9%
Squamish $487,100 240.1 1.7% -2.0% -2.8% -6.9% 27.4% 90.9% 102.1%
Tsawwassen $461,000 194.4 0.8% 1.1% 1.1% -3.3% 14.2% 41.1% 34.5%
Vancouver East $579,800 330.9 2.0% 5.1% 5.0% 2.0% 21.0% 74.2% 90.4%
Vancouver West $796,100 258.3 2.6% 6.1% 5.3% 1.5% 14.8% 57.6% 69.9%
West Vancouver $1,013,900 206.0 1.7% -0.9% -4.5% -4.8% 0.1% 43.9% 50.8%
Whistler $494,200 193.6 2.5% -1.0% -1.9% -2.5% 38.5% 95.8% 61.9%
HOW TO READ THE TABLE:
• Benchmark Price: Estimated sale price of a benchmark property. Benchmarks represent a typical property within each market.
• Price Index: Index numbers estimate the percentage change in price on typical and constant quality properties over time. All figures are based on past sales.
• x Month/Year Change %: Percentage change of index over a period of x month(s)/year(s)
In January 2005, the indexes are set to 100. *
Townhome properties are similar to attached properties, a category that was used in the previous MLSLink HPI, but do not included duplexes.
Lower Mainland includes areas serviced by both Real Estate Board of Greater Vancouver & Fraser Valley Real Estate Board.
The above info is deemed reliable, but is not guaranteed. All dollar amounts in CDN.
* MLS®, Multiple Listing Service®, and all related graphics are trademarks of The Canadian Real Estate Association 2 of 16
C:DATAMonthEndHpiexporthi_resgv-hpi2.tifGreaterVancouver
5YearTrend
60
110
160
210
260
310
Feb 2015
Apr 2015
Jun 2015
Aug 2015
Oct 2015
Dec 2015
Feb 2016
Apr 2016
Jun 2016
Aug 2016
Oct 2016
Dec 2016
Feb 2017
Apr 2017
Jun 2017
Aug 2017
Oct 2017
Dec 2017
Feb 2018
Apr 2018
Jun 2018
Aug 2018
Oct 2018
Dec 2018
Feb 2019
Apr 2019
Jun 2019
Aug 2019
Oct 2019
Dec 2019
Feb 2020
Price
Index
ResidentialDetachedTownhouseApartment
Jan2005HPI=100
2272020MLS®
SALESFacts
Burnaby
Coquitlam
Delta-South
Islands-Gulf
MapleRidge/PittMeadows
NewWestminster
NorthVancouver
PortCoquitlam
PortMoody/Belcarra
Richmond
Squamish
SunshineCoast
VancouverEast
VancouverWest
WestVancouver/HoweSound
Whistler/Pemberton
Detached546737398207125952153186624510685
Attached474113060735188591623843314404
Apartment1348718038639840191361681182617181,061
Detached$1,452,500$1,238,000$1,035,000n/a$913,805$1,192,500$1,640,000$950,000n/a$1,725,000n/a$586,500$1,422,500$2,980,000$2,310,700n/a
Attached$796,944$898,900n/an/a$554,950n/a$1,090,000n/an/a$862,000n/an/a$1,093,700$1,160,000n/an/an/a
Apartment$607,000$527,500n/an/a$377,450$507,000$655,000$440,000n/a$576,450n/an/a$640,000$760,000n/an/a
Detached4141234677242295212215335217439
Attached373213236413151263643030219318
Apartment12471200323863231610111378210618814
Detached$1,374,000$1,305,000$969,100n/a$849,000n/a$1,698,334$870,500n/a$1,604,000n/a$654,628$1,500,000$3,230,000$2,510,000n/a
Attached$780,000$762,450n/an/a$529,490n/an/an/an/a$795,000n/an/a$1,030,000$1,517,000n/an/an/a
Apartment$589,000$501,900$597,000n/a$400,000$520,000$572,200$429,000n/a$555,000n/an/a$547,450$755,000n/an/a
Detached3038188571337171036163654432510448
Attached2931803372716529187312439277
Apartment1246514023425921158956811861118759
Detached$1,489,150$1,195,000n/an/a$812,500n/a$1,470,000n/an/a$1,500,000n/a$582,000$1,269,400$2,700,000$2,043,800n/a
Attached$740,000$910,999n/an/a$549,900n/a$1,028,000n/an/a$803,000n/an/a$1,015,000$1,099,000n/an/an/a
Apartment$557,500$478,000n/an/a$368,000$482,500$648,000$410,000n/a$541,000n/an/a$576,000$764,000n/an/a
Detached951086071652795471810427521399766171,124
Attached847326296114833201222266873533722
Apartment258158380701011616335237271119647113361,875
Detached$1,430,000$1,280,000$1,016,500n/a$879,980$1,150,000$1,645,500$915,000n/a$1,650,000$1,075,000$613,738$1,469,250$3,000,000$2,317,850n/a
Attached$795,000$810,000$684,350n/a$547,400n/a$1,084,000$678,300$778,250$826,500$669,950n/a$1,053,750$1,489,000n/a$1,100,000n/a
Apartment$596,500$512,500$547,500n/a$384,900$515,000$623,500$440,000$569,000$565,000$449,000n/a$602,500$757,500n/a$526,500
Detached56653411962372301866245598774319787
Attached534915066174225105426124444421482
Apartment2041072004397100373315513812931918351,318
Detached$1,453,000$1,108,000$972,500n/a$798,500$1,170,000$1,552,500$867,500n/a$1,500,000$1,040,000$582,000$1,280,000$2,712,500$2,250,000n/a
Attached$728,000$769,000n/an/a$526,000n/a$1,026,500$607,500n/a$803,000$615,000n/a$984,950$1,210,000n/a$1,049,000n/a
Apartment$557,500$496,500$475,500n/a$355,000$495,000$588,000$398,500$593,150$528,000n/an/a$579,000$763,000n/a$400,000
Note:MedianSellingPricesarenotreportedforareaswithlessthan20salesorfortheGulfIslands
Number
of
Sales
February
2020
Number
of
Sales
Median
Selling
Price
Number
of
Sales
Median
Selling
Price
Number
of
Sales
Median
Selling
Price
January
2020
February
2019
Jan.-
Feb.2020
Jan.-
Feb.2019
Median
Selling
Price
Number
of
Sales
Median
Selling
Price
February
2020
Year-to-date
Year-to-date
2272020MLS®
LISTINGSFacts
Burnaby
Coquitlam
Delta-South
Islands-Gulf
MapleRidge/PittMeadows
NewWestminster
NorthVancouver
PortCoquitlam
PortMoody/Belcarra
Richmond
Squamish
SunshineCoast
VancouverEast
VancouverWest
WestVancouver/HoweSound
Whistler/Pemberton
Detached971016731542912438321443677157131100251,315
Attached784819110315543625113231670861125723
Apartment240177341721081884942243181521049230451,964
Detached56%66%55%100%64%69%57%66%28%36%42%40%55%47%45%40%
Attached60%85%68%0%58%47%65%50%32%52%70%13%54%50%27%56%n/a
Apartment56%49%53%0%53%58%52%82%45%56%89%53%56%53%23%40%
Detached1231177061302813137241682849120144136231,334
Attached8061283711960351110916106392731696
Apartment2501245115588175552824224317150031441,842
Detached33%35%33%67%52%25%18%59%38%31%43%43%44%24%15%30%
Attached46%52%46%67%51%21%22%43%109%58%38%40%48%33%29%61%n/a
Apartment50%57%39%0%58%43%36%42%57%42%46%100%46%42%19%41%
Detached1151226121332712047291603974153188113151,398
Attached696426061155234168725862941430657
Apartment215102180471201555831226101216860040351,837
Detached26%31%30%400%43%48%31%36%34%23%41%49%35%23%22%67%
Attached42%48%31%n/a54%47%52%47%31%33%72%88%50%26%21%30%n/a
Apartment58%64%78%n/a49%35%38%36%48%39%50%50%48%31%28%51%
Detached220218137928457255755631264126277275236482,649
Attached158109474174341147136222392613317818561,419
Apartment49030185212719636310470485421838199261893,806
Detached43%50%44%78%58%47%37%63%32%33%42%41%50%35%28%35%
Attached53%67%55%50%55%32%42%46%56%55%56%23%51%41%28%59%n/a
Apartment53%52%45%0%55%52%44%61%50%49%64%61%51%47%21%40%
Detached257283140628669291896346270141348423273443,245
Attached192131510121321296529246482312920928661,499
Apartment5002444401122543341216651527283621,21394823,996
Detached22%23%24%183%34%33%25%34%29%14%34%39%28%18%16%43%
Attached28%37%29%n/a55%53%33%38%34%22%54%52%34%21%14%32%n/a
Apartment41%44%45%n/a38%38%30%31%50%30%48%29%36%26%19%43%
*Year-to-datelistingsrepresentacumulativetotaloflistingsratherthantotalactivelistings.
%Salesto
Listings
Number
of
Listings
%Salesto
Listings
January
2020
February
2019
Jan.-
Feb.2020
Jan.-
Feb.2019
%Salesto
Listings
Number
of
Listings
%Salesto
Listings
Number
of
Listings
February
2020
Number
of
Listings
%Salesto
Listings
Number
of
Listings
February
2020
Year-to-date*
Year-to-date*
Listing & Sales Activity Summary
Listings Sales
1 2 3 Col. 2 & 3 5 6 7 Col. 6 & 7 9 10 Col. 9 & 10
Feb Jan Feb Percentage Feb Jan Feb Percentage Dec 2018 - Dec 2019 - Percentage
2019 2020 2020 Variance 2019 2020 2020 Variance Feb 2019 Feb 2020 Variance
BURNABY % % %
DETACHED 115 123 97 -21.1 30 41 54 31.7 86 145 68.6
ATTACHED 69 80 78 -2.5 29 37 47 27.0 65 143 120.0
APARTMENTS 215 250 240 -4.0 124 124 134 8.1 280 418 49.3
COQUITLAM
DETACHED 122 117 101 -13.7 38 41 67 63.4 92 159 72.8
ATTACHED 64 61 48 -21.3 31 32 41 28.1 69 110 59.4
APARTMENTS 102 124 177 42.7 65 71 87 22.5 149 262 75.8
DELTA
DETACHED 61 70 67 -4.3 18 23 37 60.9 53 79 49.1
ATTACHED 26 28 19 -32.1 8 13 13 0.0 23 32 39.1
APARTMENTS 18 51 34 -33.3 14 20 18 -10.0 28 59 110.7
MAPLE RIDGE/PITT MEADOWS
DETACHED 133 130 154 18.5 57 67 98 46.3 147 245 66.7
ATTACHED 61 71 103 45.1 33 36 60 66.7 75 125 66.7
APARTMENTS 47 55 72 30.9 23 32 38 18.8 66 113 71.2
NORTH VANCOUVER
DETACHED 120 131 124 -5.3 37 24 71 195.8 113 151 33.6
ATTACHED 52 60 54 -10.0 27 13 35 169.2 66 73 10.6
APARTMENTS 155 175 188 7.4 59 63 98 55.6 134 235 75.4
NEW WESTMINSTER
DETACHED 27 28 29 3.6 13 7 20 185.7 36 38 5.6
ATTACHED 15 19 15 -21.1 7 4 7 75.0 23 20 -13.0
APARTMENTS 120 88 108 22.7 42 38 63 65.8 136 157 15.4
PORT MOODY/BELCARRA
DETACHED 29 24 32 33.3 10 9 9 0.0 24 26 8.3
ATTACHED 16 11 25 127.3 5 12 8 -33.3 20 35 75.0
APARTMENTS 31 28 42 50.0 15 16 19 18.8 46 48 4.3
PORT COQUITLAM
DETACHED 47 37 38 2.7 17 22 25 13.6 48 71 47.9
ATTACHED 34 35 36 2.9 16 15 18 20.0 40 56 40.0
APARTMENTS 58 55 49 -10.9 21 23 40 73.9 55 97 76.4
RICHMOND
DETACHED 160 168 144 -14.3 36 52 52 0.0 95 190 100.0
ATTACHED 87 109 113 3.7 29 63 59 -6.3 82 175 113.4
APARTMENTS 226 242 243 0.4 89 101 136 34.7 219 379 73.1
SUNSHINE COAST
DETACHED 74 49 77 57.1 36 21 31 47.6 69 84 21.7
ATTACHED 8 10 16 60.0 7 4 2 -50.0 16 9 -43.8
APARTMENTS 12 3 15 400.0 6 3 8 166.7 11 15 36.4
SQUAMISH
DETACHED 39 28 36 28.6 16 12 15 25.0 31 40 29.0
ATTACHED 25 16 23 43.8 18 6 16 166.7 30 33 10.0
APARTMENTS 10 24 18 -25.0 5 11 16 45.5 16 39 143.8
VANCOUVER EAST
DETACHED 153 120 157 30.8 54 53 86 62.3 140 213 52.1
ATTACHED 62 63 70 11.1 31 30 38 26.7 62 103 66.1
APARTMENTS 168 171 210 22.8 81 78 118 51.3 182 294 61.5
VANCOUVER WEST
DETACHED 188 144 131 -9.0 43 35 62 77.1 110 156 41.8
ATTACHED 94 92 86 -6.5 24 30 43 43.3 62 110 77.4
APARTMENTS 600 500 492 -1.6 186 210 261 24.3 458 731 59.6
WHISTLER/PEMBERTON
DETACHED 15 23 25 8.7 10 7 10 42.9 21 21 0.0
ATTACHED 30 31 25 -19.4 9 19 14 -26.3 29 48 65.5
APARTMENTS 35 44 45 2.3 18 18 18 0.0 45 57 26.7
WEST VANCOUVER/HOWE SOUND
DETACHED 113 136 100 -26.5 25 21 45 114.3 58 94 62.1
ATTACHED 14 7 11 57.1 3 2 3 50.0 9 12 33.3
APARTMENTS 40 31 30 -3.2 11 6 7 16.7 28 24 -14.3
GRAND TOTALS
DETACHED 1396 1328 1312 -1.2 440 435 682 56.8 1123 1712 52.4
ATTACHED 657 693 722 4.2 277 316 404 27.8 671 1084 61.5
APARTMENTS 1837 1841 1963 6.6 759 814 1061 30.3 1853 2928 58.0
ResidentialAverageSalePrices-January1977toFebruary2020
0
200
400
600
800
1000
1200
1400
1600
1800
2000
1977
1978
1979
1980
1981
1982
1983
1984
1985
1986
1987
1988
1989
1990
1991
1992
1993
1994
1995
1996
1997
1998
1999
2000
2001
2002
2003
2004
2005
2006
2007
2008
2009
2010
2011
2012
2013
2014
2015
2016
2017
2018
2019
2020
DETACHEDCONDOMINIUMATTACHEDAPARTMENTS
INTHOUSANDS($)
NOTE:From1977-1984condominiumaverageswerenotseparatedintoattached&apartment.
$893,353
$666,699
$1,600,467

Weitere ähnliche Inhalte

Was ist angesagt?

Was ist angesagt? (20)

Rebgv stats-pkg-april-2019
Rebgv stats-pkg-april-2019Rebgv stats-pkg-april-2019
Rebgv stats-pkg-april-2019
 
REBGV Statistics package July 2020
REBGV Statistics package July 2020REBGV Statistics package July 2020
REBGV Statistics package July 2020
 
REBGV Statistics Package October 2020
REBGV Statistics Package October 2020REBGV Statistics Package October 2020
REBGV Statistics Package October 2020
 
Rebgv stats-pkg-february-2019
Rebgv stats-pkg-february-2019Rebgv stats-pkg-february-2019
Rebgv stats-pkg-february-2019
 
Metro Vancouver Statistics September 2021
Metro Vancouver Statistics September 2021 Metro Vancouver Statistics September 2021
Metro Vancouver Statistics September 2021
 
Real Estate Board of Greater Vancouver Statistics Package November 2020
Real Estate Board of Greater Vancouver Statistics Package November 2020Real Estate Board of Greater Vancouver Statistics Package November 2020
Real Estate Board of Greater Vancouver Statistics Package November 2020
 
Rebgv stats-pkg-june-2019
Rebgv stats-pkg-june-2019Rebgv stats-pkg-june-2019
Rebgv stats-pkg-june-2019
 
REBGV Stats Package February 2021
REBGV Stats Package February 2021REBGV Stats Package February 2021
REBGV Stats Package February 2021
 
Rebgv stats-pkg-november-2019-f
Rebgv stats-pkg-november-2019-fRebgv stats-pkg-november-2019-f
Rebgv stats-pkg-november-2019-f
 
Rebgv stats-pkg-march-2019
Rebgv stats-pkg-march-2019Rebgv stats-pkg-march-2019
Rebgv stats-pkg-march-2019
 
Real Estate Board of Greater Vancouver Statistics Package March 2021
Real Estate Board of Greater Vancouver Statistics Package March 2021Real Estate Board of Greater Vancouver Statistics Package March 2021
Real Estate Board of Greater Vancouver Statistics Package March 2021
 
Rebgv stats-pkg-may-2019
Rebgv stats-pkg-may-2019Rebgv stats-pkg-may-2019
Rebgv stats-pkg-may-2019
 
Rebgv stats-pkg-august-2019
Rebgv stats-pkg-august-2019Rebgv stats-pkg-august-2019
Rebgv stats-pkg-august-2019
 
Real Estate Board of Greater Vancouver Statistics Package - November 2021
Real Estate Board of Greater Vancouver Statistics Package - November 2021Real Estate Board of Greater Vancouver Statistics Package - November 2021
Real Estate Board of Greater Vancouver Statistics Package - November 2021
 
Rebgv stats-pkg-december-2019
Rebgv stats-pkg-december-2019Rebgv stats-pkg-december-2019
Rebgv stats-pkg-december-2019
 
Rebgv Stats Package September 2020
Rebgv Stats Package September 2020Rebgv Stats Package September 2020
Rebgv Stats Package September 2020
 
Rebgv stats-pkg-may-2021
Rebgv stats-pkg-may-2021Rebgv stats-pkg-may-2021
Rebgv stats-pkg-may-2021
 
REBGV January 2020 Statistics Package
REBGV January 2020 Statistics Package REBGV January 2020 Statistics Package
REBGV January 2020 Statistics Package
 
Real Estate Board of Greater Vancouver Statistics Package August 2021
Real Estate Board of Greater Vancouver Statistics Package August 2021Real Estate Board of Greater Vancouver Statistics Package August 2021
Real Estate Board of Greater Vancouver Statistics Package August 2021
 
REBGV Statistic Package December 2020
REBGV Statistic Package December 2020REBGV Statistic Package December 2020
REBGV Statistic Package December 2020
 

Ähnlich wie Rebgv stats-pkg-february-2020

Ähnlich wie Rebgv stats-pkg-february-2020 (20)

Real Estate Board of Greater Vancouver Statistics Package January 2021
Real Estate Board of Greater Vancouver Statistics Package January 2021 Real Estate Board of Greater Vancouver Statistics Package January 2021
Real Estate Board of Greater Vancouver Statistics Package January 2021
 
March 2017 Rebgv Stats Package Mike Stewart
March 2017 Rebgv Stats Package Mike StewartMarch 2017 Rebgv Stats Package Mike Stewart
March 2017 Rebgv Stats Package Mike Stewart
 
Rebgv stats-pkg-april-2018
Rebgv stats-pkg-april-2018Rebgv stats-pkg-april-2018
Rebgv stats-pkg-april-2018
 
Rebgv stats-pkg-january-2018 2
Rebgv stats-pkg-january-2018 2Rebgv stats-pkg-january-2018 2
Rebgv stats-pkg-january-2018 2
 
Rebgv stats-pkg-october-2020
Rebgv stats-pkg-october-2020Rebgv stats-pkg-october-2020
Rebgv stats-pkg-october-2020
 
Rebgv stats-pkg-september-2019
Rebgv stats-pkg-september-2019Rebgv stats-pkg-september-2019
Rebgv stats-pkg-september-2019
 
May-2019 Stats Package for Greater Vancouver
May-2019 Stats Package for Greater VancouverMay-2019 Stats Package for Greater Vancouver
May-2019 Stats Package for Greater Vancouver
 
Rebgv stats-pkg-august-2018
Rebgv stats-pkg-august-2018Rebgv stats-pkg-august-2018
Rebgv stats-pkg-august-2018
 
Rebgv stats-pkg-june-2018
Rebgv stats-pkg-june-2018Rebgv stats-pkg-june-2018
Rebgv stats-pkg-june-2018
 
Real Estate Board of Greater Vancouver Statistics Package October 2021
Real Estate Board of Greater Vancouver Statistics Package October 2021Real Estate Board of Greater Vancouver Statistics Package October 2021
Real Estate Board of Greater Vancouver Statistics Package October 2021
 
REBGV September 2016 Stats Package Mike Stewart Vancouver Realtor
REBGV September 2016 Stats Package Mike Stewart Vancouver RealtorREBGV September 2016 Stats Package Mike Stewart Vancouver Realtor
REBGV September 2016 Stats Package Mike Stewart Vancouver Realtor
 
Real Estate Board of Greater Vancouver - Stats Package May 2021
Real Estate Board of Greater Vancouver - Stats Package May 2021Real Estate Board of Greater Vancouver - Stats Package May 2021
Real Estate Board of Greater Vancouver - Stats Package May 2021
 
REBGV-Stats-Pkg-July-2022
REBGV-Stats-Pkg-July-2022REBGV-Stats-Pkg-July-2022
REBGV-Stats-Pkg-July-2022
 
REBGV Statistics Package May 2022
REBGV Statistics Package May 2022REBGV Statistics Package May 2022
REBGV Statistics Package May 2022
 
February 2017 REBGV Statistics Package Mike Stewart Realtor
February 2017 REBGV Statistics Package Mike Stewart RealtorFebruary 2017 REBGV Statistics Package Mike Stewart Realtor
February 2017 REBGV Statistics Package Mike Stewart Realtor
 
Rebgv stats-pkg-october-2019
Rebgv stats-pkg-october-2019Rebgv stats-pkg-october-2019
Rebgv stats-pkg-october-2019
 
201807 rebgv-stats-package-for-media
201807 rebgv-stats-package-for-media201807 rebgv-stats-package-for-media
201807 rebgv-stats-package-for-media
 
Rebgv stats-pkg-may-2018
Rebgv stats-pkg-may-2018Rebgv stats-pkg-may-2018
Rebgv stats-pkg-may-2018
 
Rebgv stats-pkg-march-2019
Rebgv stats-pkg-march-2019Rebgv stats-pkg-march-2019
Rebgv stats-pkg-march-2019
 
Rebgv stats-pkg-november-2020
Rebgv stats-pkg-november-2020Rebgv stats-pkg-november-2020
Rebgv stats-pkg-november-2020
 

Mehr von Vicky Aulakh

Mehr von Vicky Aulakh (20)

Okanagan Statistics May2023.pdf
Okanagan Statistics May2023.pdfOkanagan Statistics May2023.pdf
Okanagan Statistics May2023.pdf
 
FVREB May 2023 Statistics Package.pdf
FVREB May 2023 Statistics Package.pdfFVREB May 2023 Statistics Package.pdf
FVREB May 2023 Statistics Package.pdf
 
Metro Vancouver Stats.pdf
Metro Vancouver Stats.pdfMetro Vancouver Stats.pdf
Metro Vancouver Stats.pdf
 
FVREB July 2022
FVREB July 2022FVREB July 2022
FVREB July 2022
 
VREB July 2022
VREB July 2022VREB July 2022
VREB July 2022
 
BCRE June 2022
BCRE June 2022BCRE June 2022
BCRE June 2022
 
Okanagan Stats June 2022
Okanagan Stats June 2022Okanagan Stats June 2022
Okanagan Stats June 2022
 
Okanagan Stats May 2022
Okanagan Stats May 2022Okanagan Stats May 2022
Okanagan Stats May 2022
 
VREB June 2022 Stats
VREB June 2022 StatsVREB June 2022 Stats
VREB June 2022 Stats
 
FVREB June 2022 Stats
FVREB June 2022 StatsFVREB June 2022 Stats
FVREB June 2022 Stats
 
FVREB May 2022
FVREB May 2022FVREB May 2022
FVREB May 2022
 
VREB May 2022 Statistics Package.pdf
VREB May 2022 Statistics Package.pdfVREB May 2022 Statistics Package.pdf
VREB May 2022 Statistics Package.pdf
 
The Okanagan Real Estate April 2022 Statistics
The Okanagan Real Estate April 2022 StatisticsThe Okanagan Real Estate April 2022 Statistics
The Okanagan Real Estate April 2022 Statistics
 
FVREB April 2022 Stats Package .pdf
FVREB April 2022 Stats Package .pdfFVREB April 2022 Stats Package .pdf
FVREB April 2022 Stats Package .pdf
 
VREB April 2022 Stats Package .pdf
VREB April 2022 Stats Package .pdfVREB April 2022 Stats Package .pdf
VREB April 2022 Stats Package .pdf
 
REBGV-Stats-Pkg-April-2022.pdf
REBGV-Stats-Pkg-April-2022.pdfREBGV-Stats-Pkg-April-2022.pdf
REBGV-Stats-Pkg-April-2022.pdf
 
BCREA.pdf
BCREA.pdfBCREA.pdf
BCREA.pdf
 
March 2022 Okanagan Statistics
March 2022 Okanagan StatisticsMarch 2022 Okanagan Statistics
March 2022 Okanagan Statistics
 
FVREB Statistics Package March 2022
FVREB Statistics Package March 2022FVREB Statistics Package March 2022
FVREB Statistics Package March 2022
 
February 2022 Okanagan Real Estate Board Statistics Package With Charts & Graphs
February 2022 Okanagan Real Estate Board Statistics Package With Charts & GraphsFebruary 2022 Okanagan Real Estate Board Statistics Package With Charts & Graphs
February 2022 Okanagan Real Estate Board Statistics Package With Charts & Graphs
 

Kürzlich hochgeladen

Low rate ↬Call girls in Sabzi Mandi Delhi | 8447779280}Escort Service In All ...
Low rate ↬Call girls in Sabzi Mandi Delhi | 8447779280}Escort Service In All ...Low rate ↬Call girls in Sabzi Mandi Delhi | 8447779280}Escort Service In All ...
Low rate ↬Call girls in Sabzi Mandi Delhi | 8447779280}Escort Service In All ...
asmaqueen5
 
Cheap Rate ✨➥9582086666▻✨Call Girls In Gurgaon Sector 1 (Gurgaon)
Cheap Rate ✨➥9582086666▻✨Call Girls In Gurgaon Sector 1 (Gurgaon)Cheap Rate ✨➥9582086666▻✨Call Girls In Gurgaon Sector 1 (Gurgaon)
Cheap Rate ✨➥9582086666▻✨Call Girls In Gurgaon Sector 1 (Gurgaon)
delhi24hrs1
 
ACE Terra Yamuna Expressway | 8929888700
ACE Terra Yamuna Expressway | 8929888700ACE Terra Yamuna Expressway | 8929888700
ACE Terra Yamuna Expressway | 8929888700
Truhomes
 
Low Rate ✨➥9711108085▻✨Call Girls In East Of Kailash (E.K) (Delhi)
Low Rate ✨➥9711108085▻✨Call Girls In East Of Kailash (E.K) (Delhi)Low Rate ✨➥9711108085▻✨Call Girls In East Of Kailash (E.K) (Delhi)
Low Rate ✨➥9711108085▻✨Call Girls In East Of Kailash (E.K) (Delhi)
delhi24hrs1
 
Call Girls in Maurice Nagar (Delhi) ꧁8447779280꧂ Female Escorts Service in De...
Call Girls in Maurice Nagar (Delhi) ꧁8447779280꧂ Female Escorts Service in De...Call Girls in Maurice Nagar (Delhi) ꧁8447779280꧂ Female Escorts Service in De...
Call Girls in Maurice Nagar (Delhi) ꧁8447779280꧂ Female Escorts Service in De...
asmaqueen5
 
MEQ Mainstreet Equity Corp Q2 2024 Investor Presentation
MEQ Mainstreet Equity Corp Q2 2024 Investor PresentationMEQ Mainstreet Equity Corp Q2 2024 Investor Presentation
MEQ Mainstreet Equity Corp Q2 2024 Investor Presentation
MEQ - Mainstreet Equity Corp.
 
Low Rate Call girls in Sant Nagar{Delhi }8447779280} Service Escorts In South...
Low Rate Call girls in Sant Nagar{Delhi }8447779280} Service Escorts In South...Low Rate Call girls in Sant Nagar{Delhi }8447779280} Service Escorts In South...
Low Rate Call girls in Sant Nagar{Delhi }8447779280} Service Escorts In South...
asmaqueen5
 
Call girls in Shakti Nagar Delhi~8447779280°/=@/ Short 1500 Night 6000}ESCORT...
Call girls in Shakti Nagar Delhi~8447779280°/=@/ Short 1500 Night 6000}ESCORT...Call girls in Shakti Nagar Delhi~8447779280°/=@/ Short 1500 Night 6000}ESCORT...
Call girls in Shakti Nagar Delhi~8447779280°/=@/ Short 1500 Night 6000}ESCORT...
asmaqueen5
 
Acibadem Konaklari Uskudar - Listin Turkey
Acibadem Konaklari Uskudar - Listin TurkeyAcibadem Konaklari Uskudar - Listin Turkey
Acibadem Konaklari Uskudar - Listin Turkey
Listing Turkey
 

Kürzlich hochgeladen (20)

Low rate ↬Call girls in Sabzi Mandi Delhi | 8447779280}Escort Service In All ...
Low rate ↬Call girls in Sabzi Mandi Delhi | 8447779280}Escort Service In All ...Low rate ↬Call girls in Sabzi Mandi Delhi | 8447779280}Escort Service In All ...
Low rate ↬Call girls in Sabzi Mandi Delhi | 8447779280}Escort Service In All ...
 
Cheap Rate ✨➥9582086666▻✨Call Girls In Gurgaon Sector 1 (Gurgaon)
Cheap Rate ✨➥9582086666▻✨Call Girls In Gurgaon Sector 1 (Gurgaon)Cheap Rate ✨➥9582086666▻✨Call Girls In Gurgaon Sector 1 (Gurgaon)
Cheap Rate ✨➥9582086666▻✨Call Girls In Gurgaon Sector 1 (Gurgaon)
 
Best Interior Design Services in Haldwani
Best Interior Design Services in HaldwaniBest Interior Design Services in Haldwani
Best Interior Design Services in Haldwani
 
Ganga Platinum Kharadi Pune brochure.pdf
Ganga Platinum Kharadi Pune brochure.pdfGanga Platinum Kharadi Pune brochure.pdf
Ganga Platinum Kharadi Pune brochure.pdf
 
ACE Terra Yamuna Expressway | 8929888700
ACE Terra Yamuna Expressway | 8929888700ACE Terra Yamuna Expressway | 8929888700
ACE Terra Yamuna Expressway | 8929888700
 
Kalpataru Exquisite Wakad Pune E-Brochure.pdf
Kalpataru Exquisite Wakad Pune  E-Brochure.pdfKalpataru Exquisite Wakad Pune  E-Brochure.pdf
Kalpataru Exquisite Wakad Pune E-Brochure.pdf
 
Low Rate ✨➥9711108085▻✨Call Girls In East Of Kailash (E.K) (Delhi)
Low Rate ✨➥9711108085▻✨Call Girls In East Of Kailash (E.K) (Delhi)Low Rate ✨➥9711108085▻✨Call Girls In East Of Kailash (E.K) (Delhi)
Low Rate ✨➥9711108085▻✨Call Girls In East Of Kailash (E.K) (Delhi)
 
Retail Space for Lease - 1221 W. Main St., Sun Prairie, WI
Retail Space for Lease - 1221 W. Main St., Sun Prairie, WIRetail Space for Lease - 1221 W. Main St., Sun Prairie, WI
Retail Space for Lease - 1221 W. Main St., Sun Prairie, WI
 
Parksville 96 Surrey Floor Plans May 2024
Parksville 96 Surrey Floor Plans May 2024Parksville 96 Surrey Floor Plans May 2024
Parksville 96 Surrey Floor Plans May 2024
 
Kohinoor Teiko Hinjewadi Phase 2 Pune E-Brochure.pdf
Kohinoor Teiko Hinjewadi Phase 2 Pune  E-Brochure.pdfKohinoor Teiko Hinjewadi Phase 2 Pune  E-Brochure.pdf
Kohinoor Teiko Hinjewadi Phase 2 Pune E-Brochure.pdf
 
Rohan Harita Tathawade Pune Brochure.pdf
Rohan Harita Tathawade Pune Brochure.pdfRohan Harita Tathawade Pune Brochure.pdf
Rohan Harita Tathawade Pune Brochure.pdf
 
SVN Live 5.6.24 Weekly Property Broadcast
SVN Live 5.6.24 Weekly Property BroadcastSVN Live 5.6.24 Weekly Property Broadcast
SVN Live 5.6.24 Weekly Property Broadcast
 
Call Girls in Maurice Nagar (Delhi) ꧁8447779280꧂ Female Escorts Service in De...
Call Girls in Maurice Nagar (Delhi) ꧁8447779280꧂ Female Escorts Service in De...Call Girls in Maurice Nagar (Delhi) ꧁8447779280꧂ Female Escorts Service in De...
Call Girls in Maurice Nagar (Delhi) ꧁8447779280꧂ Female Escorts Service in De...
 
MEQ Mainstreet Equity Corp Q2 2024 Investor Presentation
MEQ Mainstreet Equity Corp Q2 2024 Investor PresentationMEQ Mainstreet Equity Corp Q2 2024 Investor Presentation
MEQ Mainstreet Equity Corp Q2 2024 Investor Presentation
 
Low Rate Call girls in Sant Nagar{Delhi }8447779280} Service Escorts In South...
Low Rate Call girls in Sant Nagar{Delhi }8447779280} Service Escorts In South...Low Rate Call girls in Sant Nagar{Delhi }8447779280} Service Escorts In South...
Low Rate Call girls in Sant Nagar{Delhi }8447779280} Service Escorts In South...
 
Real Estate Finance and Investments (2019).pdf
Real Estate Finance and Investments (2019).pdfReal Estate Finance and Investments (2019).pdf
Real Estate Finance and Investments (2019).pdf
 
Call girls in Shakti Nagar Delhi~8447779280°/=@/ Short 1500 Night 6000}ESCORT...
Call girls in Shakti Nagar Delhi~8447779280°/=@/ Short 1500 Night 6000}ESCORT...Call girls in Shakti Nagar Delhi~8447779280°/=@/ Short 1500 Night 6000}ESCORT...
Call girls in Shakti Nagar Delhi~8447779280°/=@/ Short 1500 Night 6000}ESCORT...
 
Acibadem Konaklari Uskudar - Listin Turkey
Acibadem Konaklari Uskudar - Listin TurkeyAcibadem Konaklari Uskudar - Listin Turkey
Acibadem Konaklari Uskudar - Listin Turkey
 
Yedi Mavi TOBB Zeytinburnu - Listing Turkey
Yedi Mavi TOBB Zeytinburnu - Listing TurkeyYedi Mavi TOBB Zeytinburnu - Listing Turkey
Yedi Mavi TOBB Zeytinburnu - Listing Turkey
 
Bridge & Elliot Ladner Floor Plans May 2024.pdf
Bridge & Elliot Ladner Floor Plans May 2024.pdfBridge & Elliot Ladner Floor Plans May 2024.pdf
Bridge & Elliot Ladner Floor Plans May 2024.pdf
 

Rebgv stats-pkg-february-2020