
Empfohlen
Weitere ähnliche Inhalte
Was ist angesagt?
Was ist angesagt? (20)
Ähnlich wie Rebgv stats-pkg-april-2020
Ähnlich wie Rebgv stats-pkg-april-2020 (18)
Mehr von Vicky Aulakh
Mehr von Vicky Aulakh (20)
Kürzlich hochgeladen
Kürzlich hochgeladen (20)
Rebgv stats-pkg-april-2020
- 1. News Release FOR IMMEDIATE RELEASE: Home sales and listings down amid COVID-19, new tools and practices emerge to help buyers and sellers adapt VANCOUVER, BC – May 4, 2020 – While Metro Vancouver* home sale and listing activity remains limited by the COVID-19 situation, REALTORS® across the region are fast adopting new tools and practices to help advise and serve their clients in a responsible way. The Real Estate Board of Greater Vancouver (REBGV) reports that residential home sales in the region totalled 1,109 in April 2020, a 39.4 per cent decrease from the 1,829 sales recorded in April 2019, and a 56.1 per cent decrease from the 2,524 homes sold in March 2020. Last month’s sales were 62.7 per cent below the 10-year April sales average and was the lowest total for the month since 1982. “Predictably, the number of home sales and listings declined in April given the physical distancing measures in place,” Colette Gerber, REBGV’s president-elect said. “People are, however, adapting. They’re working with their Realtors to get information, advice and to explore their options so that they’re best positioned in the market during and after this pandemic.” Realtors have been named an essential service by the provincial government to help the home buying and selling community meet their housing needs during the pandemic. “We’re seeing more innovation in today’s market, with Realtors using different technology to showcase homes virtually, assess neighbourhood amenities with their clients and handle paperwork electronically,” Gerber said. There were 2,313 detached, attached and apartment properties newly listed for sale on the Multiple Listing Service® (MLS®) in Metro Vancouver in April. This represents a 59.7 per cent decrease compared to the 5,742 homes listed in April 2019 and a 47.9 per cent decrease compared to March 2020 when 4,436 homes were listed. The total number of homes currently listed for sale on the MLS® system in Metro Vancouver is 9,389, a 34.6 per cent decrease compared to April 2019 (14,357) and a 2.3 per cent decrease compared to March 2020 (9,606). For all property types, the sales-to-active listings ratio for April 2020 is 11.8 per cent. By property type, the ratio is 10 per cent for detached homes, 14.7 per cent for townhomes, and 12.4 per cent for apartments.
- 2. Generally, analysts say downward pressure on home prices occurs when the ratio dips below 12 per cent for a sustained period, while home prices often experience upward pressure when it surpasses 20 per cent over several months. The MLS® Home Price Index composite benchmark price for all residential properties in Metro Vancouver is currently $1,036,000. This represents a 2.5 per cent increase over April 2019 and a 0.2 per cent increase compared to March 2020. “Home prices have held relatively steady in our region since the COVID-19 situation worsened in March,” Gerber said. Sales of detached homes in April 2020 reached 388, a 33.8 per cent decrease from the 586 detached sales recorded in April 2019. The benchmark price for detached properties is $1,462,100. This represents a 2.3 per cent increase from April 2019 and a 0.8 per cent increase compared to March 2020. Sales of apartment homes reached 503 in April 2020, a 43.2 per cent decrease compared to the 885 sales in April 2019. The benchmark price of an apartment property is $685,500. This represents a 2.7 per cent increase from April 2019 and a 0.2 per cent decrease compared to March 2020. Attached home sales in April 2020 totalled 218, a 39.1 per cent decrease compared to the 358 sales in April 2019. The benchmark price of an attached home is $796,800. This represents a 2.8 per cent increase from April 2019 and a 0.6 per cent increase compared to March 2020. -30- *Editor’s Note: Areas covered by the Real Estate Board of Greater Vancouver include: Burnaby, Coquitlam, Maple Ridge, New Westminster, North Vancouver, Pitt Meadows, Port Coquitlam, Port Moody, Richmond, South Delta, Squamish, Sunshine Coast, Vancouver, West Vancouver, and Whistler. The real estate industry is a key economic driver in British Columbia. In 2019, 25,351 homes changed ownership in the Board’s area, generating $1.8 billion in economic spin-off activity and an estimated 12,910 jobs. The total dollar value of residential sales transacted through the MLS® system in Greater Vancouver totalled $25.3 billion in 2019. The Real Estate Board of Greater Vancouver is an association representing about 13,700 REALTORS® and their companies. The Board provides a variety of member services, including the Multiple Listing Service®. For more information on real estate, statistics, and buying or selling a home, contact a local REALTOR® or visit www.rebgv.org. For more information please contact: Craig Munn Manager, Communication Real Estate Board of Greater Vancouver 604.730.3146 cmunn@rebgv.org
- 3. Property Type Area Benchmark Price Price Index 1 Month Change % 3 Month Change % 6 Month Change % 1 Year Change % 3 Year Change % 5 Year Change % 10 Year Change % Residential / Composite Lower Mainland $979,000 270.2 0.3% 2.9% 4.2% 2.3% 11.2% 58.6% 81.0% Greater Vancouver $1,036,000 269.5 0.2% 2.7% 4.3% 2.5% 7.2% 50.7% 75.9% Bowen Island $934,000 202.5 0.8% 1.7% -4.1% -5.8% 6.4% 56.9% 49.6% Burnaby East $956,200 265.2 -1.0% 2.8% 3.7% 0.6% 6.2% 46.0% 73.1% Burnaby North $893,900 269.9 0.6% 2.4% 5.1% 2.5% 8.3% 54.9% 79.8% Burnaby South $967,900 273.4 0.1% 1.4% 3.2% -0.7% 5.5% 51.2% 79.4% Coquitlam $927,800 275.2 0.8% 3.5% 5.0% 3.3% 13.0% 62.8% 92.2% Ladner $816,300 229.8 1.6% 3.1% 4.9% 1.1% 2.3% 35.7% 58.7% Maple Ridge $776,000 247.1 1.1% 4.5% 4.0% 2.7% 20.0% 75.5% 78.5% New Westminster $662,900 291.6 0.1% 3.2% 4.0% 0.7% 19.1% 71.0% 87.2% North Vancouver $1,066,600 239.7 -0.6% 2.0% 4.6% 2.2% 3.7% 42.3% 65.7% Pitt Meadows $762,000 277.0 2.1% 4.8% 3.7% 2.7% 24.9% 77.0% 92.9% Port Coquitlam $772,100 264.3 1.1% 3.6% 6.1% 4.1% 16.6% 69.5% 80.2% Port Moody $937,000 259.0 0.5% 3.7% 4.7% 3.5% 16.0% 64.2% 84.2% Richmond $941,800 280.0 0.1% 2.7% 3.5% 1.7% 5.6% 50.7% 73.6% Squamish $777,600 247.4 -1.0% -0.4% -0.9% 0.9% 13.7% 72.3% 87.3% Sunshine Coast $581,100 203.6 1.2% 2.0% -3.8% -5.7% 8.3% 61.2% 51.6% Tsawwassen $926,000 232.1 0.2% 0.4% 1.9% -2.2% -2.2% 37.6% 62.0% Vancouver East $1,102,600 323.7 0.6% 2.6% 6.2% 3.7% 5.3% 52.4% 96.4% Vancouver West $1,291,900 269.2 -0.3% 2.9% 5.3% 4.1% 1.1% 38.8% 67.5% West Vancouver $2,108,000 232.1 0.0% 0.4% 0.6% -1.2% -14.0% 16.1% 60.1% Whistler $910,500 212.2 -0.3% -0.2% -0.7% 2.2% 20.2% 74.4% 62.0% Single Family Detached Lower Mainland $1,260,500 267.3 0.6% 2.7% 3.9% 2.6% 1.6% 45.8% 80.2% Greater Vancouver $1,462,100 269.0 0.8% 2.2% 3.7% 2.3% -4.4% 34.9% 73.7% Bowen Island $934,500 202.6 0.9% 1.8% -4.0% -5.7% 6.4% 56.9% 49.6% Burnaby East $1,220,400 272.9 -0.4% 3.8% 5.8% 4.0% 1.7% 41.7% 78.0% Burnaby North $1,470,100 284.3 1.2% 3.8% 7.6% 5.6% -3.8% 34.7% 83.7% Burnaby South $1,502,400 287.6 0.6% 0.6% 2.0% -1.9% -7.9% 29.8% 85.5% Coquitlam $1,214,300 269.5 2.0% 3.8% 5.5% 5.0% 2.0% 46.9% 86.1% Ladner $967,800 233.3 1.5% 3.3% 5.6% 0.6% 0.0% 34.5% 65.5% Maple Ridge $844,500 240.6 1.1% 4.3% 5.0% 3.6% 15.2% 72.7% 78.4% New Westminster $1,082,400 270.0 0.3% 3.7% 6.4% 2.7% 0.3% 43.0% 72.3% North Vancouver $1,545,100 243.3 -0.4% 0.5% 5.4% 2.2% -5.4% 33.8% 69.3% Pitt Meadows $928,000 261.5 3.4% 5.7% 5.2% 3.5% 16.6% 69.4% 85.1% Port Coquitlam $981,100 261.6 2.2% 3.4% 7.3% 7.0% 5.8% 55.3% 81.2% Port Moody $1,443,600 266.6 1.6% 3.1% 3.5% 5.7% 5.1% 50.3% 84.9% Richmond $1,530,500 296.5 0.5% 1.8% 1.9% 0.0% -7.7% 33.8% 71.8% Squamish $992,700 261.6 -0.4% 0.5% 0.6% 2.9% 10.1% 74.4% 89.6% Sunshine Coast $576,600 202.0 1.3% 2.1% -3.6% -5.7% 8.3% 60.8% 50.4% Tsawwassen $1,164,800 250.8 0.7% 0.6% 3.0% -1.4% -3.2% 40.8% 76.2% Vancouver East $1,430,100 318.1 0.3% 1.6% 5.1% 5.5% -3.4% 36.5% 99.7% Vancouver West $2,975,400 305.1 1.1% 1.6% 2.2% 0.9% -14.8% 19.6% 66.0% West Vancouver $2,570,900 242.7 0.7% 0.2% 1.9% -0.4% -15.0% 14.5% 69.0% Whistler $1,644,100 228.7 -1.5% 2.0% -0.9% 5.0% 9.6% 62.3% 61.2% HOW TO READ THE TABLE: • Benchmark Price: Estimated sale price of a benchmark property. Benchmarks represent a typical property within each market. • Price Index: Index numbers estimate the percentage change in price on typical and constant quality properties over time. All figures are based on past sales. • x Month/Year Change %: Percentage change of index over a period of x month(s)/year(s) * In January 2005, the indexes are set to 100. Townhome properties are similar to Attached properties, a category that was used in the previous MLSLink HPI, but do not included duplexes. The above info is deemed reliable, but is not guaranteed. All dollar amounts in CDN. April 2020* * MLS®, Multiple Listing Service®, and all related graphics are trademarks of The Canadian Real Estate Association 1 of 17
- 4. Property Type Area Benchmark Price Price Index 1 Month Change % 3 Month Change % 6 Month Change % 1 Year Change % 3 Year Change % 5 Year Change % 10 Year Change % April 2020* Townhouse Lower Mainland $687,200 249.4 0.6% 2.0% 2.7% 2.1% 14.4% 63.0% 72.5% Greater Vancouver $796,800 255.7 0.6% 1.8% 3.3% 2.8% 11.3% 56.6% 70.6% Burnaby East $657,000 242.7 -0.2% 0.3% 0.6% 0.0% 12.5% 49.8% 63.0% Burnaby North $727,100 271.4 -0.1% 0.9% 0.4% 2.5% 12.0% 55.4% 74.9% Burnaby South $780,000 268.7 1.5% 1.5% 0.4% 1.5% 10.7% 54.2% 73.5% Coquitlam $675,800 248.0 -0.6% 1.6% 4.2% 2.0% 11.8% 60.8% 77.7% Ladner $680,400 242.0 3.5% 5.0% 7.6% 4.6% 4.9% 40.9% 55.6% Maple Ridge $544,800 252.9 1.8% 4.3% 3.0% 0.4% 21.1% 76.5% 77.0% New Westminster $759,700 278.6 1.4% 3.6% 4.8% 3.8% 15.7% 62.4% 81.4% North Vancouver $986,100 239.6 2.0% 4.1% 5.3% 4.1% 8.3% 54.0% 65.8% Pitt Meadows $627,700 271.6 2.9% 4.9% 5.0% 4.0% 26.0% 78.2% 90.1% Port Coquitlam $652,400 247.0 1.4% 5.1% 4.9% 6.0% 14.9% 65.8% 71.9% Port Moody $645,300 218.1 0.9% 2.9% 4.1% -2.4% 18.0% 48.6% 55.1% Richmond $802,300 263.4 0.9% 3.5% 3.7% 3.1% 8.0% 52.5% 68.6% Squamish $697,000 229.2 -4.1% -5.0% -1.2% 3.1% 17.7% 67.5% 85.0% Tsawwassen $649,600 255.7 3.0% 2.9% 6.9% 1.7% 6.4% 51.2% 65.9% Vancouver East $909,300 291.3 1.8% 0.6% 6.6% 4.7% 6.8% 55.6% 80.6% Vancouver West $1,131,800 264.6 -0.2% -1.3% 1.7% 2.2% 1.4% 45.3% 68.4% Whistler $910,400 219.5 -3.6% -6.3% -1.4% 1.7% 23.2% 76.3% 76.3% Apartment Lower Mainland $670,900 282.1 -0.1% 3.5% 4.9% 2.2% 22.7% 75.7% 84.6% Greater Vancouver $685,500 274.0 -0.2% 3.4% 5.1% 2.7% 18.1% 67.8% 79.1% Burnaby East $750,400 287.9 -2.4% 5.0% 5.5% -0.6% 15.4% 55.9% 76.8% Burnaby North $619,100 264.3 0.4% 2.0% 4.9% 1.2% 18.1% 76.4% 81.3% Burnaby South $673,700 270.5 -0.2% 1.8% 4.4% -0.8% 13.1% 68.2% 80.0% Coquitlam $542,800 297.9 0.2% 4.0% 5.0% 6.1% 30.4% 92.7% 108.9% Ladner $430,200 203.9 -0.7% 0.0% -0.3% -0.8% 8.7% 33.6% 38.3% Maple Ridge $360,900 257.7 0.4% 5.4% 3.0% 3.5% 34.0% 78.0% 74.0% New Westminster $525,800 297.9 -0.1% 3.1% 3.5% 0.0% 25.4% 82.2% 91.2% North Vancouver $572,500 233.5 -1.8% 2.5% 3.3% 1.6% 14.5% 52.0% 60.3% Pitt Meadows $501,300 295.6 0.9% 4.5% 2.2% 2.2% 32.1% 82.6% 98.8% Port Coquitlam $463,900 277.4 0.3% 3.0% 6.0% 1.7% 29.6% 90.8% 82.6% Port Moody $670,900 279.6 -0.1% 4.7% 6.4% 6.0% 26.3% 88.7% 102.0% Richmond $652,600 279.4 -0.4% 2.9% 4.3% 2.1% 21.9% 75.4% 80.0% Squamish $495,400 244.2 1.9% 3.5% -3.1% -4.4% 20.4% 88.0% 89.0% Tsawwassen $457,200 192.8 -1.4% 0.0% -1.2% -2.6% 8.1% 37.4% 32.5% Vancouver East $589,300 336.3 0.6% 3.6% 6.8% 2.1% 15.3% 74.5% 93.1% Vancouver West $805,900 261.5 -0.6% 3.9% 6.9% 5.4% 11.0% 53.7% 70.5% West Vancouver $995,200 202.2 -3.2% -0.1% -5.1% -7.0% -4.9% 36.3% 36.9% Whistler $502,400 196.8 3.6% 4.2% -0.3% 0.9% 24.8% 86.2% 51.2% HOW TO READ THE TABLE: • Benchmark Price: Estimated sale price of a benchmark property. Benchmarks represent a typical property within each market. • Price Index: Index numbers estimate the percentage change in price on typical and constant quality properties over time. All figures are based on past sales. • x Month/Year Change %: Percentage change of index over a period of x month(s)/year(s) In January 2005, the indexes are set to 100. * Townhome properties are similar to attached properties, a category that was used in the previous MLSLink HPI, but do not included duplexes. Lower Mainland includes areas serviced by both Real Estate Board of Greater Vancouver & Fraser Valley Real Estate Board. The above info is deemed reliable, but is not guaranteed. All dollar amounts in CDN. * MLS®, Multiple Listing Service®, and all related graphics are trademarks of The Canadian Real Estate Association 2 of 17
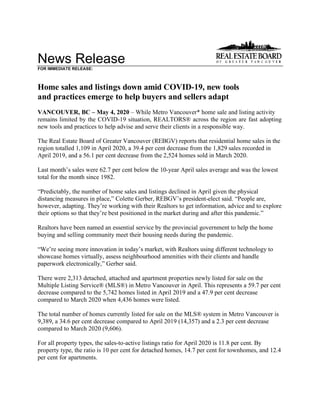
- 5. C:DATAMonthEndHpiexporthi_resgv-hpi2.tifGreaterVancouver 5YearTrend 60 110 160 210 260 310 Apr 2015 Jun 2015 Aug 2015 Oct 2015 Dec 2015 Feb 2016 Apr 2016 Jun 2016 Aug 2016 Oct 2016 Dec 2016 Feb 2017 Apr 2017 Jun 2017 Aug 2017 Oct 2017 Dec 2017 Feb 2018 Apr 2018 Jun 2018 Aug 2018 Oct 2018 Dec 2018 Feb 2019 Apr 2019 Jun 2019 Aug 2019 Oct 2019 Dec 2019 Feb 2020 Apr 2020 Price Index ResidentialDetachedTownhouseApartment Jan2005HPI=100
- 8. Listing & Sales Activity Summary Listings Sales 1 2 3 Col. 2 & 3 5 6 7 Col. 6 & 7 9 10 Col. 9 & 10 Apr Mar Apr Percentage Apr Mar Apr Percentage Feb 2019 - Feb 2020 - Percentage 2019 2020 2020 Variance 2019 2020 2020 Variance Apr 2019 Apr 2020 Variance BURNABY % % % DETACHED 178 105 59 -43.8 53 69 26 -62.3 119 149 25.2 ATTACHED 116 68 55 -19.1 35 58 25 -56.9 107 130 21.5 APARTMENTS 323 310 156 -49.7 103 170 56 -67.1 338 360 6.5 COQUITLAM DETACHED 188 147 52 -64.6 65 73 34 -53.4 151 174 15.2 ATTACHED 76 87 28 -67.8 28 49 17 -65.3 92 107 16.3 APARTMENTS 195 148 106 -28.4 60 79 42 -46.8 186 208 11.8 DELTA DETACHED 101 87 35 -59.8 24 40 23 -42.5 64 100 56.3 ATTACHED 35 22 24 9.1 17 14 7 -50.0 37 34 -8.1 APARTMENTS 32 30 16 -46.7 5 17 11 -35.3 25 46 84.0 MAPLE RIDGE/PITT MEADOWS DETACHED 223 185 103 -44.3 76 104 50 -51.9 193 252 30.6 ATTACHED 87 88 37 -58.0 46 66 27 -59.1 126 153 21.4 APARTMENTS 82 84 29 -65.5 28 29 24 -17.2 83 91 9.6 NORTH VANCOUVER DETACHED 193 130 77 -40.8 53 69 38 -44.9 160 178 11.3 ATTACHED 84 53 55 3.8 31 35 12 -65.7 80 82 2.5 APARTMENTS 228 165 87 -47.3 64 99 45 -54.5 196 242 23.5 NEW WESTMINSTER DETACHED 65 32 21 -34.4 14 21 10 -52.4 38 51 34.2 ATTACHED 16 21 11 -47.6 9 16 12 -25.0 21 35 66.7 APARTMENTS 201 143 56 -60.8 85 81 38 -53.1 192 182 -5.2 PORT MOODY/BELCARRA DETACHED 46 40 16 -60.0 13 16 6 -62.5 30 31 3.3 ATTACHED 36 31 15 -51.6 15 16 8 -50.0 28 32 14.3 APARTMENTS 57 31 24 -22.6 29 22 13 -40.9 67 54 -19.4 PORT COQUITLAM DETACHED 54 48 26 -45.8 21 28 16 -42.9 54 69 27.8 ATTACHED 59 35 23 -34.3 17 30 13 -56.7 52 61 17.3 APARTMENTS 79 58 28 -51.7 29 38 13 -65.8 74 91 23.0 RICHMOND DETACHED 251 138 72 -47.8 41 97 36 -62.9 131 185 41.2 ATTACHED 166 110 51 -53.6 42 73 37 -49.3 101 169 67.3 APARTMENTS 273 274 117 -57.3 89 165 64 -61.2 272 365 34.2 SUNSHINE COAST DETACHED 110 78 38 -51.3 29 44 26 -40.9 103 101 -1.9 ATTACHED 7 17 4 -76.5 8 11 0 -100.0 17 13 -23.5 APARTMENTS 23 11 2 -81.8 10 3 3 0.0 27 14 -48.1 SQUAMISH DETACHED 32 39 18 -53.8 22 18 10 -44.4 54 43 -20.4 ATTACHED 23 21 16 -23.8 9 10 7 -30.0 46 33 -28.3 APARTMENTS 24 25 25 0.0 9 7 3 -57.1 28 26 -7.1 VANCOUVER EAST DETACHED 214 188 80 -57.4 66 109 49 -55.0 173 244 41.0 ATTACHED 91 59 45 -23.7 34 47 17 -63.8 93 102 9.7 APARTMENTS 282 215 121 -43.7 115 136 54 -60.3 289 308 6.6 VANCOUVER WEST DETACHED 226 151 64 -57.6 63 106 37 -65.1 170 205 20.6 ATTACHED 164 90 63 -30.0 45 52 29 -44.2 103 124 20.4 APARTMENTS 769 599 319 -46.7 233 308 129 -58.1 654 698 6.7 WHISTLER/PEMBERTON DETACHED 20 22 11 -50.0 8 12 3 -75.0 29 25 -13.8 ATTACHED 28 33 17 -48.5 20 10 6 -40.0 49 30 -38.8 APARTMENTS 38 40 18 -55.0 18 16 3 -81.3 59 37 -37.3 WEST VANCOUVER/HOWE SOUND DETACHED 184 109 58 -46.8 38 41 22 -46.3 86 108 25.6 ATTACHED 21 16 6 -62.5 2 6 1 -83.3 8 10 25.0 APARTMENTS 38 41 23 -43.9 8 9 5 -44.4 27 21 -22.2 GRAND TOTALS DETACHED 2085 1499 730 -51.3 586 847 386 -54.4 1555 1915 23.2 ATTACHED 1009 751 450 -40.1 358 493 218 -55.8 960 1115 16.1 APARTMENTS 2644 2174 1127 -48.2 885 1179 503 -57.3 2517 2743 9.0