SlideShare ist ein Scribd-Unternehmen logo
1 von 9
Downloaden Sie, um offline zu lesen
News Release
FOR IMMEDIATE RELEASE:
Home buyer competition intensifies across Metro Vancouver’s
housing market
VANCOUVER, BC – March 2, 2021 – Competition amongst home buyers is putting upward
pressure on home prices across Metro Vancouver’s* housing market.
The Real Estate Board of Greater Vancouver (REBGV) reports that residential home sales in the
region totalled 3,727 in February 2021, a 73.3 per cent increase from the 2,150 sales recorded in
February 2020, and a 56 per cent increase from the 2,389 homes sold in January 2021.
Last month’s sales were 42.8 per cent above the 10-year February sales average.
“Metro Vancouver’s housing market is experiencing seller’s market conditions. The supply of
listings for sale isn’t keeping up with the demand we’re seeing,” Colette Gerber, REBGV Chair
said. “Competition amongst home buyers is causing multiple offer situations and upward
pressure on prices.
“This is particularly true in the townhome market where demand is outstripping the available
supply. Conditions differ depending on location and property type so it’s important to work with
your local REALTOR® to develop strategies to meet your needs.”
There were 5,048 detached, attached and apartment homes newly listed for sale on the Multiple
Listing Service® (MLS®) in Metro Vancouver in February 2021. This represents a 26.1 per
cent increase compared to the 4,002 homes listed in February 2020 and a 12.7 per cent increase
compared to January 2021 when 4,480 homes were listed.
The total number of homes currently listed for sale on the MLS® system in Metro Vancouver is
8,358, a 9.1 per cent decrease compared to February 2020 (9,195) and a 0.6 per cent increase
compared to January 2021 (8,306). This is 21.2 per cent below the February 10-year average for
new listings.
For all property types, the sales-to-active listings ratio for February 2021 is 44.6 per cent. By
property type, the ratio is 41.8 per cent for detached homes, 61.8 per cent for townhomes, and
41.7 per cent for apartments.
Generally, analysts say downward pressure on home prices occurs when the ratio dips below 12
per cent for a sustained period, while home prices often experience upward pressure when it
surpasses 20 per cent over several months.
“Low interest rates remain a key driver in today’s market. We’re seeing steady numbers of first-
time home buyers and move-up buyers entering the market,” Gerber said.
The MLS® Home Price Index composite benchmark price for all residential properties in Metro
Vancouver is currently $1,084,000. This represents a 6.8 per cent increase over February 2020
and a 2.6 per cent increase compared to January 2021.
Less populated communities within the region continue to experience the largest year-over-year
price increases across all property types. Examples, according to the MLS HPI®. include Bowen
Island (34.4 per cent increase), the Sunshine Coast (32.7 per cent increase), West Vancouver
(16.1 per cent increase) Maple Ridge (14.8 per cent increase) and Ladner (13.7 per cent
increase).
Sales of detached homes in Metro Vancouver reached 1,231 in February 2021, a 79.7 per cent
increase from the 685 detached sales recorded in February 2020. The benchmark price for a
detached home is $1,621,200. This represents a 13.7 per cent increase from February 2020 and a
2.8 per cent increase compared to January 2021.
Sales of apartment homes reached 1,759 in February 2021, a 65.8 per cent increase compared to
the 1,061 sales in February 2020. The benchmark price of an apartment is $697,500. This
represents a 2.5 per cent increase from February 2020 and a 2.5 per cent increase compared to
January 2021.
Attached home sales in February 2021 totalled 737, an 82.4 per cent increase compared to the
404 sales in February 2020. The benchmark price of an attached home is $839,800. This
represents a 7.2 per cent increase from February 2020 and a 2.9 per cent increase compared to
January 2021.
-30-
*Editor’s Note: Areas covered by the Real Estate Board of Greater Vancouver include: Burnaby, Coquitlam, Maple
Ridge, New Westminster, North Vancouver, Pitt Meadows, Port Coquitlam, Port Moody, Richmond, South Delta,
Squamish, Sunshine Coast, Vancouver, West Vancouver, and Whistler.
The real estate industry is a key economic driver in British Columbia. In 2020, 30,944 homes changed ownership in
the Board’s area, generating $2.1 billion in economic spin-off activity and an estimated 14,728 jobs. The total dollar
value of residential sales transacted through the MLS® system in Greater Vancouver totalled $33.7 billion in 2020.
The Real Estate Board of Greater Vancouver is an association representing more than 14,000 REALTORS® and
their companies. The Board provides a variety of member services, including the Multiple Listing Service®. For
more information on real estate, contact a local REALTOR® or visit www.rebgv.org.
For more information please contact:
Craig Munn
Director, Communication
Real Estate Board of Greater Vancouver
604.730.3146
cmunn@rebgv.org
Property Type Area
Benchmark
Price
Price
Index
1 Month
Change %
3 Month
Change %
6 Month
Change %
1 Year
Change %
3 Year
Change %
5 Year
Change %
10 Year
Change %
Residential / Composite Lower Mainland $1,034,000 289.7 3.1% 4.9% 5.9% 8.9% 4.5% 44.0% 95.3%
Greater Vancouver $1,084,000 284.4 2.6% 3.8% 4.4% 6.8% 1.0% 33.8% 86.0%
Bowen Island $1,217,700 264.0 1.8% 5.9% 14.1% 34.4% 24.9% 89.0% 119.1%
Burnaby East $1,001,900 277.9 0.1% 1.0% 2.1% 5.6% -0.9% 35.4% 83.1%
Burnaby North $927,000 279.9 1.6% 3.1% 3.9% 5.3% -0.5% 38.5% 88.5%
Burnaby South $983,200 277.7 1.2% 1.5% 2.0% 1.8% -5.2% 34.3% 81.0%
Coquitlam $992,500 294.4 2.6% 4.4% 6.1% 8.6% 5.0% 45.6% 106.9%
Ladner $931,000 262.1 6.8% 7.8% 9.4% 13.7% 4.9% 13.1% 74.5%
Maple Ridge $867,700 276.3 4.7% 7.2% 10.3% 14.8% 11.3% 71.4% 108.7%
New Westminster $679,400 298.9 1.4% 1.5% 1.8% 4.5% 0.8% 51.0% 97.6%
North Vancouver $1,161,400 261.0 2.4% 4.0% 5.7% 9.5% 3.9% 31.8% 89.8%
Pitt Meadows $826,600 300.5 4.7% 6.3% 8.4% 11.1% 10.1% 73.2% 115.3%
Port Coquitlam $835,800 286.1 3.8% 5.9% 7.6% 11.0% 7.5% 52.9% 103.2%
Port Moody $975,000 269.5 2.2% 3.7% 6.5% 7.1% 2.8% 42.2% 98.9%
Richmond $992,900 296.4 3.1% 4.5% 5.1% 7.8% 0.1% 33.3% 77.2%
Squamish $829,100 263.8 3.5% 0.9% 5.9% 6.9% 5.0% 55.5% 123.4%
Sunshine Coast $743,200 260.4 3.0% 7.1% 15.3% 32.7% 26.2% 85.9% 109.0%
Tsawwassen $1,053,400 273.1 4.2% 7.9% 9.6% 12.9% 4.8% 8.1% 92.9%
Vancouver East $1,125,400 334.4 1.0% 2.2% 1.4% 3.9% -0.7% 28.7% 95.7%
Vancouver West $1,296,800 270.8 3.2% 3.5% 0.4% 1.9% -6.3% 16.7% 69.0%
West Vancouver $2,426,800 267.2 2.7% 7.2% 11.7% 16.1% -5.5% 10.0% 80.2%
Whistler $997,200 232.4 3.6% 3.2% 7.9% 8.0% 10.5% 66.7% 108.1%
Single Family Detached Lower Mainland $1,428,300 304.6 3.9% 7.3% 11.1% 16.5% 8.5% 36.5% 103.7%
Greater Vancouver $1,621,200 299.5 2.8% 5.3% 8.7% 13.7% 2.2% 22.0% 88.1%
Bowen Island $1,217,700 264.0 1.7% 5.9% 14.1% 34.4% 24.9% 89.0% 119.1%
Burnaby East $1,317,900 294.7 -0.2% 2.6% 4.8% 10.2% 2.9% 24.3% 95.0%
Burnaby North $1,572,500 304.1 1.7% 3.2% 6.4% 10.8% 2.6% 18.2% 94.1%
Burnaby South $1,629,300 311.9 2.1% 3.6% 4.8% 10.2% -3.2% 20.2% 94.0%
Coquitlam $1,363,000 302.5 3.2% 7.1% 10.8% 15.9% 6.7% 34.5% 111.2%
Ladner $1,159,000 277.4 7.7% 9.7% 15.3% 20.9% 12.7% 9.6% 88.8%
Maple Ridge $972,600 277.1 4.5% 8.3% 13.5% 18.2% 14.7% 68.1% 116.7%
New Westminster $1,177,800 293.8 0.6% 3.4% 7.2% 11.9% 1.6% 25.9% 84.5%
North Vancouver $1,783,200 280.8 3.5% 6.7% 10.4% 15.3% 5.1% 24.1% 103.5%
Pitt Meadows $1,066,700 300.6 5.3% 7.7% 13.1% 20.6% 16.9% 67.3% 123.5%
Port Coquitlam $1,135,600 302.8 3.8% 9.3% 14.3% 19.1% 15.1% 42.5% 118.8%
Port Moody $1,655,900 305.8 3.4% 7.2% 12.8% 17.3% 11.6% 40.6% 114.0%
Richmond $1,651,800 320.0 3.3% 4.5% 6.9% 9.6% -6.1% 14.5% 64.3%
Squamish $1,034,400 272.6 4.3% -1.3% 4.6% 6.1% 2.7% 51.4% 123.6%
Sunshine Coast $737,300 258.3 3.0% 7.1% 15.4% 32.6% 26.0% 85.2% 107.0%
Tsawwassen $1,273,100 283.7 3.4% 8.5% 11.8% 15.7% 8.1% 3.9% 104.0%
Vancouver East $1,565,800 344.9 1.2% 2.1% 4.2% 9.5% 1.7% 16.6% 105.9%
Vancouver West $3,203,200 324.0 1.0% 2.6% 3.8% 8.5% -9.1% 4.3% 65.9%
West Vancouver $2,972,400 280.6 2.3% 8.4% 11.3% 16.8% -5.4% 8.9% 88.8%
Whistler $1,746,900 243.0 4.3% -1.3% 3.7% 3.9% 2.1% 47.6% 99.5%
HOW TO READ THE TABLE:
• Benchmark Price: Estimated sale price of a benchmark property. Benchmarks represent a typical property within each market.
• Price Index: Index numbers estimate the percentage change in price on typical and constant quality properties over time. All figures are based on past sales.
• x Month/Year Change %: Percentage change of index over a period of x month(s)/year(s) *
In January 2005, the indexes are set to 100.
Townhome properties are similar to Attached properties, a category that was used in the previous MLSLink HPI, but do not included duplexes.
The above info is deemed reliable, but is not guaranteed. All dollar amounts in CDN.
February 2021
*
* MLS®, Multiple Listing Service®, and all related graphics are trademarks of The Canadian Real Estate Association 1 of 18
Property Type Area
Benchmark
Price
Price
Index
1 Month
Change %
3 Month
Change %
6 Month
Change %
1 Year
Change %
3 Year
Change %
5 Year
Change %
10 Year
Change %
February 2021
*
Townhouse Lower Mainland $734,700 266.5 3.1% 4.1% 5.3% 8.6% 6.0% 54.6% 85.2%
Greater Vancouver $839,800 269.4 2.9% 3.1% 4.1% 7.2% 4.0% 44.3% 79.8%
Burnaby East $685,700 253.3 -0.9% -1.7% -3.2% 4.0% 0.1% 58.1% 67.2%
Burnaby North $769,400 287.2 1.4% 3.6% 5.0% 5.7% 2.3% 43.1% 85.6%
Burnaby South $806,200 277.7 0.5% 0.3% 0.5% 4.1% -0.2% 46.6% 79.2%
Coquitlam $725,100 266.1 2.0% 3.3% 5.3% 7.8% 6.5% 47.6% 89.8%
Ladner $673,900 241.7 5.9% 5.2% 3.1% 6.0% -5.2% 23.3% 47.4%
Maple Ridge $594,300 275.9 5.8% 6.4% 7.4% 13.4% 7.8% 76.3% 99.2%
New Westminster $779,700 286.1 4.3% 3.2% 1.9% 6.5% 4.4% 46.5% 77.7%
North Vancouver $1,036,300 251.8 1.5% 0.5% 2.1% 9.4% 3.8% 40.0% 83.1%
Pitt Meadows $651,000 281.7 4.6% 4.8% 4.1% 6.1% 10.9% 69.3% 96.9%
Port Coquitlam $697,600 264.1 5.6% 6.7% 6.3% 12.3% 6.6% 48.0% 83.5%
Port Moody $660,400 223.2 1.3% 1.5% 1.2% 4.9% 2.4% 25.5% 59.4%
Richmond $849,900 279.1 3.2% 3.4% 5.3% 8.9% 4.5% 39.4% 72.9%
Squamish $789,800 259.7 3.7% 1.8% 10.1% 10.3% 13.1% 65.2% 123.3%
Tsawwassen $640,500 251.1 5.3% 3.6% 2.0% 2.4% -7.2% 27.3% 51.6%
Vancouver East $910,000 289.4 1.8% 1.0% 0.8% 0.9% -2.0% 35.0% 78.5%
Vancouver West $1,167,700 273.0 2.3% 1.5% 0.4% 2.4% -1.3% 29.6% 80.8%
Whistler $1,037,300 250.1 2.0% 2.5% 12.5% 9.2% 16.2% 74.8% 125.9%
Apartment Lower Mainland $671,800 287.8 2.5% 3.2% 2.1% 3.2% 0.9% 55.9% 92.9%
Greater Vancouver $697,500 278.9 2.5% 3.1% 1.7% 2.5% -0.4% 47.3% 87.3%
Burnaby East $739,000 283.5 1.2% 0.9% 2.5% 0.7% -7.1% 45.7% 79.8%
Burnaby North $629,600 268.8 1.6% 3.0% 2.5% 2.7% -2.0% 62.6% 90.2%
Burnaby South $664,700 266.9 1.1% 1.0% 1.3% -1.7% -6.4% 45.1% 77.2%
Coquitlam $546,300 299.8 2.5% 2.8% 3.3% 4.4% 4.0% 66.7% 111.1%
Ladner $535,700 250.1 5.4% 5.3% 2.5% 5.5% -2.0% 30.7% 68.2%
Maple Ridge $387,000 276.3 3.6% 5.4% 6.8% 8.7% 5.2% 82.1% 92.4%
New Westminster $532,900 301.9 1.2% 0.8% 0.8% 3.0% 0.1% 62.2% 102.8%
North Vancouver $600,000 244.7 1.5% 2.5% 2.8% 4.5% 3.1% 47.0% 78.4%
Pitt Meadows $532,000 313.7 4.4% 6.2% 7.1% 7.9% 2.4% 83.9% 115.6%
Port Coquitlam $481,300 287.8 2.9% 3.1% 4.0% 5.3% 2.8% 76.8% 103.2%
Port Moody $671,900 280.0 1.9% 2.4% 5.9% 3.8% 0.5% 62.7% 118.6%
Richmond $683,200 292.5 3.0% 4.8% 3.8% 6.5% 3.6% 60.8% 97.2%
Squamish $509,000 250.9 1.5% 3.0% 3.3% 4.4% 2.2% 61.8% 127.3%
Tsawwassen $573,300 246.9 5.7% 5.9% 3.7% 5.6% -2.2% 33.1% 68.0%
Vancouver East $599,600 337.0 0.6% 2.3% -0.2% 0.6% -2.3% 47.1% 88.8%
Vancouver West $794,500 257.8 4.2% 4.0% -0.6% -0.2% -4.9% 26.4% 73.0%
West Vancouver $1,114,800 226.5 3.9% 2.1% 11.3% 9.9% -4.2% 29.2% 57.3%
Whistler $536,900 210.3 4.8% 7.3% 6.1% 8.6% 10.0% 75.0% 103.0%
HOW TO READ THE TABLE:
• Benchmark Price: Estimated sale price of a benchmark property. Benchmarks represent a typical property within each market.
• Price Index: Index numbers estimate the percentage change in price on typical and constant quality properties over time. All figures are based on past sales.
• x Month/Year Change %: Percentage change of index over a period of x month(s)/year(s)
In January 2005, the indexes are set to 100. *
Townhome properties are similar to attached properties, a category that was used in the previous MLSLink HPI, but do not included duplexes.
Lower Mainland includes areas serviced by both Real Estate Board of Greater Vancouver & Fraser Valley Real Estate Board.
The above info is deemed reliable, but is not guaranteed. All dollar amounts in CDN.
* MLS®, Multiple Listing Service®, and all related graphics are trademarks of The Canadian Real Estate Association 2 of 18
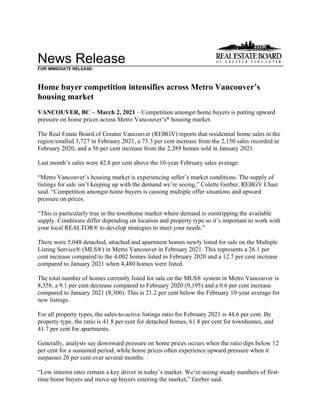
C:DATAMonthEndHpiexporthi_resgv-hpi2.tif
Greater
Vancouver
5
Year
Trend
60
110
160
210
260
310
360
Feb 2016
Apr 2016
Jun 2016
Aug 2016
Oct 2016
Dec 2016
Feb 2017
Apr 2017
Jun 2017
Aug 2017
Oct 2017
Dec 2017
Feb 2018
Apr 2018
Jun 2018
Aug 2018
Oct 2018
Dec 2018
Feb 2019
Apr 2019
Jun 2019
Aug 2019
Oct 2019
Dec 2019
Feb 2020
Apr 2020
Jun 2020
Aug 2020
Oct 2020
Dec 2020
Feb 2021
Price
Index
Residential
Detached
Townhouse
Apartment
Jan
2005
HPI
=
100
2
28
2021
MLS
®
SALES
Facts
B
u
r
n
a
b
y
C
o
q
u
it
la
m
D
e
lt
a
-
S
o
u
th
Is
la
n
d
s
-
G
u
lf
M
a
p
le
R
id
g
e
/P
it
t
M
e
a
d
o
w
s
N
e
w
W
e
s
tm
in
s
t
e
r
N
o
r
th
V
a
n
c
o
u
v
e
r
P
o
r
t
C
o
q
u
it
la
m
P
o
r
t
M
o
o
d
y
/B
e
lc
a
r
r
a
R
ic
h
m
o
n
d
S
q
u
a
m
is
h
S
u
n
s
h
in
e
C
o
a
s
t
V
a
n
c
o
u
v
e
r
E
a
s
t
V
a
n
c
o
u
v
e
r
W
e
s
t
W
e
s
t
V
a
n
c
o
u
v
e
r
/H
o
w
e
S
o
u
n
d
W
h
is
tl
e
r
/P
e
m
b
e
r
to
n
Detached
97
105
84
11
169
30
88
51
27
139
32
71
137
87
78
25
1,231
Attached
66
69
23
1
89
21
86
25
25
115
21
19
85
63
10
19
737
Apartment
271
138
28
0
73
111
141
44
39
197
25
11
183
440
14
44
1,759
Detached
$1,739,999
$1,545,000
$1,280,000
n/a
$1,080,000
$1,308,000
$1,953,000
$1,270,000
$1,720,000
$1,750,000
$1,352,500
$800,000
$1,700,000
$3,232,500
$3,064,000
$2,200,000
Attached
$910,500
$954,900
$825,000
n/a
$635,900
$750,000
$1,197,750
$801,000
$877,500
$907,000
$830,000
n/a
$1,184,000
$1,335,000
n/a
n/a
n/a
Apartment
$598,000
$566,500
$629,450
n/a
$427,000
$540,000
$715,000
$474,400
$640,000
$565,000
$525,000
n/a
$602,000
$735,000
n/a
$625,000
Detached
56
76
45
6
95
21
45
33
9
71
19
42
109
69
29
15
740
Attached
58
38
10
0
68
14
41
18
9
64
12
8
48
38
5
23
454
Apartment
196
106
18
0
49
66
92
37
28
142
16
10
99
285
11
40
1,195
Detached
$1,574,000
$1,500,000
$1,268,000
n/a
$1,051,250
$1,275,000
$1,840,000
$1,190,000
n/a
$1,588,800
n/a
$747,500
$1,731,500
$3,300,000
$3,100,000
n/a
Attached
$896,650
$873,900
n/a
n/a
$639,950
n/a
$1,218,952
n/a
n/a
$891,500
n/a
n/a
$1,234,000
$1,465,944
n/a
$935,000
n/a
Apartment
$579,450
$562,500
n/a
n/a
$399,900
$537,500
$699,250
$450,000
$592,500
$560,950
n/a
n/a
$633,000
$756,500
n/a
$559,000
Detached
54
67
37
3
98
20
71
25
9
52
15
31
86
62
45
10
685
Attached
47
41
13
0
60
7
35
18
8
59
16
2
38
43
3
14
404
Apartment
134
87
18
0
38
63
98
40
19
136
16
8
118
261
7
18
1,061
Detached
$1,452,500
$1,238,000
$1,035,000
n/a
$913,805
$1,192,500
$1,640,000
$950,000
n/a
$1,725,000
n/a
$586,500
$1,422,500
$2,980,000
$2,310,700
n/a
Attached
$796,944
$898,900
n/a
n/a
$554,950
n/a
$1,090,000
n/a
n/a
$862,000
n/a
n/a
$1,093,700
$1,160,000
n/a
n/a
n/a
Apartment
$607,000
$527,500
n/a
n/a
$377,450
$507,000
$655,000
$440,000
n/a
$576,450
n/a
n/a
$640,000
$760,000
n/a
n/a
Detached
153
181
129
17
264
51
133
84
36
210
51
113
246
156
107
40
1,971
Attached
124
107
33
1
157
35
127
43
34
179
33
27
133
101
15
42
1,191
Apartment
467
244
46
0
122
177
233
81
67
339
41
21
282
725
25
84
2,954
Detached
$1,700,000
$1,519,000
$1,275,000
n/a
$1,070,000
$1,300,000
$1,915,000
$1,245,000
$1,709,000
$1,708,400
$1,300,000
$774,000
$1,710,000
$3,285,000
$3,100,000
$2,100,000
Attached
$910,000
$925,900
$820,000
n/a
$638,000
$719,000
$1,199,900
$790,000
$855,500
$905,000
$810,000
$529,000
$1,199,900
$1,425,000
n/a
$1,025,000
n/a
Apartment
$592,000
$565,000
$572,500
n/a
$419,450
$539,000
$712,500
$460,000
$620,000
$562,000
$593,761
$419,900
$607,500
$740,000
$1,140,000
$580,000
Detached
95
108
60
7
165
27
95
47
18
104
27
52
139
97
66
17
1,124
Attached
84
73
26
2
96
11
48
33
20
122
22
6
68
73
5
33
722
Apartment
258
158
38
0
70
101
161
63
35
237
27
11
196
471
13
36
1,875
Detached
$1,430,000
$1,280,000
$1,016,500
n/a
$879,980
$1,150,000
$1,645,500
$915,000
n/a
$1,650,000
$1,075,000
$613,738
$1,469,250
$3,000,000
$2,317,850
n/a
Attached
$795,000
$810,000
$684,350
n/a
$547,400
n/a
$1,084,000
$678,300
$778,250
$826,500
$669,950
n/a
$1,053,750
$1,489,000
n/a
$1,100,000
n/a
Apartment
$596,500
$512,500
$547,500
n/a
$384,900
$515,000
$623,500
$440,000
$569,000
$565,000
$449,000
n/a
$602,500
$757,500
n/a
$526,500
Note:
Median
Selling
Prices
are
not
reported
for
areas
with
less
than
20
sales
or
for
the
Gulf
Islands
Number
of
Sales
February
2021
Number
of
Sales
Median
Selling
Price
Number
of
Sales
Median
Selling
Price
Number
of
Sales
Median
Selling
Price
January
2021
February
2020
Jan.
-
Feb.
2021
Jan.
-
Feb.
2020
Median
Selling
Price
Number
of
Sales
Median
Selling
Price
February
2021
Year-to-date
Year-to-date
2
28
2021
MLS
®
LISTINGS
Facts
B
u
r
n
a
b
y
C
o
q
u
it
la
m
D
e
lt
a
-
S
o
u
th
Is
la
n
d
s
-
G
u
lf
M
a
p
le
R
id
g
e
/P
it
t
M
e
a
d
o
w
s
N
e
w
W
e
s
tm
in
s
t
e
r
N
o
r
th
V
a
n
c
o
u
v
e
r
P
o
r
t
C
o
q
u
it
la
m
P
o
r
t
M
o
o
d
y
/B
e
lc
a
r
r
a
R
ic
h
m
o
n
d
S
q
u
a
m
is
h
S
u
n
s
h
in
e
C
o
a
s
t
V
a
n
c
o
u
v
e
r
E
a
s
t
V
a
n
c
o
u
v
e
r
W
e
s
t
W
e
s
t
V
a
n
c
o
u
v
e
r
/H
o
w
e
S
o
u
n
d
W
h
is
tl
e
r
/P
e
m
b
e
r
to
n
Detached
141
160
108
4
223
48
127
78
39
184
51
91
227
146
113
20
1,760
Attached
121
71
33
2
77
15
111
34
26
137
24
18
81
91
15
32
888
Apartment
333
164
42
0
86
153
188
60
41
264
24
6
259
691
32
57
2,400
Detached
69%
66%
78%
275%
76%
63%
69%
65%
69%
76%
63%
78%
60%
60%
69%
125%
Attached
55%
97%
70%
50%
116%
140%
77%
74%
96%
84%
88%
106%
105%
69%
67%
59%
n/a
Apartment
81%
84%
67%
n/a
85%
73%
75%
73%
95%
75%
104%
183%
71%
64%
44%
77%
Detached
103
114
68
5
125
25
87
50
20
152
38
66
175
144
137
19
1,328
Attached
78
65
27
2
79
28
67
29
15
138
18
10
106
106
14
27
809
Apartment
358
149
45
0
62
159
178
77
37
306
23
11
216
640
38
44
2,343
Detached
54%
67%
66%
120%
76%
84%
52%
66%
45%
47%
50%
64%
62%
48%
21%
79%
Attached
74%
58%
37%
0%
86%
50%
61%
62%
60%
46%
67%
80%
45%
36%
36%
85%
n/a
Apartment
55%
71%
40%
n/a
79%
42%
52%
48%
76%
46%
70%
91%
46%
45%
29%
91%
Detached
97
101
67
3
154
29
124
38
32
144
36
77
157
131
100
25
1,315
Attached
78
48
19
1
103
15
54
36
25
113
23
16
70
86
11
25
723
Apartment
240
177
34
1
72
108
188
49
42
243
18
15
210
492
30
45
1,964
Detached
56%
66%
55%
100%
64%
69%
57%
66%
28%
36%
42%
40%
55%
47%
45%
40%
Attached
60%
85%
68%
0%
58%
47%
65%
50%
32%
52%
70%
13%
54%
50%
27%
56%
n/a
Apartment
56%
49%
53%
0%
53%
58%
52%
82%
45%
56%
89%
53%
56%
53%
23%
40%
Detached
244
274
176
9
348
73
214
128
59
336
89
157
402
290
250
39
3,088
Attached
199
136
60
4
156
43
178
63
41
275
42
28
187
197
29
59
1,697
Apartment
691
313
87
0
148
312
366
137
78
570
47
17
475
1,331
70
101
4,743
Detached
63%
66%
73%
189%
76%
70%
62%
66%
61%
63%
57%
72%
61%
54%
43%
103%
Attached
62%
79%
55%
25%
101%
81%
71%
68%
83%
65%
79%
96%
71%
51%
52%
71%
n/a
Apartment
68%
78%
53%
n/a
82%
57%
64%
59%
86%
59%
87%
124%
59%
54%
36%
83%
Detached
220
218
137
9
284
57
255
75
56
312
64
126
277
275
236
48
2,649
Attached
158
109
47
4
174
34
114
71
36
222
39
26
133
178
18
56
1,419
Apartment
490
301
85
2
127
196
363
104
70
485
42
18
381
992
61
89
3,806
Detached
43%
50%
44%
78%
58%
47%
37%
63%
32%
33%
42%
41%
50%
35%
28%
35%
Attached
53%
67%
55%
50%
55%
32%
42%
46%
56%
55%
56%
23%
51%
41%
28%
59%
n/a
Apartment
53%
52%
45%
0%
55%
52%
44%
61%
50%
49%
64%
61%
51%
47%
21%
40%
*
Year-to-date
listings
represent
a
cumulative
total
of
listings
rather
than
total
active
listings.
%
Sales
to
Listings
Number
of
Listings
%
Sales
to
Listings
January
2021
February
2020
Jan.
-
Feb.
2021
Jan.
-
Feb.
2020
%
Sales
to
Listings
Number
of
Listings
%
Sales
to
Listings
Number
of
Listings
February
2021
Number
of
Listings
%
Sales
to
Listings
Number
of
Listings
February
2021
Year-to-date*
Year-to-date*
Listing & Sales Activity Summary
Listings Sales
1 2 3 Col. 2 & 3 5 6 7 Col. 6 & 7 9 10 Col. 9 & 10
Feb Jan Feb Percentage Feb Jan Feb Percentage Dec 2019 - Dec 2020 - Percentage
2020 2021 2021 Variance 2020 2021 2021 Variance Feb 2020 Feb 2021 Variance
BURNABY % % %
DETACHED 97 103 141 36.9 54 56 97 73.2 145 236 62.8
ATTACHED 78 78 121 55.1 47 58 66 13.8 143 192 34.3
APARTMENTS 240 358 333 -7.0 134 196 271 38.3 418 676 61.7
COQUITLAM
DETACHED 101 114 160 40.4 67 76 105 38.2 159 284 78.6
ATTACHED 48 65 71 9.2 41 38 69 81.6 110 171 55.5
APARTMENTS 177 149 164 10.1 87 106 138 30.2 262 384 46.6
DELTA
DETACHED 67 68 108 58.8 37 45 84 86.7 79 187 136.7
ATTACHED 19 27 33 22.2 13 10 23 130.0 32 63 96.9
APARTMENTS 34 45 42 -6.7 18 18 28 55.6 59 66 11.9
MAPLE RIDGE/PITT MEADOWS
DETACHED 154 125 223 78.4 98 95 169 77.9 245 390 59.2
ATTACHED 103 79 77 -2.5 60 68 89 30.9 125 222 77.6
APARTMENTS 72 62 86 38.7 38 49 73 49.0 113 168 48.7
NORTH VANCOUVER
DETACHED 124 87 127 46.0 71 45 88 95.6 151 214 41.7
ATTACHED 54 67 111 65.7 35 41 86 109.8 73 169 131.5
APARTMENTS 188 178 188 5.6 98 92 141 53.3 235 357 51.9
NEW WESTMINSTER
DETACHED 29 25 48 92.0 20 21 30 42.9 38 75 97.4
ATTACHED 15 28 15 -46.4 7 14 21 50.0 20 57 185.0
APARTMENTS 108 159 153 -3.8 63 66 111 68.2 157 280 78.3
PORT MOODY/BELCARRA
DETACHED 32 20 39 95.0 9 9 27 200.0 26 57 119.2
ATTACHED 25 15 26 73.3 8 9 25 177.8 35 53 51.4
APARTMENTS 42 37 41 10.8 19 28 39 39.3 48 105 118.8
PORT COQUITLAM
DETACHED 38 50 78 56.0 25 33 51 54.5 71 113 59.2
ATTACHED 36 29 34 17.2 18 18 25 38.9 56 66 17.9
APARTMENTS 49 77 60 -22.1 40 37 44 18.9 97 133 37.1
RICHMOND
DETACHED 144 152 184 21.1 52 71 139 95.8 190 321 68.9
ATTACHED 113 138 137 -0.7 59 64 115 79.7 175 257 46.9
APARTMENTS 243 306 264 -13.7 136 142 197 38.7 379 491 29.6
SUNSHINE COAST
DETACHED 77 66 91 37.9 31 42 71 69.0 84 176 109.5
ATTACHED 16 10 18 80.0 2 8 19 137.5 9 37 311.1
APARTMENTS 15 11 6 -45.5 8 10 11 10.0 15 29 93.3
SQUAMISH
DETACHED 36 38 51 34.2 15 19 32 68.4 40 79 97.5
ATTACHED 23 18 24 33.3 16 12 21 75.0 33 55 66.7
APARTMENTS 18 23 24 4.3 16 16 25 56.3 39 66 69.2
VANCOUVER EAST
DETACHED 157 175 227 29.7 86 109 137 25.7 213 379 77.9
ATTACHED 70 106 81 -23.6 38 48 85 77.1 103 201 95.1
APARTMENTS 210 216 259 19.9 118 99 183 84.8 294 429 45.9
VANCOUVER WEST
DETACHED 131 144 146 1.4 62 69 87 26.1 156 240 53.8
ATTACHED 86 106 91 -14.2 43 38 63 65.8 110 139 26.4
APARTMENTS 492 640 691 8.0 261 285 440 54.4 731 1089 49.0
WHISTLER/PEMBERTON
DETACHED 25 19 20 5.3 10 15 25 66.7 21 56 166.7
ATTACHED 25 27 32 18.5 14 23 19 -17.4 48 77 60.4
APARTMENTS 45 44 57 29.5 18 40 44 10.0 57 112 96.5
WEST VANCOUVER/HOWE SOUND
DETACHED 100 137 113 -17.5 45 29 78 169.0 94 160 70.2
ATTACHED 11 14 15 7.1 3 5 10 100.0 12 24 100.0
APARTMENTS 30 38 32 -15.8 7 11 14 27.3 24 43 79.2
GRAND TOTALS
DETACHED 1312 1323 1756 32.7 682 734 1220 66.2 1712 2967 73.3
ATTACHED 722 807 886 9.8 404 454 736 62.1 1084 1783 64.5
APARTMENTS 1963 2343 2400 2.4 1061 1195 1759 47.2 2928 4428 51.2
Residential Average Sale Prices - January 1977 to February 2021
0
200
400
600
800
1000
1200
1400
1600
1800
2000
1
9
7
7
1
9
7
8
1
9
7
9
1
9
8
0
1
9
8
1
1
9
8
2
1
9
8
3
1
9
8
4
1
9
8
5
1
9
8
6
1
9
8
7
1
9
8
8
1
9
8
9
1
9
9
0
1
9
9
1
1
9
9
2
1
9
9
3
1
9
9
4
1
9
9
5
1
9
9
6
1
9
9
7
1
9
9
8
1
9
9
9
2
0
0
0
2
0
0
1
2
0
0
2
2
0
0
3
2
0
0
4
2
0
0
5
2
0
0
6
2
0
0
7
2
0
0
8
2
0
0
9
2
0
1
0
2
0
1
1
2
0
1
2
2
0
1
3
2
0
1
4
2
0
1
5
2
0
1
6
2
0
1
7
2
0
1
8
2
0
1
9
2
0
2
0
2
0
2
1
DETACHED CONDOMINIUM ATTACHED APARTMENTS
IN THOUSANDS ($)
NOTE: From 1977 - 1984 condominium averages were not separated into attached & apartment.
$1,025,120
$693,138
$1,865,031

Weitere ähnliche Inhalte

Was ist angesagt?

Rebgv stats-pkg-july-2019
Rebgv stats-pkg-july-2019Rebgv stats-pkg-july-2019
Rebgv stats-pkg-july-2019Vicky Aulakh
 
Metro Vancouver Statistics September 2021
Metro Vancouver Statistics September 2021 Metro Vancouver Statistics September 2021
Metro Vancouver Statistics September 2021 VickyAulakh1
 
Rebgv stats-pkg-november-2019-f
Rebgv stats-pkg-november-2019-fRebgv stats-pkg-november-2019-f
Rebgv stats-pkg-november-2019-fVicky Aulakh
 
Rebgv stats-pkg-june-2019
Rebgv stats-pkg-june-2019Rebgv stats-pkg-june-2019
Rebgv stats-pkg-june-2019Vicky Aulakh
 
Rebgv stats-pkg-april-2019
Rebgv stats-pkg-april-2019Rebgv stats-pkg-april-2019
Rebgv stats-pkg-april-2019Kathryn Huang
 
REBGV Statistics Package May 2020
REBGV Statistics Package May 2020REBGV Statistics Package May 2020
REBGV Statistics Package May 2020Vicky Aulakh
 
REBGV Statistics Package August 2020
REBGV Statistics Package August 2020REBGV Statistics Package August 2020
REBGV Statistics Package August 2020Vicky Aulakh
 
May 2021 Real Estate Board of Greater Vancouver Statistics Package
May 2021 Real Estate Board of Greater Vancouver Statistics PackageMay 2021 Real Estate Board of Greater Vancouver Statistics Package
May 2021 Real Estate Board of Greater Vancouver Statistics PackageVicky Aulakh
 
Rebgv stats-pkg-february-2020
Rebgv stats-pkg-february-2020Rebgv stats-pkg-february-2020
Rebgv stats-pkg-february-2020Vicky Aulakh
 
REBGV Statistics Package October 2020
REBGV Statistics Package October 2020REBGV Statistics Package October 2020
REBGV Statistics Package October 2020Vicky Aulakh
 
Rebgv stats-pkg-may-2019
Rebgv stats-pkg-may-2019Rebgv stats-pkg-may-2019
Rebgv stats-pkg-may-2019Kathryn Huang
 
Rebgv stats-pkg-april-2020
Rebgv stats-pkg-april-2020Rebgv stats-pkg-april-2020
Rebgv stats-pkg-april-2020Vicky Aulakh
 
Real Estate Board of Greater Vancouver Statistics Package August 2021
Real Estate Board of Greater Vancouver Statistics Package August 2021Real Estate Board of Greater Vancouver Statistics Package August 2021
Real Estate Board of Greater Vancouver Statistics Package August 2021Vicky Aulakh
 
REBGV Statistic Package December 2020
REBGV Statistic Package December 2020REBGV Statistic Package December 2020
REBGV Statistic Package December 2020Vicky Aulakh
 
Real Estate Board of Greater Vancouver Statistics Package - November 2021
Real Estate Board of Greater Vancouver Statistics Package - November 2021Real Estate Board of Greater Vancouver Statistics Package - November 2021
Real Estate Board of Greater Vancouver Statistics Package - November 2021VickyAulakh1
 
REBGV January 2020 Statistics Package
REBGV January 2020 Statistics Package REBGV January 2020 Statistics Package
REBGV January 2020 Statistics Package Vicky Aulakh
 
Rebgv Stats Package September 2020
Rebgv Stats Package September 2020Rebgv Stats Package September 2020
Rebgv Stats Package September 2020Vicky Aulakh
 
Metro Vancouver Statistics Report October 2021
Metro Vancouver Statistics Report October 2021Metro Vancouver Statistics Report October 2021
Metro Vancouver Statistics Report October 2021VickyAulakh1
 
REBGV Statistics package July 2020
REBGV Statistics package July 2020REBGV Statistics package July 2020
REBGV Statistics package July 2020Vicky Aulakh
 
REBGV Statistics Package April 2021
REBGV Statistics Package April 2021REBGV Statistics Package April 2021
REBGV Statistics Package April 2021Vicky Aulakh
 

Was ist angesagt? (20)

Rebgv stats-pkg-july-2019
Rebgv stats-pkg-july-2019Rebgv stats-pkg-july-2019
Rebgv stats-pkg-july-2019
 
Metro Vancouver Statistics September 2021
Metro Vancouver Statistics September 2021 Metro Vancouver Statistics September 2021
Metro Vancouver Statistics September 2021
 
Rebgv stats-pkg-november-2019-f
Rebgv stats-pkg-november-2019-fRebgv stats-pkg-november-2019-f
Rebgv stats-pkg-november-2019-f
 
Rebgv stats-pkg-june-2019
Rebgv stats-pkg-june-2019Rebgv stats-pkg-june-2019
Rebgv stats-pkg-june-2019
 
Rebgv stats-pkg-april-2019
Rebgv stats-pkg-april-2019Rebgv stats-pkg-april-2019
Rebgv stats-pkg-april-2019
 
REBGV Statistics Package May 2020
REBGV Statistics Package May 2020REBGV Statistics Package May 2020
REBGV Statistics Package May 2020
 
REBGV Statistics Package August 2020
REBGV Statistics Package August 2020REBGV Statistics Package August 2020
REBGV Statistics Package August 2020
 
May 2021 Real Estate Board of Greater Vancouver Statistics Package
May 2021 Real Estate Board of Greater Vancouver Statistics PackageMay 2021 Real Estate Board of Greater Vancouver Statistics Package
May 2021 Real Estate Board of Greater Vancouver Statistics Package
 
Rebgv stats-pkg-february-2020
Rebgv stats-pkg-february-2020Rebgv stats-pkg-february-2020
Rebgv stats-pkg-february-2020
 
REBGV Statistics Package October 2020
REBGV Statistics Package October 2020REBGV Statistics Package October 2020
REBGV Statistics Package October 2020
 
Rebgv stats-pkg-may-2019
Rebgv stats-pkg-may-2019Rebgv stats-pkg-may-2019
Rebgv stats-pkg-may-2019
 
Rebgv stats-pkg-april-2020
Rebgv stats-pkg-april-2020Rebgv stats-pkg-april-2020
Rebgv stats-pkg-april-2020
 
Real Estate Board of Greater Vancouver Statistics Package August 2021
Real Estate Board of Greater Vancouver Statistics Package August 2021Real Estate Board of Greater Vancouver Statistics Package August 2021
Real Estate Board of Greater Vancouver Statistics Package August 2021
 
REBGV Statistic Package December 2020
REBGV Statistic Package December 2020REBGV Statistic Package December 2020
REBGV Statistic Package December 2020
 
Real Estate Board of Greater Vancouver Statistics Package - November 2021
Real Estate Board of Greater Vancouver Statistics Package - November 2021Real Estate Board of Greater Vancouver Statistics Package - November 2021
Real Estate Board of Greater Vancouver Statistics Package - November 2021
 
REBGV January 2020 Statistics Package
REBGV January 2020 Statistics Package REBGV January 2020 Statistics Package
REBGV January 2020 Statistics Package
 
Rebgv Stats Package September 2020
Rebgv Stats Package September 2020Rebgv Stats Package September 2020
Rebgv Stats Package September 2020
 
Metro Vancouver Statistics Report October 2021
Metro Vancouver Statistics Report October 2021Metro Vancouver Statistics Report October 2021
Metro Vancouver Statistics Report October 2021
 
REBGV Statistics package July 2020
REBGV Statistics package July 2020REBGV Statistics package July 2020
REBGV Statistics package July 2020
 
REBGV Statistics Package April 2021
REBGV Statistics Package April 2021REBGV Statistics Package April 2021
REBGV Statistics Package April 2021
 

Ähnlich wie REBGV Stats Package February 2021

Real Estate Board of Greater Vancouver Statistics Package February 2022
Real Estate Board of Greater Vancouver Statistics Package February 2022Real Estate Board of Greater Vancouver Statistics Package February 2022
Real Estate Board of Greater Vancouver Statistics Package February 2022Vicky Aulakh
 
Supply response emerges in Metro Vancouver’s active housing market
Supply response emerges in Metro Vancouver’s active housing marketSupply response emerges in Metro Vancouver’s active housing market
Supply response emerges in Metro Vancouver’s active housing marketAlexanderMackenzie13
 
Greater Vancouver Realtors Statistics Package April 2024
Greater Vancouver Realtors Statistics Package April 2024Greater Vancouver Realtors Statistics Package April 2024
Greater Vancouver Realtors Statistics Package April 2024VickyAulakh1
 
Real Estate Board of Greater Vancouver Statistics Package January 2021
Real Estate Board of Greater Vancouver Statistics Package January 2021 Real Estate Board of Greater Vancouver Statistics Package January 2021
Real Estate Board of Greater Vancouver Statistics Package January 2021 Vicky Aulakh
 
March 2020 REBGV Statistics Package
March 2020 REBGV Statistics PackageMarch 2020 REBGV Statistics Package
March 2020 REBGV Statistics PackageMike Stewart
 
March 2020-rebgv-stats-pkg
March 2020-rebgv-stats-pkgMarch 2020-rebgv-stats-pkg
March 2020-rebgv-stats-pkgMatt Scalena
 
Real Estate Board of Greater Vancouver - Statistics Package for July 2021
Real Estate Board of Greater Vancouver - Statistics Package for July 2021Real Estate Board of Greater Vancouver - Statistics Package for July 2021
Real Estate Board of Greater Vancouver - Statistics Package for July 2021Alexander Mackenzie, PMP
 
Rebgv stats-pkg-february-2018
Rebgv stats-pkg-february-2018Rebgv stats-pkg-february-2018
Rebgv stats-pkg-february-2018Kathryn Huang
 
Real Estate Board of Greater Vancouver Statistics Package October 2021
Real Estate Board of Greater Vancouver Statistics Package October 2021Real Estate Board of Greater Vancouver Statistics Package October 2021
Real Estate Board of Greater Vancouver Statistics Package October 2021VickyAulakh1
 
REBGV-Stats-Pkg-July-2022
REBGV-Stats-Pkg-July-2022REBGV-Stats-Pkg-July-2022
REBGV-Stats-Pkg-July-2022Vicky Aulakh
 
Rebgv stats-pkg-may-2021
Rebgv stats-pkg-may-2021Rebgv stats-pkg-may-2021
Rebgv stats-pkg-may-2021BC PRIME Realty
 
Real Estate Board of Greater Vancouver - Stats Package May 2021
Real Estate Board of Greater Vancouver - Stats Package May 2021Real Estate Board of Greater Vancouver - Stats Package May 2021
Real Estate Board of Greater Vancouver - Stats Package May 2021AlexanderMackenzie13
 
January 2016 rebgv stats mike stewart realtor Corrected Feb 5 2016
January 2016 rebgv stats mike stewart realtor Corrected Feb 5 2016January 2016 rebgv stats mike stewart realtor Corrected Feb 5 2016
January 2016 rebgv stats mike stewart realtor Corrected Feb 5 2016Mike Stewart
 
Rebgv stats-pkg-january-2019
Rebgv stats-pkg-january-2019Rebgv stats-pkg-january-2019
Rebgv stats-pkg-january-2019Kathryn Huang
 

Ähnlich wie REBGV Stats Package February 2021 (17)

Real Estate Board of Greater Vancouver Statistics Package February 2022
Real Estate Board of Greater Vancouver Statistics Package February 2022Real Estate Board of Greater Vancouver Statistics Package February 2022
Real Estate Board of Greater Vancouver Statistics Package February 2022
 
Supply response emerges in Metro Vancouver’s active housing market
Supply response emerges in Metro Vancouver’s active housing marketSupply response emerges in Metro Vancouver’s active housing market
Supply response emerges in Metro Vancouver’s active housing market
 
Rebgv stats-pkg-august-2021
Rebgv stats-pkg-august-2021Rebgv stats-pkg-august-2021
Rebgv stats-pkg-august-2021
 
2021 June REBGV Stats Package
2021 June REBGV Stats Package2021 June REBGV Stats Package
2021 June REBGV Stats Package
 
Greater Vancouver Realtors Statistics Package April 2024
Greater Vancouver Realtors Statistics Package April 2024Greater Vancouver Realtors Statistics Package April 2024
Greater Vancouver Realtors Statistics Package April 2024
 
Real Estate Board of Greater Vancouver Statistics Package January 2021
Real Estate Board of Greater Vancouver Statistics Package January 2021 Real Estate Board of Greater Vancouver Statistics Package January 2021
Real Estate Board of Greater Vancouver Statistics Package January 2021
 
March 2020 REBGV Statistics Package
March 2020 REBGV Statistics PackageMarch 2020 REBGV Statistics Package
March 2020 REBGV Statistics Package
 
March 2020-rebgv-stats-pkg
March 2020-rebgv-stats-pkgMarch 2020-rebgv-stats-pkg
March 2020-rebgv-stats-pkg
 
Real Estate Board of Greater Vancouver - Statistics Package for July 2021
Real Estate Board of Greater Vancouver - Statistics Package for July 2021Real Estate Board of Greater Vancouver - Statistics Package for July 2021
Real Estate Board of Greater Vancouver - Statistics Package for July 2021
 
Rebgv stats-pkg-november-2020
Rebgv stats-pkg-november-2020Rebgv stats-pkg-november-2020
Rebgv stats-pkg-november-2020
 
Rebgv stats-pkg-february-2018
Rebgv stats-pkg-february-2018Rebgv stats-pkg-february-2018
Rebgv stats-pkg-february-2018
 
Real Estate Board of Greater Vancouver Statistics Package October 2021
Real Estate Board of Greater Vancouver Statistics Package October 2021Real Estate Board of Greater Vancouver Statistics Package October 2021
Real Estate Board of Greater Vancouver Statistics Package October 2021
 
REBGV-Stats-Pkg-July-2022
REBGV-Stats-Pkg-July-2022REBGV-Stats-Pkg-July-2022
REBGV-Stats-Pkg-July-2022
 
Rebgv stats-pkg-may-2021
Rebgv stats-pkg-may-2021Rebgv stats-pkg-may-2021
Rebgv stats-pkg-may-2021
 
Real Estate Board of Greater Vancouver - Stats Package May 2021
Real Estate Board of Greater Vancouver - Stats Package May 2021Real Estate Board of Greater Vancouver - Stats Package May 2021
Real Estate Board of Greater Vancouver - Stats Package May 2021
 
January 2016 rebgv stats mike stewart realtor Corrected Feb 5 2016
January 2016 rebgv stats mike stewart realtor Corrected Feb 5 2016January 2016 rebgv stats mike stewart realtor Corrected Feb 5 2016
January 2016 rebgv stats mike stewart realtor Corrected Feb 5 2016
 
Rebgv stats-pkg-january-2019
Rebgv stats-pkg-january-2019Rebgv stats-pkg-january-2019
Rebgv stats-pkg-january-2019
 

Mehr von Vicky Aulakh

Okanagan Statistics May2023.pdf
Okanagan Statistics May2023.pdfOkanagan Statistics May2023.pdf
Okanagan Statistics May2023.pdfVicky Aulakh
 
FVREB May 2023 Statistics Package.pdf
FVREB May 2023 Statistics Package.pdfFVREB May 2023 Statistics Package.pdf
FVREB May 2023 Statistics Package.pdfVicky Aulakh
 
Metro Vancouver Stats.pdf
Metro Vancouver Stats.pdfMetro Vancouver Stats.pdf
Metro Vancouver Stats.pdfVicky Aulakh
 
Okanagan Stats June 2022
Okanagan Stats June 2022Okanagan Stats June 2022
Okanagan Stats June 2022Vicky Aulakh
 
Okanagan Stats May 2022
Okanagan Stats May 2022Okanagan Stats May 2022
Okanagan Stats May 2022Vicky Aulakh
 
VREB June 2022 Stats
VREB June 2022 StatsVREB June 2022 Stats
VREB June 2022 StatsVicky Aulakh
 
FVREB June 2022 Stats
FVREB June 2022 StatsFVREB June 2022 Stats
FVREB June 2022 StatsVicky Aulakh
 
REBGV Statistics Package May 2022
REBGV Statistics Package May 2022REBGV Statistics Package May 2022
REBGV Statistics Package May 2022Vicky Aulakh
 
VREB May 2022 Statistics Package.pdf
VREB May 2022 Statistics Package.pdfVREB May 2022 Statistics Package.pdf
VREB May 2022 Statistics Package.pdfVicky Aulakh
 
The Okanagan Real Estate April 2022 Statistics
The Okanagan Real Estate April 2022 StatisticsThe Okanagan Real Estate April 2022 Statistics
The Okanagan Real Estate April 2022 StatisticsVicky Aulakh
 
FVREB April 2022 Stats Package .pdf
FVREB April 2022 Stats Package .pdfFVREB April 2022 Stats Package .pdf
FVREB April 2022 Stats Package .pdfVicky Aulakh
 
VREB April 2022 Stats Package .pdf
VREB April 2022 Stats Package .pdfVREB April 2022 Stats Package .pdf
VREB April 2022 Stats Package .pdfVicky Aulakh
 
REBGV-Stats-Pkg-April-2022.pdf
REBGV-Stats-Pkg-April-2022.pdfREBGV-Stats-Pkg-April-2022.pdf
REBGV-Stats-Pkg-April-2022.pdfVicky Aulakh
 
March 2022 Okanagan Statistics
March 2022 Okanagan StatisticsMarch 2022 Okanagan Statistics
March 2022 Okanagan StatisticsVicky Aulakh
 
FVREB Statistics Package March 2022
FVREB Statistics Package March 2022FVREB Statistics Package March 2022
FVREB Statistics Package March 2022Vicky Aulakh
 

Mehr von Vicky Aulakh (20)

Okanagan Statistics May2023.pdf
Okanagan Statistics May2023.pdfOkanagan Statistics May2023.pdf
Okanagan Statistics May2023.pdf
 
FVREB May 2023 Statistics Package.pdf
FVREB May 2023 Statistics Package.pdfFVREB May 2023 Statistics Package.pdf
FVREB May 2023 Statistics Package.pdf
 
Metro Vancouver Stats.pdf
Metro Vancouver Stats.pdfMetro Vancouver Stats.pdf
Metro Vancouver Stats.pdf
 
FVREB July 2022
FVREB July 2022FVREB July 2022
FVREB July 2022
 
VREB July 2022
VREB July 2022VREB July 2022
VREB July 2022
 
BCRE June 2022
BCRE June 2022BCRE June 2022
BCRE June 2022
 
Okanagan Stats June 2022
Okanagan Stats June 2022Okanagan Stats June 2022
Okanagan Stats June 2022
 
Okanagan Stats May 2022
Okanagan Stats May 2022Okanagan Stats May 2022
Okanagan Stats May 2022
 
VREB June 2022 Stats
VREB June 2022 StatsVREB June 2022 Stats
VREB June 2022 Stats
 
FVREB June 2022 Stats
FVREB June 2022 StatsFVREB June 2022 Stats
FVREB June 2022 Stats
 
FVREB May 2022
FVREB May 2022FVREB May 2022
FVREB May 2022
 
REBGV Statistics Package May 2022
REBGV Statistics Package May 2022REBGV Statistics Package May 2022
REBGV Statistics Package May 2022
 
VREB May 2022 Statistics Package.pdf
VREB May 2022 Statistics Package.pdfVREB May 2022 Statistics Package.pdf
VREB May 2022 Statistics Package.pdf
 
The Okanagan Real Estate April 2022 Statistics
The Okanagan Real Estate April 2022 StatisticsThe Okanagan Real Estate April 2022 Statistics
The Okanagan Real Estate April 2022 Statistics
 
FVREB April 2022 Stats Package .pdf
FVREB April 2022 Stats Package .pdfFVREB April 2022 Stats Package .pdf
FVREB April 2022 Stats Package .pdf
 
VREB April 2022 Stats Package .pdf
VREB April 2022 Stats Package .pdfVREB April 2022 Stats Package .pdf
VREB April 2022 Stats Package .pdf
 
REBGV-Stats-Pkg-April-2022.pdf
REBGV-Stats-Pkg-April-2022.pdfREBGV-Stats-Pkg-April-2022.pdf
REBGV-Stats-Pkg-April-2022.pdf
 
BCREA.pdf
BCREA.pdfBCREA.pdf
BCREA.pdf
 
March 2022 Okanagan Statistics
March 2022 Okanagan StatisticsMarch 2022 Okanagan Statistics
March 2022 Okanagan Statistics
 
FVREB Statistics Package March 2022
FVREB Statistics Package March 2022FVREB Statistics Package March 2022
FVREB Statistics Package March 2022
 

Kürzlich hochgeladen

Enjoy Night ≽ 8448380779 ≼ Call Girls In Huda City Centre (Gurgaon)
Enjoy Night ≽ 8448380779 ≼ Call Girls In Huda City Centre (Gurgaon)Enjoy Night ≽ 8448380779 ≼ Call Girls In Huda City Centre (Gurgaon)
Enjoy Night ≽ 8448380779 ≼ Call Girls In Huda City Centre (Gurgaon)Delhi Call girls
 
9990771857 Call Girls Dwarka Sector 8 Delhi (Call Girls ) Delhi
9990771857 Call Girls  Dwarka Sector 8 Delhi (Call Girls ) Delhi9990771857 Call Girls  Dwarka Sector 8 Delhi (Call Girls ) Delhi
9990771857 Call Girls Dwarka Sector 8 Delhi (Call Girls ) Delhidelhimodel235
 
2k Shot Call girls Karol Bagh Delhi 9205541914
2k Shot Call girls Karol Bagh Delhi 92055419142k Shot Call girls Karol Bagh Delhi 9205541914
2k Shot Call girls Karol Bagh Delhi 9205541914Delhi Call girls
 
Shapoorji Pallonji Joyville Vista Pune | Spend Your Family Time Together
Shapoorji Pallonji Joyville Vista Pune | Spend Your Family Time TogetherShapoorji Pallonji Joyville Vista Pune | Spend Your Family Time Together
Shapoorji Pallonji Joyville Vista Pune | Spend Your Family Time Togetheraidasheikh47
 
Bptp The Amaario Launch Luxury Project Sector 37D Gurgaon Dwarka Expressway...
Bptp The Amaario Launch  Luxury Project  Sector 37D Gurgaon Dwarka Expressway...Bptp The Amaario Launch  Luxury Project  Sector 37D Gurgaon Dwarka Expressway...
Bptp The Amaario Launch Luxury Project Sector 37D Gurgaon Dwarka Expressway...ApartmentWala1
 
The Gale at Godrej Park World Hinjewadi Pune Brochure.pdf
The Gale at Godrej Park World Hinjewadi Pune Brochure.pdfThe Gale at Godrej Park World Hinjewadi Pune Brochure.pdf
The Gale at Godrej Park World Hinjewadi Pune Brochure.pdfPrachiRudram
 
2k Shots ≽ 9205541914 ≼ Call Girls In Sainik Farm (Delhi)
2k Shots ≽ 9205541914 ≼ Call Girls In Sainik Farm (Delhi)2k Shots ≽ 9205541914 ≼ Call Girls In Sainik Farm (Delhi)
2k Shots ≽ 9205541914 ≼ Call Girls In Sainik Farm (Delhi)Delhi Call girls
 
9990771857 Call Girls in Dwarka Sector 08 Delhi (Call Girls) Delhi
9990771857 Call Girls in Dwarka Sector 08 Delhi (Call Girls) Delhi9990771857 Call Girls in Dwarka Sector 08 Delhi (Call Girls) Delhi
9990771857 Call Girls in Dwarka Sector 08 Delhi (Call Girls) Delhidelhimodel235
 
BDSM⚡Call Girls in Sector 55 Noida Escorts >༒8448380779 Escort Service
BDSM⚡Call Girls in Sector 55 Noida Escorts >༒8448380779 Escort ServiceBDSM⚡Call Girls in Sector 55 Noida Escorts >༒8448380779 Escort Service
BDSM⚡Call Girls in Sector 55 Noida Escorts >༒8448380779 Escort ServiceDelhi Call girls
 
Best Deal Virtual Space in Satya The Hive Tata Zudio 750 Sqft 1.89 Cr All inc...
Best Deal Virtual Space in Satya The Hive Tata Zudio 750 Sqft 1.89 Cr All inc...Best Deal Virtual Space in Satya The Hive Tata Zudio 750 Sqft 1.89 Cr All inc...
Best Deal Virtual Space in Satya The Hive Tata Zudio 750 Sqft 1.89 Cr All inc...ApartmentWala1
 
9990771857 Call Girls in Dwarka Sector 3 Delhi (Call Girls) Delhi
9990771857 Call Girls in Dwarka Sector 3 Delhi (Call Girls) Delhi9990771857 Call Girls in Dwarka Sector 3 Delhi (Call Girls) Delhi
9990771857 Call Girls in Dwarka Sector 3 Delhi (Call Girls) Delhidelhimodel235
 
SVN Live 5.6.24 Weekly Property Broadcast
SVN Live 5.6.24 Weekly Property BroadcastSVN Live 5.6.24 Weekly Property Broadcast
SVN Live 5.6.24 Weekly Property BroadcastSVN International Corp.
 
TENANT SCREENING REPORT SERVICES​ How Tenant Screening Reports Work
TENANT SCREENING REPORT SERVICES​ How Tenant Screening Reports WorkTENANT SCREENING REPORT SERVICES​ How Tenant Screening Reports Work
TENANT SCREENING REPORT SERVICES​ How Tenant Screening Reports WorkTurbo Tenant
 
9990771857 Call Girls in Dwarka Sector 6 Delhi (Call Girls) Delhi
9990771857 Call Girls in Dwarka Sector 6 Delhi (Call Girls) Delhi9990771857 Call Girls in Dwarka Sector 6 Delhi (Call Girls) Delhi
9990771857 Call Girls in Dwarka Sector 6 Delhi (Call Girls) Delhidelhimodel235
 
BDSM⚡Call Girls in Sector 57 Noida Escorts >༒8448380779 Escort Service
BDSM⚡Call Girls in Sector 57 Noida Escorts >༒8448380779 Escort ServiceBDSM⚡Call Girls in Sector 57 Noida Escorts >༒8448380779 Escort Service
BDSM⚡Call Girls in Sector 57 Noida Escorts >༒8448380779 Escort ServiceDelhi Call girls
 
Call Girls In Krishna Nagar Delhi (Escort)↫8447779280↬@SHOT 1500- NIGHT 5500→...
Call Girls In Krishna Nagar Delhi (Escort)↫8447779280↬@SHOT 1500- NIGHT 5500→...Call Girls In Krishna Nagar Delhi (Escort)↫8447779280↬@SHOT 1500- NIGHT 5500→...
Call Girls In Krishna Nagar Delhi (Escort)↫8447779280↬@SHOT 1500- NIGHT 5500→...asmaqueen5
 
9990771857 Call Girls in Dwarka Sector 137 Noida (Call Girls) Delhi
9990771857 Call Girls in Dwarka Sector 137 Noida (Call Girls) Delhi9990771857 Call Girls in Dwarka Sector 137 Noida (Call Girls) Delhi
9990771857 Call Girls in Dwarka Sector 137 Noida (Call Girls) Delhidelhimodel235
 
Majestique Viman Nagar Pune Brochure.pdf
Majestique Viman Nagar Pune Brochure.pdfMajestique Viman Nagar Pune Brochure.pdf
Majestique Viman Nagar Pune Brochure.pdfBabyrudram
 
Call Girls In Vasant Vihar Delhi 💯Call Us 🔝8264348440🔝
Call Girls In Vasant Vihar Delhi 💯Call Us 🔝8264348440🔝Call Girls In Vasant Vihar Delhi 💯Call Us 🔝8264348440🔝
Call Girls In Vasant Vihar Delhi 💯Call Us 🔝8264348440🔝soniya singh
 
Call Girls In Laxmi Nagar Delhi +91-8447779280! !Best Woman Seeking Man Escor...
Call Girls In Laxmi Nagar Delhi +91-8447779280! !Best Woman Seeking Man Escor...Call Girls In Laxmi Nagar Delhi +91-8447779280! !Best Woman Seeking Man Escor...
Call Girls In Laxmi Nagar Delhi +91-8447779280! !Best Woman Seeking Man Escor...asmaqueen5
 

Kürzlich hochgeladen (20)

Enjoy Night ≽ 8448380779 ≼ Call Girls In Huda City Centre (Gurgaon)
Enjoy Night ≽ 8448380779 ≼ Call Girls In Huda City Centre (Gurgaon)Enjoy Night ≽ 8448380779 ≼ Call Girls In Huda City Centre (Gurgaon)
Enjoy Night ≽ 8448380779 ≼ Call Girls In Huda City Centre (Gurgaon)
 
9990771857 Call Girls Dwarka Sector 8 Delhi (Call Girls ) Delhi
9990771857 Call Girls  Dwarka Sector 8 Delhi (Call Girls ) Delhi9990771857 Call Girls  Dwarka Sector 8 Delhi (Call Girls ) Delhi
9990771857 Call Girls Dwarka Sector 8 Delhi (Call Girls ) Delhi
 
2k Shot Call girls Karol Bagh Delhi 9205541914
2k Shot Call girls Karol Bagh Delhi 92055419142k Shot Call girls Karol Bagh Delhi 9205541914
2k Shot Call girls Karol Bagh Delhi 9205541914
 
Shapoorji Pallonji Joyville Vista Pune | Spend Your Family Time Together
Shapoorji Pallonji Joyville Vista Pune | Spend Your Family Time TogetherShapoorji Pallonji Joyville Vista Pune | Spend Your Family Time Together
Shapoorji Pallonji Joyville Vista Pune | Spend Your Family Time Together
 
Bptp The Amaario Launch Luxury Project Sector 37D Gurgaon Dwarka Expressway...
Bptp The Amaario Launch  Luxury Project  Sector 37D Gurgaon Dwarka Expressway...Bptp The Amaario Launch  Luxury Project  Sector 37D Gurgaon Dwarka Expressway...
Bptp The Amaario Launch Luxury Project Sector 37D Gurgaon Dwarka Expressway...
 
The Gale at Godrej Park World Hinjewadi Pune Brochure.pdf
The Gale at Godrej Park World Hinjewadi Pune Brochure.pdfThe Gale at Godrej Park World Hinjewadi Pune Brochure.pdf
The Gale at Godrej Park World Hinjewadi Pune Brochure.pdf
 
2k Shots ≽ 9205541914 ≼ Call Girls In Sainik Farm (Delhi)
2k Shots ≽ 9205541914 ≼ Call Girls In Sainik Farm (Delhi)2k Shots ≽ 9205541914 ≼ Call Girls In Sainik Farm (Delhi)
2k Shots ≽ 9205541914 ≼ Call Girls In Sainik Farm (Delhi)
 
9990771857 Call Girls in Dwarka Sector 08 Delhi (Call Girls) Delhi
9990771857 Call Girls in Dwarka Sector 08 Delhi (Call Girls) Delhi9990771857 Call Girls in Dwarka Sector 08 Delhi (Call Girls) Delhi
9990771857 Call Girls in Dwarka Sector 08 Delhi (Call Girls) Delhi
 
BDSM⚡Call Girls in Sector 55 Noida Escorts >༒8448380779 Escort Service
BDSM⚡Call Girls in Sector 55 Noida Escorts >༒8448380779 Escort ServiceBDSM⚡Call Girls in Sector 55 Noida Escorts >༒8448380779 Escort Service
BDSM⚡Call Girls in Sector 55 Noida Escorts >༒8448380779 Escort Service
 
Best Deal Virtual Space in Satya The Hive Tata Zudio 750 Sqft 1.89 Cr All inc...
Best Deal Virtual Space in Satya The Hive Tata Zudio 750 Sqft 1.89 Cr All inc...Best Deal Virtual Space in Satya The Hive Tata Zudio 750 Sqft 1.89 Cr All inc...
Best Deal Virtual Space in Satya The Hive Tata Zudio 750 Sqft 1.89 Cr All inc...
 
9990771857 Call Girls in Dwarka Sector 3 Delhi (Call Girls) Delhi
9990771857 Call Girls in Dwarka Sector 3 Delhi (Call Girls) Delhi9990771857 Call Girls in Dwarka Sector 3 Delhi (Call Girls) Delhi
9990771857 Call Girls in Dwarka Sector 3 Delhi (Call Girls) Delhi
 
SVN Live 5.6.24 Weekly Property Broadcast
SVN Live 5.6.24 Weekly Property BroadcastSVN Live 5.6.24 Weekly Property Broadcast
SVN Live 5.6.24 Weekly Property Broadcast
 
TENANT SCREENING REPORT SERVICES​ How Tenant Screening Reports Work
TENANT SCREENING REPORT SERVICES​ How Tenant Screening Reports WorkTENANT SCREENING REPORT SERVICES​ How Tenant Screening Reports Work
TENANT SCREENING REPORT SERVICES​ How Tenant Screening Reports Work
 
9990771857 Call Girls in Dwarka Sector 6 Delhi (Call Girls) Delhi
9990771857 Call Girls in Dwarka Sector 6 Delhi (Call Girls) Delhi9990771857 Call Girls in Dwarka Sector 6 Delhi (Call Girls) Delhi
9990771857 Call Girls in Dwarka Sector 6 Delhi (Call Girls) Delhi
 
BDSM⚡Call Girls in Sector 57 Noida Escorts >༒8448380779 Escort Service
BDSM⚡Call Girls in Sector 57 Noida Escorts >༒8448380779 Escort ServiceBDSM⚡Call Girls in Sector 57 Noida Escorts >༒8448380779 Escort Service
BDSM⚡Call Girls in Sector 57 Noida Escorts >༒8448380779 Escort Service
 
Call Girls In Krishna Nagar Delhi (Escort)↫8447779280↬@SHOT 1500- NIGHT 5500→...
Call Girls In Krishna Nagar Delhi (Escort)↫8447779280↬@SHOT 1500- NIGHT 5500→...Call Girls In Krishna Nagar Delhi (Escort)↫8447779280↬@SHOT 1500- NIGHT 5500→...
Call Girls In Krishna Nagar Delhi (Escort)↫8447779280↬@SHOT 1500- NIGHT 5500→...
 
9990771857 Call Girls in Dwarka Sector 137 Noida (Call Girls) Delhi
9990771857 Call Girls in Dwarka Sector 137 Noida (Call Girls) Delhi9990771857 Call Girls in Dwarka Sector 137 Noida (Call Girls) Delhi
9990771857 Call Girls in Dwarka Sector 137 Noida (Call Girls) Delhi
 
Majestique Viman Nagar Pune Brochure.pdf
Majestique Viman Nagar Pune Brochure.pdfMajestique Viman Nagar Pune Brochure.pdf
Majestique Viman Nagar Pune Brochure.pdf
 
Call Girls In Vasant Vihar Delhi 💯Call Us 🔝8264348440🔝
Call Girls In Vasant Vihar Delhi 💯Call Us 🔝8264348440🔝Call Girls In Vasant Vihar Delhi 💯Call Us 🔝8264348440🔝
Call Girls In Vasant Vihar Delhi 💯Call Us 🔝8264348440🔝
 
Call Girls In Laxmi Nagar Delhi +91-8447779280! !Best Woman Seeking Man Escor...
Call Girls In Laxmi Nagar Delhi +91-8447779280! !Best Woman Seeking Man Escor...Call Girls In Laxmi Nagar Delhi +91-8447779280! !Best Woman Seeking Man Escor...
Call Girls In Laxmi Nagar Delhi +91-8447779280! !Best Woman Seeking Man Escor...
 

REBGV Stats Package February 2021