
Empfohlen
Empfohlen
Weitere ähnliche Inhalte
Was ist angesagt?
Was ist angesagt? (20)
Ähnlich wie REBGV Statistics Package May 2020
Ähnlich wie REBGV Statistics Package May 2020 (20)
Mehr von Vicky Aulakh
Mehr von Vicky Aulakh (20)
Kürzlich hochgeladen
Kürzlich hochgeladen (20)
REBGV Statistics Package May 2020
- 1. News Release FOR IMMEDIATE RELEASE: Home prices remain steady, buyers and sellers become more comfortable operating in today’s market VANCOUVER, BC – June 2, 2020 – Metro Vancouver* home prices have remained steady since provincial health officials implemented physical distancing requirements in March. The Real Estate Board of Greater Vancouver (REBGV) reports that the MLS® Home Price Index1 composite benchmark price for all residential properties in Metro Vancouver today is $1,028,400. This is virtually unchanged from April 2020, a 1.4 per cent increase over the last three months, and a 2.9 per cent increase compared to May 2019. "Home prices have been stable during the COVID-19 period," Colette Gerber, REBGV Chair said. "While we’re seeing a variety of long-term projections for the market, it's critical to understand the facts and trends as they emerge." Residential home sales in the region totalled 1,485 in May 2020, a 43.7 per cent decrease from the 2,638 sales recorded in May 2019 and a 33.9 per cent increase from the 1,109 homes sold in April 2020. Last month’s sales were 54.4 per cent below the 10-year May sales average. "Home sale and listing activity is down compared to typical, long-term levels and up compared to the activity we saw in April 2020," Gerber said. "Home buyers and sellers are adapting today, becoming more comfortable operating with the physical distancing requirements that are in place in the market." There were 3,684 detached, attached and apartment properties newly listed for sale on the Multiple Listing Service® (MLS®) in Metro Vancouver in May 2020. This represents a 37.1 per cent decrease compared to the 5,861 homes listed in May 2019 and a 59.3 per cent increase compared to April 2020 when 2,313 homes were listed. "Home buyers and sellers are working with their REALTORS® to use new tools to complete different stages of the real estate transaction virtually," Gerber said. “When in-person interactions are necessary, we’re working with our clients to follow the physical distancing requirements set out by WorkSafeBC and the provincial health officer." The total number of homes currently listed for sale on the MLS® system in Metro Vancouver is 9,927, a 32.4 per cent decrease compared to May 2019 (14,685) and a 5.7 per cent increase compared to April 2020 (9,389).
- 2. For all housing types, the sales-to-active listings ratio for May 2020 is 15 per cent. By housing type, the ratio is 13.5 per cent for detached homes, 18.9 per cent for townhomes, and 14.8 per cent for apartments. Generally, analysts say downward pressure on home prices occurs when the ratio dips below 12 per cent for a sustained period, while home prices often experience upward pressure when it surpasses 20 per cent over several months. Sales and benchmark prices by property type Sales of detached homes in May 2020 reached 534, a 41.5 per cent decrease from the 913 detached sales recorded in May 2019. The benchmark price for detached properties is $1,456,700. This is a 0.3 per cent increase from April 2020, a 2.2 per cent increase over the past three months, and a 2.9 per cent increase compared to May 2019. Sales of apartment homes reached 653 in May 2020, a 47.6 per cent decrease compared to the 1,246 sales in May 2019. The benchmark price of an apartment home is $686,500. This is a 0.3 per cent decrease from April 2020, a 0.9 per cent increase over the past three months, and a three per cent increase compared to May 2019. Attached home sales in May 2020 totalled 298, a 37.8 per cent decrease compared to the 479 sales in May 2019. The benchmark price of an attached home is $792,700. This is a 0.2 per cent increase from April 2020, a 1.2 per cent increase over the past three months, and a 1.8 per cent increase compared to May 2019. -30- *Editor’s Note: Areas covered by the Real Estate Board of Greater Vancouver include: Burnaby, Coquitlam, Maple Ridge, New Westminster, North Vancouver, Pitt Meadows, Port Coquitlam, Port Moody, Richmond, South Delta, Squamish, Sunshine Coast, Vancouver, West Vancouver, and Whistler. MLS® Home Price Index 2020 update 1.) The national MLS® Home Price Index (MLS® HPI) operations group underwent an annual review of the model in May. In line with best statistical practices, the MLS® HPI is reviewed annually. HPI coverage was extended to neighbourhoods where sales volumes picked up enough to support benchmark price tracking and was discontinued for neighbourhoods where sales became too sparse to support benchmark price calculations. REBGV also modified sub-areas in Ladner and Tsawwassen to better reflect changes in these communities over time, changing the composition of neighbourhoods in these areas. To ensure HPI coverage is consistent and comparable, historical aggregate and composite data has been recalculated based on revised and consistent coverage. The real estate industry is a key economic driver in British Columbia. In 2019, 25,351 homes changed ownership in the Board’s area, generating $1.8 billion in economic spin-off activity and an estimated 12,910 jobs. The total dollar value of residential sales transacted through the MLS® system in Greater Vancouver totalled $25.3 billion in 2019. The Real Estate Board of Greater Vancouver is an association representing more than 14,000 REALTORS® and their companies. The Board provides a variety of member services, including the Multiple Listing Service®. For
- 3. more information on real estate, statistics, and buying or selling a home, contact a local REALTOR® or visit www.rebgv.org. For more information please contact: Craig Munn Manager, Communication Real Estate Board of Greater Vancouver 604.730.3146 cmunn@rebgv.org
- 4. Property Type Area Benchmark Price Price Index 1 Month Change % 3 Month Change % 6 Month Change % 1 Year Change % 3 Year Change % 5 Year Change % 10 Year Change % Residential / Composite Lower Mainland $963,700 270.0 -0.1% 1.5% 4.0% 2.5% 8.2% 56.3% 80.6% Greater Vancouver $1,028,400 269.8 0.0% 1.4% 4.2% 2.9% 4.6% 48.5% 76.2% Bowen Island $956,200 207.3 2.4% 5.5% -0.3% -1.0% 9.8% 59.2% 51.0% Burnaby East $972,000 269.6 1.0% 2.5% 4.5% 3.4% 4.2% 46.6% 76.0% Burnaby North $895,800 270.5 0.3% 1.8% 4.3% 1.8% 6.2% 53.6% 81.7% Burnaby South $974,700 275.3 0.8% 0.9% 3.5% 0.3% 3.4% 50.0% 80.9% Coquitlam $935,900 277.6 0.3% 2.4% 5.9% 4.6% 10.5% 60.9% 93.4% Ladner $839,700 236.4 0.5% 2.5% 5.9% 3.4% -0.6% 33.6% 57.0% Maple Ridge $779,100 248.1 0.5% 3.1% 4.6% 2.4% 16.5% 73.9% 79.8% New Westminster $662,300 291.4 0.2% 1.9% 4.0% 0.4% 14.9% 70.0% 88.1% North Vancouver $1,067,900 240.0 0.0% 0.7% 4.5% 2.8% 0.9% 40.4% 65.9% Pitt Meadows $761,400 276.8 -0.2% 2.3% 5.0% 2.9% 20.9% 75.1% 93.6% Port Coquitlam $768,900 263.2 -0.7% 2.1% 4.1% 3.1% 11.3% 64.9% 80.3% Port Moody $933,100 257.9 -0.4% 2.5% 4.5% 3.0% 12.0% 61.1% 82.5% Richmond $934,900 279.1 -0.1% 1.5% 3.6% 2.2% 3.0% 48.1% 72.8% Squamish $755,200 240.3 -1.5% -2.6% -2.8% -1.2% 8.1% 65.6% 81.1% Sunshine Coast $590,500 206.9 1.9% 5.5% -0.5% -2.5% 9.6% 60.6% 51.8% Tsawwassen $928,100 240.6 -0.9% -0.6% 3.5% 1.0% -4.7% 34.1% 65.2% Vancouver East $1,089,000 323.6 -0.4% 0.6% 4.9% 3.5% 2.1% 48.2% 93.2% Vancouver West $1,283,000 267.9 -0.3% 0.8% 5.1% 4.2% -1.4% 36.3% 68.9% West Vancouver $2,142,500 235.9 1.7% 2.5% 2.3% 3.6% -14.5% 13.8% 60.0% Whistler $896,800 209.0 -1.5% -2.9% -2.3% 0.9% 16.1% 71.5% 60.3% Single Family Detached Lower Mainland $1,252,000 267.0 0.1% 2.1% 3.7% 2.9% -0.8% 43.2% 79.7% Greater Vancouver $1,456,700 269.1 0.3% 2.2% 3.5% 2.9% -6.6% 32.0% 73.1% Bowen Island $956,200 207.3 2.4% 5.5% -0.3% -1.0% 9.8% 59.2% 51.0% Burnaby East $1,244,600 278.3 2.0% 4.1% 7.3% 7.0% 0.5% 41.8% 81.7% Burnaby North $1,472,700 284.8 0.2% 3.8% 6.7% 4.6% -5.8% 31.5% 84.8% Burnaby South $1,529,000 292.7 1.8% 3.4% 2.9% 1.4% -9.1% 30.0% 87.0% Coquitlam $1,215,200 269.7 -0.2% 3.3% 5.2% 4.4% -1.4% 43.8% 85.7% Ladner $983,500 235.4 0.3% 2.6% 7.4% 3.8% -2.3% 29.9% 60.4% Maple Ridge $848,700 241.8 0.8% 3.2% 5.6% 3.2% 11.6% 69.8% 80.2% New Westminster $1,098,800 274.1 1.5% 4.4% 7.3% 5.0% -1.1% 41.7% 75.7% North Vancouver $1,543,800 243.1 -0.1% -0.2% 3.1% 2.4% -8.5% 30.1% 68.7% Pitt Meadows $920,500 259.4 -0.8% 4.1% 5.5% 4.5% 11.7% 63.6% 84.2% Port Coquitlam $969,100 258.4 -1.3% 1.7% 4.1% 5.1% -0.5% 49.3% 79.6% Port Moody $1,453,400 268.4 0.8% 3.0% 4.2% 3.4% 1.7% 47.1% 84.3% Richmond $1,528,400 296.1 -0.1% 1.4% 2.5% 1.6% -10.6% 30.6% 71.1% Squamish $952,800 251.1 -1.2% -2.3% -2.7% 0.6% 4.2% 65.3% 81.8% Sunshine Coast $586,300 205.4 1.9% 5.4% -0.3% -2.3% 9.5% 60.5% 50.7% Tsawwassen $1,087,800 242.4 -1.5% -1.1% 4.0% 2.2% -7.1% 31.0% 70.1% Vancouver East $1,447,800 318.9 -0.1% 1.2% 4.2% 5.6% -5.6% 32.0% 96.2% Vancouver West $3,041,100 307.6 0.8% 3.0% 3.3% 2.2% -16.1% 17.4% 67.4% West Vancouver $2,620,700 247.4 2.1% 3.0% 3.0% 4.1% -15.3% 13.2% 69.3% Whistler $1,665,700 231.7 1.3% -0.9% 1.9% 5.7% 9.7% 62.9% 66.3% HOW TO READ THE TABLE: • Benchmark Price: Estimated sale price of a benchmark property. Benchmarks represent a typical property within each market. • Price Index: Index numbers estimate the percentage change in price on typical and constant quality properties over time. All figures are based on past sales. • x Month/Year Change %: Percentage change of index over a period of x month(s)/year(s) * In January 2005, the indexes are set to 100. Townhome properties are similar to Attached properties, a category that was used in the previous MLSLink HPI, but do not included duplexes. The above info is deemed reliable, but is not guaranteed. All dollar amounts in CDN. May 2020* * MLS®, Multiple Listing Service®, and all related graphics are trademarks of The Canadian Real Estate Association 1 of 18
- 5. Property Type Area Benchmark Price Price Index 1 Month Change % 3 Month Change % 6 Month Change % 1 Year Change % 3 Year Change % 5 Year Change % 10 Year Change % May 2020* Townhouse Lower Mainland $686,500 249.0 0.3% 1.5% 2.9% 1.8% 11.3% 60.6% 71.6% Greater Vancouver $792,700 254.3 0.2% 1.2% 2.7% 1.8% 8.3% 53.2% 69.3% Burnaby East $669,500 247.3 1.8% 1.6% 1.6% 2.0% 9.8% 51.6% 65.8% Burnaby North $719,300 268.5 -1.2% -1.2% -1.3% -1.5% 6.6% 53.7% 72.3% Burnaby South $773,400 266.4 -1.0% -0.1% 0.5% -1.0% 4.9% 52.6% 71.4% Coquitlam $687,300 252.2 1.5% 2.2% 6.7% 2.4% 12.8% 60.3% 79.1% Ladner $654,100 234.6 0.9% 2.8% 4.7% 5.3% -2.3% 33.7% 48.0% Maple Ridge $548,400 254.6 0.6% 4.7% 3.6% 0.6% 18.0% 75.5% 77.2% New Westminster $745,600 273.6 1.7% 1.9% 4.2% 5.8% 11.9% 56.2% 76.3% North Vancouver $974,200 236.7 -0.9% 2.8% 4.0% 2.2% 2.7% 52.4% 63.8% Pitt Meadows $633,000 273.9 0.8% 3.2% 7.3% 4.5% 22.5% 76.1% 93.6% Port Coquitlam $647,200 245.0 -0.8% 4.2% 4.7% 0.7% 11.4% 60.9% 71.8% Port Moody $648,600 219.2 0.4% 3.0% 4.9% 0.7% 15.6% 46.5% 55.6% Richmond $793,500 260.6 -0.1% 1.6% 4.2% 2.6% 5.0% 48.2% 65.7% Squamish $683,100 224.6 -0.4% -4.6% -3.6% -1.5% 14.9% 63.8% 79.4% Tsawwassen $635,900 249.3 1.3% 1.7% 4.0% 5.1% -0.9% 43.2% 58.2% Vancouver East $905,000 287.8 1.3% 0.4% 4.1% 2.7% 5.0% 50.7% 80.8% Vancouver West $1,125,000 263.0 0.1% -1.3% -0.8% 0.8% -0.5% 40.3% 68.7% Whistler $907,900 218.9 -0.3% -4.5% -3.5% 3.1% 21.6% 72.5% 75.8% Apartment Lower Mainland $657,300 281.6 -0.5% 1.0% 4.6% 2.3% 18.3% 73.4% 84.8% Greater Vancouver $686,500 274.5 -0.3% 0.9% 5.0% 3.0% 14.4% 66.3% 80.4% Burnaby East $746,500 286.4 -0.5% 1.7% 4.0% -0.2% 9.4% 58.1% 75.5% Burnaby North $623,500 266.2 0.8% 1.7% 4.6% 1.4% 16.9% 77.6% 85.2% Burnaby South $678,900 272.6 0.9% 0.4% 4.9% 0.4% 11.2% 66.7% 82.8% Coquitlam $534,300 293.2 0.3% 2.1% 3.1% 3.3% 23.9% 86.8% 105.8% Ladner $515,500 240.7 0.3% 1.5% 3.4% -1.3% 6.9% 46.2% 55.1% Maple Ridge $360,500 257.4 -0.1% 1.3% 3.8% 2.8% 31.7% 82.2% 75.1% New Westminster $524,700 297.3 -0.3% 1.5% 3.4% -0.8% 19.8% 82.1% 91.7% North Vancouver $577,200 235.4 0.5% 0.6% 5.8% 3.6% 12.8% 52.8% 62.2% Pitt Meadows $500,100 294.9 -0.1% 1.4% 3.7% 1.4% 28.6% 85.0% 98.3% Port Coquitlam $463,700 277.3 -0.4% 1.5% 3.5% 2.9% 23.8% 87.2% 83.3% Port Moody $661,100 275.5 -1.5% 2.2% 5.0% 4.8% 21.1% 86.7% 98.9% Richmond $652,800 279.5 0.0% 1.7% 4.1% 2.3% 17.8% 73.5% 80.1% Squamish $480,000 236.6 -3.1% -1.5% -3.4% -5.1% 11.9% 76.8% 81.0% Tsawwassen $548,000 236.0 0.7% 1.0% 3.0% -2.0% 6.7% 45.8% 53.3% Vancouver East $595,300 334.6 -1.2% -0.1% 4.9% 1.6% 9.7% 68.7% 89.8% Vancouver West $801,300 260.0 -0.6% 0.6% 6.8% 5.6% 7.4% 52.0% 72.3% West Vancouver $1,006,000 204.4 1.0% -0.8% -1.6% -1.6% -5.4% 30.3% 36.4% Whistler $479,700 187.9 -4.5% -2.9% -3.9% -4.1% 15.6% 83.9% 43.7% HOW TO READ THE TABLE: • Benchmark Price: Estimated sale price of a benchmark property. Benchmarks represent a typical property within each market. • Price Index: Index numbers estimate the percentage change in price on typical and constant quality properties over time. All figures are based on past sales. • x Month/Year Change %: Percentage change of index over a period of x month(s)/year(s) In January 2005, the indexes are set to 100. * Townhome properties are similar to attached properties, a category that was used in the previous MLSLink HPI, but do not included duplexes. Lower Mainland includes areas serviced by both Real Estate Board of Greater Vancouver & Fraser Valley Real Estate Board. The above info is deemed reliable, but is not guaranteed. All dollar amounts in CDN. * MLS®, Multiple Listing Service®, and all related graphics are trademarks of The Canadian Real Estate Association 2 of 18
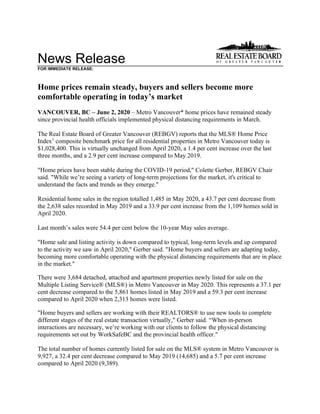
- 6. C:DATAMonthEndHpiexporthi_resgv-hpi2.tifGreaterVancouver 5YearTrend 60 110 160 210 260 310 May 2015 Jul 2015 Sep 2015 Nov 2015 Jan 2016 Mar 2016 May 2016 Jul 2016 Sep 2016 Nov 2016 Jan 2017 Mar 2017 May 2017 Jul 2017 Sep 2017 Nov 2017 Jan 2018 Mar 2018 May 2018 Jul 2018 Sep 2018 Nov 2018 Jan 2019 Mar 2019 May 2019 Jul 2019 Sep 2019 Nov 2019 Jan 2020 Mar 2020 May 2020 Price Index ResidentialDetachedTownhouseApartment Jan2005HPI=100
- 9. Listing & Sales Activity Summary Listings Sales 1 2 3 Col. 2 & 3 5 6 7 Col. 6 & 7 9 10 Col. 9 & 10 May Apr May Percentage May Apr May Percentage Mar 2019 - Mar 2020 - Percentage 2019 2020 2020 Variance 2019 2020 2020 Variance May 2019 May 2020 Variance BURNABY % % % DETACHED 200 59 80 35.6 67 26 37 42.3 156 132 -15.4 ATTACHED 127 55 67 21.8 58 25 34 36.0 136 117 -14.0 APARTMENTS 317 156 181 16.0 154 56 89 58.9 368 315 -14.4 COQUITLAM DETACHED 223 52 125 140.4 71 34 48 41.2 184 155 -15.8 ATTACHED 100 28 91 225.0 35 17 35 105.9 96 101 5.2 APARTMENTS 186 106 149 40.6 98 42 49 16.7 219 170 -22.4 DELTA DETACHED 94 35 69 97.1 38 23 37 60.9 84 100 19.0 ATTACHED 31 24 17 -29.2 16 7 11 57.1 45 32 -28.9 APARTMENTS 53 16 49 206.3 25 11 7 -36.4 36 35 -2.8 MAPLE RIDGE/PITT MEADOWS DETACHED 245 103 114 10.7 111 50 68 36.0 247 222 -10.1 ATTACHED 102 37 64 73.0 54 27 37 37.0 147 130 -11.6 APARTMENTS 59 29 62 113.8 45 24 27 12.5 105 80 -23.8 NORTH VANCOUVER DETACHED 196 77 134 74.0 105 38 51 34.2 228 158 -30.7 ATTACHED 91 55 51 -7.3 45 12 30 150.0 98 77 -21.4 APARTMENTS 225 87 152 74.7 106 45 55 22.2 243 199 -18.1 NEW WESTMINSTER DETACHED 50 21 34 61.9 26 10 20 100.0 51 51 0.0 ATTACHED 24 11 19 72.7 8 12 3 -75.0 22 31 40.9 APARTMENTS 198 56 102 82.1 93 38 49 28.9 243 168 -30.9 PORT MOODY/BELCARRA DETACHED 50 16 31 93.8 23 6 15 150.0 43 37 -14.0 ATTACHED 34 15 21 40.0 15 8 14 75.0 38 38 0.0 APARTMENTS 39 24 41 70.8 24 13 17 30.8 76 52 -31.6 PORT COQUITLAM DETACHED 61 26 30 15.4 41 16 30 87.5 78 74 -5.1 ATTACHED 57 23 27 17.4 36 13 9 -30.8 72 52 -27.8 APARTMENTS 66 28 31 10.7 54 13 21 61.5 107 72 -32.7 RICHMOND DETACHED 252 72 115 59.7 82 36 41 13.9 177 174 -1.7 ATTACHED 167 51 90 76.5 55 37 48 29.7 127 158 24.4 APARTMENTS 336 117 203 73.5 133 64 63 -1.6 316 292 -7.6 SUNSHINE COAST DETACHED 145 38 98 157.9 47 26 28 7.7 114 98 -14.0 ATTACHED 20 4 8 100.0 6 0 2 200.0 16 13 -18.8 APARTMENTS 16 2 7 250.0 9 3 1 -66.7 30 7 -76.7 SQUAMISH DETACHED 38 18 36 100.0 21 10 12 20.0 59 40 -32.2 ATTACHED 31 16 20 25.0 17 7 6 -14.3 45 23 -48.9 APARTMENTS 41 25 21 -16.0 12 3 4 33.3 35 14 -60.0 VANCOUVER EAST DETACHED 227 80 109 36.3 124 49 64 30.6 243 222 -8.6 ATTACHED 103 45 76 68.9 60 17 25 47.1 122 89 -27.0 APARTMENTS 275 121 200 65.3 142 54 76 40.7 350 266 -24.0 VANCOUVER WEST DETACHED 220 64 116 81.3 86 37 51 37.8 213 194 -8.9 ATTACHED 144 63 77 22.2 55 29 36 24.1 134 117 -12.7 APARTMENTS 689 319 546 71.2 319 129 177 37.2 787 614 -22.0 WHISTLER/PEMBERTON DETACHED 29 11 21 90.9 8 3 3 0.0 27 18 -33.3 ATTACHED 28 17 27 58.8 15 6 5 -16.7 55 21 -61.8 APARTMENTS 28 18 31 72.2 21 3 6 100.0 62 25 -59.7 WEST VANCOUVER/HOWE SOUND DETACHED 168 58 96 65.5 56 22 27 22.7 117 90 -23.1 ATTACHED 12 6 8 33.3 4 1 3 200.0 9 10 11.1 APARTMENTS 49 23 34 47.8 11 5 12 140.0 27 26 -3.7 GRAND TOTALS DETACHED 2198 730 1208 65.5 906 386 532 37.8 2021 1765 -12.7 ATTACHED 1071 450 663 47.3 479 218 298 36.7 1162 1009 -13.2 APARTMENTS 2577 1127 1809 60.5 1246 503 653 29.8 3004 2335 -22.3