
Empfohlen
Empfohlen
Weitere ähnliche Inhalte
Was ist angesagt?
Was ist angesagt? (20)
Ähnlich wie REBGV Statistics Package June 2020
Ähnlich wie REBGV Statistics Package June 2020 (18)
Mehr von Vicky Aulakh
Mehr von Vicky Aulakh (20)
Kürzlich hochgeladen
Kürzlich hochgeladen (20)
REBGV Statistics Package June 2020
- 1. News Release FOR IMMEDIATE RELEASE: Steady increases in home sale and listing activity continue in June VANCOUVER, BC – July 3, 2020 – Home buyers and sellers have gradually become more active in each month of the COVID-19 pandemic. In June, home sale and listing activity in Metro Vancouver* returned to more historically typical levels. The Real Estate Board of Greater Vancouver (REBGV) reports that residential home sales in the region totalled 2,443 in June 2020, a 17.6 per cent increase from the 2,077 sales recorded in June 2019, and a 64.5 per cent increase from the 1,485 homes sold in May 2020. Last month’s sales were 21.9 per cent below the 10-year June sales average. “REALTORS® continue to optimize new technology tools and practices to help their clients meet their housing needs in a safe and responsible way,” Colette Gerber, REBGV Chair said “Over the last three months, home buyers and sellers have become more comfortable operating within the physical distancing and other safety protocols in place.” There were 5,787 detached, attached and apartment properties newly listed for sale on the Multiple Listing Service® (MLS®) in Metro Vancouver in June 2020. This represents a 21.8 per cent increase compared to the 4,751 homes listed in June 2019 and a 57.1 per cent increase compared to May 2020 when 3,684 homes were listed. The total number of homes currently listed for sale on the MLS® system in Metro Vancouver is 11,424, a 23.7 per cent decrease compared to June 2019 (14,968) and a 15.1 per cent increase compared to May 2020 (9,927). “Much more of the real estate transaction is happening virtually today. Before considering an in- person showing, REALTORS® are helping potential buyers pre-screen homes more thoroughly by taking video tours, reviewing floorplans and an increased number of high-resolution images, as well as often driving through the neighborhood.” For all property types, the sales-to-active listings ratio for June 2020 is 21.4 per cent. By property type, the ratio is 19.9 per cent for detached homes, 25.2 per cent for townhomes, and 21.3 per cent for apartments. Generally, analysts say downward pressure on home prices occurs when the ratio dips below 12 per cent for a sustained period, while home prices often experience upward pressure when it surpasses 20 per cent over several months.
- 2. “Home prices have remained steady with minimal fluctuation over the last few months,” Gerber said. “With increasing demand, REALTORS® have begun seeing multiple offers for homes priced competitively for today’s market.” The MLS® Home Price Index composite benchmark price for all residential properties in Metro Vancouver is currently $1,025,300. This represents a 3.5 per cent increase over June 2019 and a 0.3 per cent decrease compared to May 2020. Sales of detached homes in June 2020 reached 866, a 16.1 per cent increase from the 746 detached sales recorded in June 2019. The benchmark price for a detached home is $1,464,200. This represents a 3.6 per cent increase from June 2019 and a 0.5 per cent increase compared to May 2020. Sales of apartment homes reached 1,105 in June 2020, a 17.4 per cent increase compared to the 941 sales in June 2019. The benchmark price of an apartment property is $680,800. This represents a 3.6 per cent increase from June 2019 and a 0.8 per cent decrease compared to May 2020. Attached home sales in June 2020 totalled 472, a 21 per cent increase compared to the 390 sales in June 2019. The benchmark price of an attached home is $790,800. This represents a 2.3 per cent increase from June 2019 and a 0.2 per cent decrease compared to May 2020. -30- *Editor’s Note: Areas covered by the Real Estate Board of Greater Vancouver include: Burnaby, Coquitlam, Maple Ridge, New Westminster, North Vancouver, Pitt Meadows, Port Coquitlam, Port Moody, Richmond, South Delta, Squamish, Sunshine Coast, Vancouver, West Vancouver, and Whistler. The real estate industry is a key economic driver in British Columbia. In 2019, 25,351 homes changed ownership in the Board’s area, generating $1.8 billion in economic spin-off activity and an estimated 12,910 jobs. The total dollar value of residential sales transacted through the MLS® system in Greater Vancouver totalled $25.3 billion in 2019. The Real Estate Board of Greater Vancouver is an association representing more than 14,000 REALTORS® and their companies. The Board provides a variety of member services, including the Multiple Listing Service®. For more information on real estate, statistics, and buying or selling a home, contact a local REALTOR® or visit www.rebgv.org. For more information please contact: Craig Munn Manager, Communication Real Estate Board of Greater Vancouver 604.730.3146 cmunn@rebgv.org
- 3. Property Type Area Benchmark Price Price Index 1 Month Change % 3 Month Change % 6 Month Change % 1 Year Change % 3 Year Change % 5 Year Change % 10 Year Change % Residential / Composite Lower Mainland $963,700 270.0 0.0% 0.1% 3.6% 3.3% 6.1% 54.3% 81.5% Greater Vancouver $1,025,300 269.0 -0.3% -0.2% 3.2% 3.5% 2.4% 46.0% 76.7% Bowen Island $972,800 210.9 1.7% 5.2% 4.0% -0.4% 9.0% 58.1% 56.3% Burnaby East $969,500 268.9 -0.3% -0.3% 5.0% 3.7% 1.9% 42.8% 78.1% Burnaby North $885,600 267.4 -1.1% -0.3% 2.7% 1.5% 3.4% 49.9% 79.6% Burnaby South $975,000 275.4 0.0% 1.0% 3.3% 1.8% 1.8% 48.5% 81.9% Coquitlam $929,800 275.8 -0.6% 0.5% 3.5% 4.5% 7.6% 58.1% 91.9% Ladner $840,100 236.5 0.0% 1.3% 3.8% 4.5% -2.0% 31.0% 58.1% Maple Ridge $780,700 248.6 0.2% 1.9% 4.5% 2.9% 14.6% 72.8% 80.5% New Westminster $666,000 293.0 0.5% 0.7% 4.6% 2.4% 13.3% 67.4% 91.3% North Vancouver $1,073,200 241.2 0.5% -0.1% 4.3% 3.6% 0.2% 39.8% 69.6% Pitt Meadows $762,300 277.1 0.1% 1.8% 4.1% 1.4% 17.8% 74.2% 94.5% Port Coquitlam $767,400 262.7 -0.2% 0.2% 2.7% 3.3% 8.7% 63.1% 85.0% Port Moody $930,900 257.3 -0.2% -0.2% 4.2% 3.1% 9.8% 59.1% 82.9% Richmond $929,900 277.6 -0.5% -0.6% 2.6% 2.8% 1.1% 45.3% 72.3% Squamish $772,200 245.7 2.2% -0.5% 0.6% 0.8% 8.9% 65.8% 88.0% Sunshine Coast $604,000 211.6 2.3% 5.5% 4.4% -0.1% 8.4% 62.9% 55.9% Tsawwassen $927,700 240.5 0.0% 1.2% 1.1% 1.8% -6.1% 31.6% 64.6% Vancouver East $1,083,300 321.9 -0.5% -1.1% 3.2% 5.0% 0.0% 43.8% 93.6% Vancouver West $1,272,400 265.7 -0.8% -1.4% 3.4% 4.9% -4.7% 34.0% 68.1% West Vancouver $2,114,400 232.8 -1.3% 0.3% -0.3% 0.4% -16.8% 10.1% 61.3% Whistler $913,500 212.9 1.9% 0.0% -0.4% 2.3% 16.0% 69.9% 66.6% Single Family Detached Lower Mainland $1,258,100 268.3 0.5% 1.2% 4.1% 3.6% -1.8% 41.6% 81.3% Greater Vancouver $1,464,200 270.5 0.5% 1.6% 3.8% 3.6% -7.1% 30.3% 75.1% Bowen Island $973,200 211.0 1.8% 5.2% 4.1% -0.3% 9.1% 58.2% 56.4% Burnaby East $1,230,200 275.1 -1.1% 0.4% 7.2% 4.2% -2.4% 35.6% 83.5% Burnaby North $1,488,200 287.8 1.1% 2.4% 7.1% 6.3% -5.5% 29.6% 86.3% Burnaby South $1,559,300 298.5 2.0% 4.4% 4.3% 4.2% -9.4% 30.7% 91.2% Coquitlam $1,210,700 268.7 -0.4% 1.5% 3.7% 3.8% -3.7% 40.6% 85.8% Ladner $1,006,900 241.0 2.4% 2.9% 8.0% 6.8% -1.3% 31.2% 64.6% Maple Ridge $854,700 243.5 0.7% 2.6% 6.1% 3.7% 10.1% 69.1% 82.7% New Westminster $1,087,600 271.3 -1.0% 0.7% 7.5% 3.5% -3.3% 37.0% 77.1% North Vancouver $1,563,500 246.2 1.3% 0.8% 3.3% 2.5% -7.5% 31.2% 74.0% Pitt Meadows $925,900 260.9 0.6% 3.2% 5.0% 2.4% 10.1% 62.8% 85.4% Port Coquitlam $970,600 258.8 0.2% 1.1% 1.8% 5.1% -2.0% 46.2% 81.1% Port Moody $1,462,600 270.1 0.6% 3.0% 4.5% 2.5% 1.2% 45.7% 86.9% Richmond $1,511,400 292.8 -1.1% -0.7% 1.3% 1.8% -11.6% 27.1% 68.5% Squamish $977,100 257.5 2.5% 0.6% 2.4% 2.4% 5.0% 64.1% 89.6% Sunshine Coast $599,700 210.1 2.3% 5.5% 4.5% 0.1% 8.4% 62.6% 54.8% Tsawwassen $1,095,400 244.1 0.7% 1.3% 2.8% 2.8% -7.9% 30.5% 69.5% Vancouver East $1,459,100 321.4 0.8% 0.7% 4.0% 7.9% -6.0% 29.4% 100.9% Vancouver West $3,076,700 311.2 1.2% 3.4% 4.6% 4.0% -16.0% 16.6% 70.4% West Vancouver $2,594,200 244.9 -1.0% 1.6% 0.0% 1.2% -17.0% 10.1% 68.7% Whistler $1,695,800 235.9 1.8% 1.5% 4.0% 7.7% 9.7% 62.6% 74.5% HOW TO READ THE TABLE: • Benchmark Price: Estimated sale price of a benchmark property. Benchmarks represent a typical property within each market. • Price Index: Index numbers estimate the percentage change in price on typical and constant quality properties over time. All figures are based on past sales. • x Month/Year Change %: Percentage change of index over a period of x month(s)/year(s) * In January 2005, the indexes are set to 100. Townhome properties are similar to Attached properties, a category that was used in the previous MLSLink HPI, but do not included duplexes. The above info is deemed reliable, but is not guaranteed. All dollar amounts in CDN. June 2020* * MLS®, Multiple Listing Service®, and all related graphics are trademarks of The Canadian Real Estate Association 1 of 18
- 4. Property Type Area Benchmark Price Price Index 1 Month Change % 3 Month Change % 6 Month Change % 1 Year Change % 3 Year Change % 5 Year Change % 10 Year Change % June 2020* Townhouse Lower Mainland $688,400 249.7 0.3% 0.9% 2.8% 2.1% 9.9% 59.8% 72.1% Greater Vancouver $790,800 253.7 -0.2% 0.1% 1.9% 2.3% 6.4% 51.4% 69.1% Burnaby East $673,000 248.6 0.5% 2.2% 3.5% 4.5% 10.1% 49.7% 67.1% Burnaby North $734,600 274.2 2.1% 0.9% 1.3% 1.3% 6.8% 54.8% 75.7% Burnaby South $790,200 272.2 2.2% 2.8% 3.5% 3.6% 6.2% 53.7% 74.0% Coquitlam $693,800 254.6 1.0% 1.9% 4.4% 5.6% 12.3% 61.7% 80.4% Ladner $630,700 226.2 -3.6% -2.2% 1.1% 3.0% -7.1% 27.3% 43.3% Maple Ridge $538,500 250.0 -1.8% 0.6% 0.9% 1.6% 14.3% 71.8% 72.7% New Westminster $748,300 274.6 0.4% 1.8% 5.8% 6.8% 10.5% 54.4% 75.4% North Vancouver $989,000 240.3 1.5% 2.6% 6.9% 4.5% 5.4% 49.6% 68.8% Pitt Meadows $627,000 271.3 -0.9% 2.7% 5.5% 2.9% 17.0% 72.8% 91.9% Port Coquitlam $647,400 245.1 0.0% 0.6% 3.4% 0.8% 9.7% 61.8% 73.3% Port Moody $651,000 220.0 0.4% 1.7% 3.8% -0.5% 11.4% 45.6% 56.7% Richmond $791,100 259.8 -0.3% 0.2% 3.4% 2.5% 3.6% 45.7% 65.1% Squamish $681,500 224.1 -0.2% -4.8% -5.2% -0.4% 11.7% 62.2% 78.6% Tsawwassen $606,300 237.7 -4.7% -1.5% 0.2% 1.6% -6.0% 34.4% 49.1% Vancouver East $888,600 282.6 -1.8% -2.1% 0.3% 2.2% 0.0% 48.0% 78.1% Vancouver West $1,119,800 261.8 -0.5% -1.2% -1.5% -0.5% -2.3% 38.8% 69.2% Whistler $899,600 216.9 -0.9% -4.8% -5.4% 2.1% 17.3% 70.9% 74.6% Apartment Lower Mainland $654,000 280.2 -0.5% -1.1% 3.4% 3.3% 14.7% 71.3% 85.0% Greater Vancouver $680,800 272.2 -0.8% -1.3% 3.2% 3.6% 10.4% 63.4% 80.3% Burnaby East $743,100 285.1 -0.5% -3.4% 3.9% 1.0% 5.0% 57.9% 78.5% Burnaby North $605,500 258.5 -2.9% -1.7% 1.2% -0.4% 11.1% 72.7% 80.0% Burnaby South $670,500 269.2 -1.2% -0.6% 3.0% 0.6% 8.5% 63.8% 82.6% Coquitlam $526,300 288.8 -1.5% -0.5% 3.1% 2.3% 18.9% 83.5% 101.1% Ladner $511,700 238.9 -0.7% 2.0% -3.1% 0.1% 4.5% 38.7% 57.4% Maple Ridge $365,800 261.2 1.5% 1.7% 5.2% 3.0% 30.5% 84.6% 77.8% New Westminster $529,100 299.8 0.8% 0.5% 4.0% 1.8% 18.2% 80.0% 95.7% North Vancouver $575,000 234.5 -0.4% -1.7% 4.1% 4.1% 8.7% 51.5% 64.4% Pitt Meadows $502,300 296.2 0.4% 1.3% 3.7% 0.8% 25.5% 86.2% 100.7% Port Coquitlam $461,400 275.9 -0.5% -0.6% 2.9% 3.3% 19.2% 85.8% 95.3% Port Moody $656,500 273.6 -0.7% -2.3% 4.7% 5.9% 18.4% 85.2% 97.7% Richmond $650,700 278.6 -0.3% -0.7% 3.1% 3.5% 13.6% 71.3% 81.5% Squamish $502,700 247.8 4.7% 3.3% 3.2% -1.8% 16.3% 84.1% 95.4% Tsawwassen $540,100 232.6 -1.4% 1.6% -2.6% -0.2% 3.7% 37.0% 53.9% Vancouver East $588,400 330.7 -1.2% -2.3% 2.9% 3.1% 6.6% 62.4% 87.0% Vancouver West $789,300 256.1 -1.5% -2.7% 3.7% 6.0% 2.1% 49.3% 70.3% West Vancouver $981,900 199.5 -2.4% -4.5% -2.9% -5.1% -10.0% 23.5% 42.9% Whistler $500,900 196.2 4.4% 3.3% 1.5% -1.2% 18.8% 78.4% 55.3% HOW TO READ THE TABLE: • Benchmark Price: Estimated sale price of a benchmark property. Benchmarks represent a typical property within each market. • Price Index: Index numbers estimate the percentage change in price on typical and constant quality properties over time. All figures are based on past sales. • x Month/Year Change %: Percentage change of index over a period of x month(s)/year(s) In January 2005, the indexes are set to 100. * Townhome properties are similar to attached properties, a category that was used in the previous MLSLink HPI, but do not included duplexes. Lower Mainland includes areas serviced by both Real Estate Board of Greater Vancouver & Fraser Valley Real Estate Board. The above info is deemed reliable, but is not guaranteed. All dollar amounts in CDN. * MLS®, Multiple Listing Service®, and all related graphics are trademarks of The Canadian Real Estate Association 2 of 18
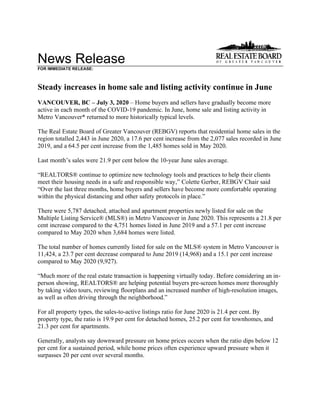
- 5. C:DATAMonthEndHpiexporthi_resgv-hpi2.tifGreaterVancouver 5YearTrend 60 110 160 210 260 310 Jun 2015 Aug 2015 Oct 2015 Dec 2015 Feb 2016 Apr 2016 Jun 2016 Aug 2016 Oct 2016 Dec 2016 Feb 2017 Apr 2017 Jun 2017 Aug 2017 Oct 2017 Dec 2017 Feb 2018 Apr 2018 Jun 2018 Aug 2018 Oct 2018 Dec 2018 Feb 2019 Apr 2019 Jun 2019 Aug 2019 Oct 2019 Dec 2019 Feb 2020 Apr 2020 Jun 2020 Price Index ResidentialDetachedTownhouseApartment Jan2005HPI=100
- 8. Listing & Sales Activity Summary Listings Sales 1 2 3 Col. 2 & 3 5 6 7 Col. 6 & 7 9 10 Col. 9 & 10 Jun May Jun Percentage Jun May Jun Percentage Apr 2019 - Apr 2020 - Percentage 2019 2020 2020 Variance 2019 2020 2020 Variance Jun 2019 Jun 2020 Variance BURNABY % % % DETACHED 138 80 155 93.8 60 37 61 64.9 180 124 -31.1 ATTACHED 128 67 97 44.8 52 34 31 -8.8 145 90 -37.9 APARTMENTS 277 181 364 101.1 128 89 128 43.8 385 273 -29.1 COQUITLAM DETACHED 175 125 146 16.8 80 48 81 68.8 216 163 -24.5 ATTACHED 73 91 95 4.4 32 35 50 42.9 95 102 7.4 APARTMENTS 140 149 209 40.3 64 49 85 73.5 222 176 -20.7 DELTA DETACHED 91 69 99 43.5 40 37 49 32.4 102 109 6.9 ATTACHED 22 17 33 94.1 10 11 20 81.8 43 38 -11.6 APARTMENTS 34 49 43 -12.2 18 7 17 142.9 48 35 -27.1 MAPLE RIDGE/PITT MEADOWS DETACHED 176 114 193 69.3 81 68 111 63.2 268 229 -14.6 ATTACHED 82 64 99 54.7 44 37 66 78.4 144 130 -9.7 APARTMENTS 67 62 79 27.4 31 27 35 29.6 104 86 -17.3 NORTH VANCOUVER DETACHED 150 134 188 40.3 82 51 84 64.7 240 173 -27.9 ATTACHED 67 51 94 84.3 33 30 44 46.7 109 86 -21.1 APARTMENTS 192 152 245 61.2 87 55 110 100.0 257 210 -18.3 NEW WESTMINSTER DETACHED 36 34 49 44.1 26 20 15 -25.0 66 45 -31.8 ATTACHED 16 19 27 42.1 4 3 11 266.7 21 26 23.8 APARTMENTS 149 102 183 79.4 67 49 71 44.9 245 158 -35.5 PORT MOODY/BELCARRA DETACHED 29 31 37 19.4 11 15 19 26.7 47 40 -14.9 ATTACHED 31 21 36 71.4 12 14 14 0.0 42 36 -14.3 APARTMENTS 25 41 72 75.6 19 17 25 47.1 72 55 -23.6 PORT COQUITLAM DETACHED 69 30 57 90.0 27 30 28 -6.7 89 74 -16.9 ATTACHED 48 27 52 92.6 22 9 27 200.0 75 49 -34.7 APARTMENTS 56 31 58 87.1 28 21 36 71.4 111 70 -36.9 RICHMOND DETACHED 215 115 192 67.0 90 41 75 82.9 213 152 -28.6 ATTACHED 156 90 141 56.7 62 48 62 29.2 159 147 -7.5 APARTMENTS 255 203 296 45.8 118 63 134 112.7 340 261 -23.2 SUNSHINE COAST DETACHED 107 98 116 18.4 44 28 75 167.9 120 129 7.5 ATTACHED 26 8 20 150.0 5 2 8 300.0 19 10 -47.4 APARTMENTS 7 7 8 14.3 5 1 5 400.0 24 9 -62.5 SQUAMISH DETACHED 31 36 52 44.4 17 12 17 41.7 60 39 -35.0 ATTACHED 26 20 30 50.0 11 6 18 200.0 37 31 -16.2 APARTMENTS 17 21 24 14.3 11 4 17 325.0 32 24 -25.0 VANCOUVER EAST DETACHED 196 109 222 103.7 85 64 105 64.1 275 218 -20.7 ATTACHED 64 76 116 52.6 43 25 43 72.0 137 85 -38.0 APARTMENTS 216 200 313 56.5 87 76 130 71.1 344 260 -24.4 VANCOUVER WEST DETACHED 178 116 206 77.6 60 51 78 52.9 209 166 -20.6 ATTACHED 115 77 132 71.4 41 36 48 33.3 141 113 -19.9 APARTMENTS 598 546 826 51.3 254 177 281 58.8 806 587 -27.2 WHISTLER/PEMBERTON DETACHED 18 21 56 166.7 8 3 17 466.7 24 23 -4.2 ATTACHED 29 27 51 88.9 13 5 28 460.0 48 39 -18.8 APARTMENTS 33 31 44 41.9 16 6 14 133.3 55 23 -58.2 WEST VANCOUVER/HOWE SOUND DETACHED 126 96 148 54.2 30 27 43 59.3 124 92 -25.8 ATTACHED 15 8 17 112.5 5 3 2 -33.3 11 6 -45.5 APARTMENTS 35 34 54 58.8 8 12 17 41.7 27 34 25.9 GRAND TOTALS DETACHED 1735 1208 1916 58.6 741 532 858 61.3 2233 1776 -20.5 ATTACHED 898 663 1040 56.9 389 298 472 58.4 1226 988 -19.4 APARTMENTS 2101 1809 2818 55.8 941 653 1105 69.2 3072 2261 -26.4