
Empfohlen
Empfohlen
Weitere ähnliche Inhalte
Was ist angesagt?
Was ist angesagt? (18)
Ähnlich wie Real Estate Board of Greater Vancouver Statistics Package January 2021
Ähnlich wie Real Estate Board of Greater Vancouver Statistics Package January 2021 (20)
Mehr von Vicky Aulakh
Mehr von Vicky Aulakh (20)
Kürzlich hochgeladen
Kürzlich hochgeladen (20)
Real Estate Board of Greater Vancouver Statistics Package January 2021
- 1. News Release FOR IMMEDIATE RELEASE: Home buyer demand remains elevated across Metro Vancouver VANCOUVER, BC – February 2, 2021 – In the first month of 2021, Metro Vancouver’s* housing market continued the pattern set at the end of last year with home sale activity outpacing the supply of homes listed for sale. The Real Estate Board of Greater Vancouver (REBGV) reports that residential home sales in the region totalled 2,389 in January 2021, a 52.1 per cent increase from the 1,571 sales recorded in January 2020, and a 22.8 per cent decrease from the 3,093 homes sold in December 2020. Last month’s sales were 36.4 per cent above the 10-year January sales average. “With home sale activity well above our January average, the supply of homes for sale isn’t able to keep pace,” Colette Gerber, REBGV Chair said. “This is causing increased competition amongst home buyers and upward pressure on prices.” There were 4,480 detached, attached and apartment properties newly listed for sale on the Multiple Listing Service® (MLS®) in Metro Vancouver in January 2021. This represents a 15.7 per cent increase compared to the 3,872 homes listed in January 2020 and an 86 per cent increase compared to December 2020 when 2,409 homes were listed. The total number of homes currently listed for sale on the MLS® system in Metro Vancouver is 8,306, a 3.6 per cent decrease compared to January 2020 (8,617) and a 2.7 per cent decrease compared to December 2020 (8,538). For all property types, the sales-to-active listings ratio for January 2021 is 28.8 per cent. By property type, the ratio is 26.3 per cent for detached homes, 37.6 per cent for townhomes, and 27.8 per cent for apartments. Generally, analysts say downward pressure on home prices occurs when the ratio dips below 12 per cent for a sustained period, while home prices often experience upward pressure when it surpasses 20 per cent over several months. “Shifting housing needs during the pandemic and historically low interest rates have been key drivers of demand in our market over the last six months,” Gerber said. “People who managed to enter the market a few years ago, and have seen their home values increase, are now looking to move up in the market to accommodate their changing needs.”
- 2. The MLS® Home Price Index composite benchmark price for all residential properties in Metro Vancouver is currently $1,056,600. This represents a 5.5 per cent increase compared to January 2020 and a 0.9 per cent increase compared to December 2020. Sales of detached homes in January 2021 reached 740, a 68.6 per cent increase from the 439 detached sales recorded in January 2020. The benchmark price of a detached homes is $1,576,800. This represents a 10.8 per cent increase from January 2020 and a 1.4 per cent increase compared to December 2020. Sales of apartment homes reached 1,195 in January 2021, a 46.8 per cent increase compared to the 814 sales in January 2020. The benchmark price of an apartment home is $680,800. This represents a 2.2 per cent increase from January 2020 and a 0.6 per cent increase compared to December 2020. Attached home sales in January 2021 totalled 454, a 42.8 per cent increase compared to the 318 sales in January 2020. The benchmark price of an attached home is $815,800. This represents a 4.3 per cent increase from January 2020 and a 0.2 per cent increase compared to December 2020. -30- *Editor’s Note: Areas covered by the Real Estate Board of Greater Vancouver include: Burnaby, Coquitlam, Maple Ridge, New Westminster, North Vancouver, Pitt Meadows, Port Coquitlam, Port Moody, Richmond, South Delta, Squamish, Sunshine Coast, Vancouver, West Vancouver, and Whistler. The real estate industry is a key economic driver in British Columbia. In 2020, 30,944 homes changed ownership in the Board’s area, generating $2.1 billion in economic spin-off activity and an estimated 14,728 jobs. The total dollar value of residential sales transacted through the MLS® system in Greater Vancouver totalled $33.7 billion in 2020. The Real Estate Board of Greater Vancouver is an association representing nearly 14,000 REALTORS® and their companies. The Board provides a variety of member services, including the Multiple Listing Service®. For more information on real estate, statistics, and buying or selling a home, contact a local REALTOR® or visit www.rebgv.org. For more information please contact: Craig Munn Director, Communication Real Estate Board of Greater Vancouver 604.730.3146 cmunn@rebgv.org
- 3. Property Type Area Benchmark Price Price Index 1 Month Change % 3 Month Change % 6 Month Change % 1 Year Change % 3 Year Change % 5 Year Change % 10 Year Change % Residential / Composite Lower Mainland $1,002,600 280.9 1.0% 1.9% 3.4% 6.8% 3.0% 44.3% 91.0% Greater Vancouver $1,056,600 277.2 0.9% 1.1% 2.5% 5.5% -0.1% 34.8% 83.5% Bowen Island $1,196,500 259.4 -0.5% 5.0% 14.8% 30.3% 27.1% 84.2% 115.3% Burnaby East $1,001,200 277.7 0.1% 1.0% 2.8% 7.6% 1.2% 39.1% 85.8% Burnaby North $912,700 275.6 0.4% 1.6% 2.6% 4.5% -0.4% 40.8% 86.3% Burnaby South $971,500 274.4 0.5% 0.1% -1.0% 1.7% -4.9% 36.5% 79.5% Coquitlam $967,200 286.9 1.1% 1.7% 3.3% 7.9% 3.6% 46.0% 102.8% Ladner $871,300 245.3 0.1% 1.2% 3.1% 7.3% -2.0% 11.3% 66.6% Maple Ridge $829,100 264.0 1.9% 3.3% 6.0% 11.7% 9.0% 68.9% 100.0% New Westminster $670,300 294.9 0.8% -0.2% 0.4% 4.5% 1.7% 53.5% 95.6% North Vancouver $1,134,700 255.0 1.1% 1.5% 4.1% 8.6% 3.1% 31.5% 87.5% Pitt Meadows $789,200 286.9 2.0% 1.7% 3.8% 8.6% 7.2% 68.9% 107.4% Port Coquitlam $804,800 275.5 1.0% 1.9% 4.3% 8.0% 6.0% 53.1% 97.1% Port Moody $954,000 263.7 0.7% 2.6% 2.7% 5.6% 2.7% 44.0% 94.6% Richmond $962,700 287.4 1.3% 1.0% 3.2% 5.5% -2.4% 33.2% 74.7% Squamish $800,800 254.8 -0.9% -1.4% 5.2% 2.6% 4.7% 53.8% 109.7% Sunshine Coast $721,800 252.9 1.9% 6.5% 14.5% 26.8% 23.4% 80.3% 107.3% Tsawwassen $1,011,400 262.2 1.7% 4.5% 7.4% 10.4% -0.3% 13.1% 95.1% Vancouver East $1,114,300 331.1 0.2% 1.7% 2.0% 4.1% -0.7% 32.0% 97.8% Vancouver West $1,257,100 262.5 0.5% -1.4% -1.7% 0.3% -7.7% 17.6% 66.2% West Vancouver $2,362,300 260.1 2.8% 4.2% 9.1% 12.5% -6.6% 9.7% 79.8% Whistler $963,300 224.5 0.9% 1.0% 8.5% 5.6% 9.2% 67.0% 91.2% Single Family Detached Lower Mainland $1,374,900 293.2 1.9% 4.5% 8.1% 12.8% 4.9% 36.1% 98.6% Greater Vancouver $1,576,800 291.3 1.4% 3.5% 6.7% 10.8% -0.5% 22.8% 87.1% Bowen Island $1,196,500 259.4 -0.5% 4.9% 14.7% 30.3% 27.1% 84.2% 115.3% Burnaby East $1,321,000 295.4 0.7% 3.1% 7.2% 12.3% 4.3% 28.9% 99.6% Burnaby North $1,546,200 299.0 0.6% 2.9% 4.6% 9.2% -1.4% 19.8% 90.7% Burnaby South $1,596,400 305.6 1.1% 2.1% 2.4% 6.9% -4.3% 21.4% 92.7% Coquitlam $1,321,100 293.2 2.3% 4.7% 7.6% 12.9% 3.2% 34.2% 105.5% Ladner $1,076,300 257.6 0.6% 3.3% 7.2% 14.1% 3.5% 6.5% 80.1% Maple Ridge $930,900 265.2 2.8% 5.3% 9.0% 15.0% 11.7% 66.5% 107.3% New Westminster $1,170,900 292.1 2.1% 3.9% 7.5% 12.2% 2.0% 29.4% 88.7% North Vancouver $1,722,300 271.2 1.2% 3.4% 7.6% 12.0% 2.9% 22.8% 100.6% Pitt Meadows $1,013,200 285.5 4.1% 3.9% 8.7% 15.4% 12.0% 63.4% 115.0% Port Coquitlam $1,094,800 291.9 3.8% 5.8% 11.7% 15.4% 11.9% 42.7% 111.1% Port Moody $1,602,300 295.9 2.1% 5.7% 11.2% 14.5% 7.2% 40.8% 106.6% Richmond $1,599,200 309.8 0.9% 1.1% 6.0% 6.4% -8.7% 15.3% 64.6% Squamish $992,300 261.5 -2.8% -2.4% -0.3% 0.5% 1.8% 47.7% 111.7% Sunshine Coast $715,900 250.8 1.9% 6.6% 14.5% 26.8% 22.7% 79.4% 105.4% Tsawwassen $1,230,900 274.3 2.5% 6.7% 10.5% 15.3% 1.9% 9.8% 111.8% Vancouver East $1,546,700 340.7 0.1% 2.6% 4.0% 8.6% -0.1% 20.6% 109.5% Vancouver West $3,172,600 320.9 0.3% 1.7% 3.9% 6.8% -11.0% 6.4% 69.5% West Vancouver $2,906,700 274.4 4.1% 5.9% 9.2% 13.3% -6.2% 9.1% 87.8% Whistler $1,675,000 233.0 -1.6% -2.3% -1.9% 4.0% 2.9% 46.4% 86.4% HOW TO READ THE TABLE: • Benchmark Price: Estimated sale price of a benchmark property. Benchmarks represent a typical property within each market. • Price Index: Index numbers estimate the percentage change in price on typical and constant quality properties over time. All figures are based on past sales. • x Month/Year Change %: Percentage change of index over a period of x month(s)/year(s) * In January 2005, the indexes are set to 100. Townhome properties are similar to Attached properties, a category that was used in the previous MLSLink HPI, but do not included duplexes. The above info is deemed reliable, but is not guaranteed. All dollar amounts in CDN. January 2021 * * MLS®, Multiple Listing Service®, and all related graphics are trademarks of The Canadian Real Estate Association 1 of 18
- 4. Property Type Area Benchmark Price Price Index 1 Month Change % 3 Month Change % 6 Month Change % 1 Year Change % 3 Year Change % 5 Year Change % 10 Year Change % January 2021 * Townhouse Lower Mainland $712,400 258.4 0.5% 1.2% 2.7% 5.7% 4.6% 54.6% 81.0% Greater Vancouver $815,800 261.7 0.2% 0.3% 2.3% 4.3% 2.5% 44.9% 76.8% Burnaby East $691,700 255.5 0.1% -2.2% 0.9% 5.6% 3.6% 63.1% 70.7% Burnaby North $759,000 283.3 1.1% 1.7% 3.2% 5.4% 3.4% 48.9% 86.0% Burnaby South $802,100 276.3 0.7% -0.4% 0.3% 4.5% 2.0% 51.1% 76.9% Coquitlam $711,000 260.9 0.4% 1.6% 2.6% 6.9% 7.2% 50.3% 88.9% Ladner $636,500 228.3 0.5% -0.5% -1.5% 0.5% -12.0% 21.2% 40.4% Maple Ridge $561,800 260.8 0.7% 1.4% 2.6% 7.6% 5.2% 70.6% 89.3% New Westminster $747,500 274.3 0.3% -1.2% -1.4% 3.6% 1.5% 47.2% 72.6% North Vancouver $1,020,700 248.0 1.1% -0.6% 2.1% 7.6% 2.9% 38.9% 81.7% Pitt Meadows $622,100 269.2 0.3% 0.5% -0.1% 3.9% 5.4% 63.4% 88.0% Port Coquitlam $660,900 250.2 0.0% -0.2% 1.1% 6.4% 4.2% 49.9% 77.3% Port Moody $651,900 220.3 -0.6% 0.5% 0.7% 3.9% 3.0% 25.7% 59.2% Richmond $823,700 270.5 0.8% 0.7% 2.7% 6.8% 0.4% 39.4% 69.3% Squamish $761,500 250.4 -3.4% 0.4% 11.4% 3.8% 11.8% 68.1% 120.4% Tsawwassen $608,300 238.5 0.8% -1.4% -3.4% -2.2% -13.1% 27.3% 44.5% Vancouver East $893,600 284.2 -0.4% -0.9% 0.6% -2.1% -1.0% 35.0% 81.7% Vancouver West $1,142,100 267.0 0.0% -1.4% 0.2% -0.4% -2.6% 31.1% 79.2% Whistler $1,017,000 245.2 -1.2% 3.9% 14.5% 4.7% 16.4% 82.2% 123.1% Apartment Lower Mainland $655,400 280.8 0.5% 0.0% -0.1% 2.6% 1.4% 56.9% 89.1% Greater Vancouver $680,800 272.2 0.6% -0.4% -0.3% 2.2% -0.3% 48.3% 83.4% Burnaby East $730,400 280.2 -1.5% 0.7% -0.4% 2.2% -5.8% 47.6% 78.6% Burnaby North $619,800 264.6 0.3% 0.8% 1.5% 2.1% 0.2% 64.3% 88.1% Burnaby South $657,500 264.0 0.3% -0.5% -2.5% -0.7% -5.7% 47.6% 75.3% Coquitlam $533,200 292.6 0.6% -0.2% 0.8% 2.2% 4.0% 66.9% 106.5% Ladner $508,000 237.2 -1.8% -2.5% -1.5% -0.6% -2.5% 33.5% 61.3% Maple Ridge $373,500 266.7 1.2% 1.2% 3.5% 9.1% 5.8% 81.1% 87.3% New Westminster $526,700 298.4 0.6% -0.9% -0.7% 3.3% 1.6% 64.6% 99.6% North Vancouver $591,400 241.2 1.0% 0.4% 1.5% 5.9% 3.9% 47.4% 76.1% Pitt Meadows $509,600 300.5 1.2% 0.7% 2.2% 6.3% 2.6% 79.4% 108.8% Port Coquitlam $467,900 279.8 -0.3% 0.3% 1.3% 3.9% 3.6% 74.0% 98.4% Port Moody $659,200 274.7 0.4% 1.7% -0.3% 2.9% 2.6% 67.5% 112.9% Richmond $663,300 284.0 1.6% 1.0% 1.9% 4.5% 2.0% 58.8% 92.2% Squamish $501,300 247.1 4.5% -1.2% 7.4% 4.7% 4.7% 58.7% 96.1% Tsawwassen $542,100 233.5 -0.6% -1.1% 0.0% -0.6% -2.4% 34.6% 59.5% Vancouver East $595,800 334.9 0.1% 1.3% 0.9% 1.8% -0.9% 50.0% 88.9% Vancouver West $762,500 247.4 0.4% -2.7% -4.0% -1.7% -6.1% 27.0% 67.2% West Vancouver $1,072,900 218.0 -2.1% -2.0% 7.6% 7.7% -4.2% 25.7% 59.2% Whistler $512,100 200.6 5.0% 0.6% 9.4% 6.3% 5.9% 69.9% 65.8% HOW TO READ THE TABLE: • Benchmark Price: Estimated sale price of a benchmark property. Benchmarks represent a typical property within each market. • Price Index: Index numbers estimate the percentage change in price on typical and constant quality properties over time. All figures are based on past sales. • x Month/Year Change %: Percentage change of index over a period of x month(s)/year(s) In January 2005, the indexes are set to 100. * Townhome properties are similar to attached properties, a category that was used in the previous MLSLink HPI, but do not included duplexes. Lower Mainland includes areas serviced by both Real Estate Board of Greater Vancouver & Fraser Valley Real Estate Board. The above info is deemed reliable, but is not guaranteed. All dollar amounts in CDN. * MLS®, Multiple Listing Service®, and all related graphics are trademarks of The Canadian Real Estate Association 2 of 18
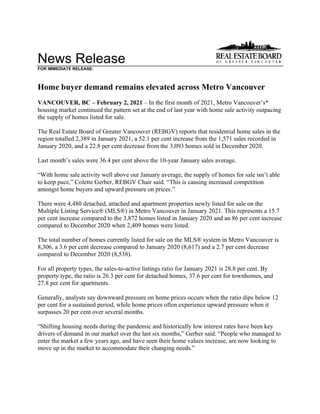
- 5. C:DATAMonthEndHpiexporthi_resgv-hpi2.tif Greater Vancouver 5 Year Trend 60 110 160 210 260 310 Jan 2016 Mar 2016 May 2016 Jul 2016 Sep 2016 Nov 2016 Jan 2017 Mar 2017 May 2017 Jul 2017 Sep 2017 Nov 2017 Jan 2018 Mar 2018 May 2018 Jul 2018 Sep 2018 Nov 2018 Jan 2019 Mar 2019 May 2019 Jul 2019 Sep 2019 Nov 2019 Jan 2020 Mar 2020 May 2020 Jul 2020 Sep 2020 Nov 2020 Jan 2021 Price Index Residential Detached Townhouse Apartment Jan 2005 HPI = 100
- 8. Listing & Sales Activity Summary Listings Sales 1 2 3 Col. 2 & 3 5 6 7 Col. 6 & 7 9 10 Col. 9 & 10 Jan Dec Jan Percentage Jan Dec Jan Percentage Nov 2019 - Nov 2020 - Percentage 2020 2020 2021 Variance 2020 2020 2021 Variance Jan 2020 Jan 2021 Variance BURNABY % % % DETACHED 123 58 103 77.6 41 83 56 -32.5 169 232 37.3 ATTACHED 80 57 78 36.8 37 68 58 -14.7 142 190 33.8 APARTMENTS 250 211 358 69.7 124 209 196 -6.2 495 598 20.8 COQUITLAM DETACHED 117 59 114 93.2 41 103 76 -26.2 181 271 49.7 ATTACHED 61 49 65 32.7 32 64 38 -40.6 109 161 47.7 APARTMENTS 124 100 149 49.0 71 140 106 -24.3 252 354 40.5 DELTA DETACHED 70 47 68 44.7 23 58 45 -22.4 79 157 98.7 ATTACHED 28 13 27 107.7 13 30 10 -66.7 41 71 73.2 APARTMENTS 51 10 45 350.0 20 20 18 -10.0 60 55 -8.3 MAPLE RIDGE/PITT MEADOWS DETACHED 130 78 125 60.3 67 126 95 -24.6 256 335 30.9 ATTACHED 71 44 79 79.5 36 65 68 4.6 108 198 83.3 APARTMENTS 55 54 62 14.8 32 46 49 6.5 111 135 21.6 NORTH VANCOUVER DETACHED 131 53 87 64.2 24 81 45 -44.4 158 220 39.2 ATTACHED 60 30 67 123.3 13 42 41 -2.4 76 122 60.5 APARTMENTS 175 79 178 125.3 63 124 92 -25.8 237 344 45.1 NEW WESTMINSTER DETACHED 28 10 25 150.0 7 24 21 -12.5 41 74 80.5 ATTACHED 19 13 28 115.4 4 22 14 -36.4 25 63 152.0 APARTMENTS 88 69 159 130.4 38 103 66 -35.9 182 250 37.4 PORT MOODY/BELCARRA DETACHED 24 10 20 100.0 9 21 9 -57.1 29 51 75.9 ATTACHED 11 9 15 66.7 12 19 9 -52.6 41 47 14.6 APARTMENTS 28 31 37 19.4 16 38 28 -26.3 46 92 100.0 PORT COQUITLAM DETACHED 37 28 50 78.6 22 29 33 13.8 74 97 31.1 ATTACHED 35 25 29 16.0 15 23 18 -21.7 58 67 15.5 APARTMENTS 55 48 77 60.4 23 52 37 -28.8 99 129 30.3 RICHMOND DETACHED 168 85 152 78.8 52 111 71 -36.0 205 270 31.7 ATTACHED 109 62 138 122.6 63 78 64 -17.9 184 230 25.0 APARTMENTS 242 148 306 106.8 101 152 142 -6.6 379 451 19.0 SUNSHINE COAST DETACHED 49 41 66 61.0 21 63 42 -33.3 100 188 88.0 ATTACHED 10 10 10 0.0 4 10 8 -20.0 16 35 118.8 APARTMENTS 3 2 11 450.0 3 8 10 25.0 9 24 166.7 SQUAMISH DETACHED 28 10 38 280.0 12 28 19 -32.1 42 76 81.0 ATTACHED 16 14 18 28.6 6 22 12 -45.5 34 62 82.4 APARTMENTS 24 14 23 64.3 11 25 16 -36.0 35 66 88.6 VANCOUVER EAST DETACHED 120 105 175 66.7 53 133 109 -18.0 233 379 62.7 ATTACHED 63 50 106 112.0 30 68 48 -29.4 121 182 50.4 APARTMENTS 171 106 216 103.8 78 147 99 -32.7 321 407 26.8 VANCOUVER WEST DETACHED 144 80 144 80.0 35 84 69 -17.9 159 248 56.0 ATTACHED 92 46 106 130.4 30 38 38 0.0 101 136 34.7 APARTMENTS 500 296 640 116.2 210 364 285 -21.7 775 964 24.4 WHISTLER/PEMBERTON DETACHED 23 32 19 -40.6 7 16 15 -6.3 26 55 111.5 ATTACHED 31 16 27 68.8 19 35 23 -34.3 64 95 48.4 APARTMENTS 44 37 44 18.9 18 28 40 42.9 59 122 106.8 WEST VANCOUVER/HOWE SOUND DETACHED 136 44 137 211.4 21 53 29 -45.3 101 144 42.6 ATTACHED 7 5 14 180.0 2 9 5 -44.4 11 20 81.8 APARTMENTS 31 16 38 137.5 6 18 11 -38.9 29 49 69.0 GRAND TOTALS DETACHED 1328 740 1323 78.8 435 1013 734 -27.5 1853 2797 50.9 ATTACHED 693 443 807 82.2 316 593 454 -23.4 1131 1679 48.5 APARTMENTS 1841 1221 2343 91.9 814 1474 1195 -18.9 3089 4040 30.8