SlideShare ist ein Scribd-Unternehmen logo
1 von 36
Downloaden Sie, um offline zu lesen
1
VATTENFALL INTERIM REPORT JANUARY–SEPTEMBER 2021
Interim report
January–September 2022
KEY DATA
Jan-Sep Jan-Sep Jul-Sep Jul-Sep Full year Last 12
Amounts in SEK million unless indicated otherwise 2022 2021 2022 2021 2021 months
Net sales 160 825 116 590 53 076 36 125 180 119 224 354
Operating profit before depreciation, amortisation and
impairment losses (EBITDA)1
49 023 65 565 16 386 27 293 75 790 59 248
Operating profit (EBIT)1
36 707 52 521 12 192 22 926 60 271 44 457
Underlying EBIT1
23 844 22 090 6 232 4 782 31 181 32 935
Profit for the period 16 980 41 912 6 684 18 277 48 013 23 081
Electricity generation, TWh 80.6 80.6 25.1 21.8 111.4 111.4
Sales of electricity, TWh2
121.9 123.2 38.6 37.8 168.9 167.6
- of which, customer sales 81.5 88.5 24.9 28.2 120.5 113.5
Sales of heat, TWh 9.5 10.5 1.3 1.3 15.6 14.6
Sales of gas, TWh 33.2 39.8 4.8 5.3 57.1 50.5
Return on capital employed, %1
17.3 3
22.4 3
17.3 3
22.4 3
22.2 17.3
FFO/adjusted net debt, %1
n/a 4
182.7 3
n/a 4
182.7 3
171.2 n/a 4
1) See Definitions and calculations of key ratios for definitions of Alternative Performance Measures.
2) Sales of electricity also include sales to Nord Pool Spot and deliveries to minority shareholders.
3) Last 12-month values
4) The adjusted net debt decreased to a net asset mainly due to increased margin calls received. Excluding effects from received and paid margin calls FFO/adjusted net
debt was at 41.4%
Cover image: Juktan wind farm, Sweden
Business highlights, July–September 2022
• Turbulent market and continued major price differentials
among Nordic price areas
• Postponed restart of Ringhals 4 nuclear reactor
• Foundation installation completed and delivery of first
electricity from offshore wind farm Hollandse Kust Zuid in the
Netherlands
• Exercised option to continue to develop the offshore wind
power project N-7.2 in Germany which is expected to cover
the electricity consumption for over one million households
• Joint venture with Midlothian Council to invest in low carbon
energy solutions in Scotland
• Upgrades to regional grid progressing with the inauguration of
a regional grid station in Stockholm and detailed planning for
a 150-kV transmission line in Luleå
Financial highlights, January–September 2022
• Net sales increased by 38% (34% excluding currency effects)
to SEK 160,825 million (116,590)
• Underlying operating profit1
of SEK 23,844 million (22,090)
• Operating profit1
of SEK 36,707 million (52,521)
• Profit for the period of SEK 16,980 million (41,912)
Financial highlights, July–September 2022
• Net sales increased by 47% (41% excluding currency effects)
to SEK 53,076 million (36,125)
• Underlying operating profit1
of SEK 6,232 million (4,782)
• Operating profit1
of SEK 12,192 million (22,926)
• Profit for the period of SEK 6,684 million (18,277)
2
VATTENFALL INTERIM REPORT JANUARY–SEPTEMBER 2021
CEO’s comment
Stable result and strong financial position
in troubled times
The third quarter was characterised by the turbulent markets and
there is major uncertainty ahead of the winter. Vattenfall’s financial
position is however strong and the underlying results for the period
were stable. Positive contributions from the wind and sales
segments’ continued to be offset by negative effects from price
differences between Nordic price areas. It is imperative to continue
investing in new energy. In the quarter, we utilised our option to
continue developing a wind power project corresponding to the
electricity consumption of a million households.
Anxiety ahead of winter
Based on enquiries to our customer support and the public debate at
large, we know that many of our customers feel anxious ahead of the
winter. Vattenfall is actively engaged in initiatives and dialogues that can
help mitigate effects of the current situation. For example, we support our
customers by providing advice about energy savings and various types
of contracts. It is important to reduce energy consumption in Europe in
the short term, especially at peak times, since lower electricity
consumption affects both individual customers’ energy bills and
contributes to lower market prices for electricity.
Major market uncertainty following summer
Electricity market prices continue to fluctuate greatly around historically
high levels. High fuel prices remain the primary driver of electricity prices
on the Continent; that in Germany and the Netherlands have been three
to four times higher than in Q3 2021. In the Nordic countries, particularly
in southern Sweden, prices have been affected by the Continent but
unfavourable weather and wind conditions also impacted, especially in
August. Even as fuel and electricity rates have declined somewhat, the
situation remains strained. The delayed restart of Ringhals 4 is naturally
particularly unfortunate in this situation. The reactor is expected to come
back online on 31 January 2023.
Stable result and strong financial position
Profit for the period declined by SEK 24.9 billion to SEK 17.0 billion. This
is mainly due to major positive one-off effects during 2021 related to the
sale of our electricity distribution business in Berlin and compensation for
the early closure of German nuclear power. Underlying operating profit
increased by SEK 1.8 billion to SEK 23.8 billion, primarily driven by our
wind business. Our sales operations also performed well as customers
increasingly chose Vattenfall because of our greater capacity to handle
market uncertainty as an integrated utility. Price area differences
continued, however, to impact our Nordic power portfolio negatively.
Looking ahead, we see major uncertainties related to intermediate goods
and fuel costs, but also higher credit risks driven by the market situation.
Several market actors have experienced difficulties as a result of major
outflows of margins related to futures contracts. Vattenfall has had net
inflows of margin calls and our financial position is strong. In order to
safeguard our strong financial position, we are currently engaged in
optimising our business flows and pre-emptively building up additional
liquidity buffers to be able to manage future outflows.
Important to continue investments in new energy
During the quarter, Vattenfall used its option to continue to develop the
wind farm project N-7.2 off the German North Sea Coast, that is
expected to produce fossil-free electricity corresponding to the annual
electricity consumption of over a million households. In the Netherlands,
all the foundations have now been installed and the first electricity has
been delivered from Hollandse Kust Zuid, which will be the world's
largest wind farm when commissioned next year. In our partnership for
fossil-free steel, HYBRIT, the pilot plant for hydrogen storage has now
started, and test findings show that the quality of fossil-free sponge iron
produced via the HYBRIT process is higher than its fossil counterpart.
Our society needs secure and fossil-free electricity that is affordable.
Also, sectors such as transportation and industry need to be electrified,
not least for the sake of competitiveness. That is why it is more important
than ever that we do not slow down and take the necessary steps for a
decarbonised future. Vattenfall contributes to this by investing in all types
of fossil-free electricity production and power grids.
Anna Borg
President and CEO
Profit for the period
First nine months of 2022
17.0
SEK billion
(41.9)
Underlying operating profit
First nine months of 2022
23.8
SEK billion
(22.1)
FFO/adjusted net debt
Last 12 months
N/A (41.4%)1
(182.7)
Return on capital employed
Last 12 months
17.3%
(22.4)
1
Vattenfall’s adjusted net debt is currently negative. The figure in parentheses shows the key figure adjusted for margin calls.
3
VATTENFALL INTERIM REPORT JANUARY–SEPTEMBER 2022
Group overview
Vattenfall generates electricity and heat from a portfolio of
energy sources, such as hydro and nuclear power, wind
power, and fossil fuels. We sell electricity, gas, and heat to
private customers and businesses primarily in northern
Europe. Vattenfall hedges parts of the future electricity
generation through sales in the forward and futures markets.
Market development
Electricity markets continue to be characterised by major
fluctuations triggered by developments on the Continent.
Sharply rising gas prices have resulted in record-high
electricity prices on the Continent and the Nordic system
price has been greatly impacted. Higher average electricity
prices for the first nine months of 2022 contributed positively
to Vattenfall’s results. Major differences between the system
price in the Nordics and the price in respective price areas,
however, had a negative impact and resulted in a lower
achieved price after price hedges.
ELECTRICITY SPOT PRICES, EUR/MWh
The average spot price in the Nordic countries increased as a
result of higher electricity prices on the Continent, which was
primarily attributable to higher prices for fuel and emissions
allowances.
Jan-Sep. Jul-Sep.
2022 2021 Change 2022 2021 Change
Nordics 136.0 50.9 167% 176.00 68.30 158%
Germany 249.8 69.2 261% 375.8 97.1 287%
Netherlands 256.7 71.6 259% 365.4 101.5 260%
NORDIC HYDROLOGY
Hydrological balance is a measure of the estimated energy
volume stored in the form of snow, and water reservoirs and
ground water in relation to a normal situation. Historically,
Nordic electricity prices have had a negative correlation with
the hydrological balance, since the available hydro power
capacity normally regulated what energy sources would be
used in the system. Electricity prices in the northern parts of
the Nordic countries remain linked to the hydrological balance,
while the correlation with system price and the price
development in the southern regions has decreased,
especially in the past year.
By the end of the third quarter 2022, the hydrological balance
for the Nordics was below normal levels primarily as a result of
the low fill rate in water reservoirs in southern Norway.
NORDIC HYDROLOGICAL BALANCE (TWh)
However, the fill rates in Vattenfall’s water reservoir rose to
80% (71%), which is 14 percentage points above normal
levels. This is attributable to an increased inflow from
precipitation in northern Sweden, especially in July and
August. This, in turn, had a negative impact on the spot price
for electricity in the price areas for northern Sweden.
NORDIC PRICE AREA DIFFERENCES
The electricity market in the Nordic countries is divided into
separate price areas. Sweden has four price areas and
Vattenfall’s hydro power assets’ are mainly located in SE1
and SE2 while the nuclear power assets are located in SE3.
Vattenfall also has wind power assets in SE4. In recent years,
the differences in electricity prices between the areas have
grown wider as a result of, among other things, bottlenecks in
the transmission grid, which prevents the electricity from
reaching southern regions. Moreover, new transmission
connections to the Continent have contributed further to
higher prices in southern Sweden. The Nordic system price
(SYS) is a reference price for all price areas and is calculated
by the power exchange Nord Pool.
SPOT PRICES PER PRICE AREA AND SYSTEM PRICE
(EUR/MWh)
1 Difference between SE1 and SE2 is invisible due to high correlation
The price area differentials have remained high for the first
nine months of 2022. In southern Sweden, prices increased
significantly compared to last year (see above), while the
average price for northern Sweden remained relatively stable
0
50
100
150
200
250
300
2019 2020 2021 2022
EUR/MWh
SE1¹ SE2¹ SE3 SE4 SYS
-30
-20
-10
0
10
20
30
40
2021 2022
4
VATTENFALL INTERIM REPORT JANUARY–SEPTEMBER 2022
INDICATIVE NORDIC HEDGE PRICES AND FINANCIAL
HEDGE RATIO (SE, DK, FI) AS PER 30 SEPTEMBER
2022
Vattenfall’s hedging strategy has the objective to even on
earnings by selling parts of the planned production in the
forward markets. The main exposures arise from outright
power in the Nordics with nuclear and hydro power as well as
a growing share of wind power in the Nordics, on the
Continent and in the UK.
2022 2023 2024
EUR/MWh 25 30 40
Hedge ratio (%) 66 57 38
Due to large price area differences Vattenfall has adjusted its
hedging strategy throughout the year, resulting in lower
hedge ratio and hedge price for 2022.
ACHIEVED NORDIC ELECTRICITY PRICES (SE, DK,
FI)1
The achieved price is the average price that Vattenfall
received for its electricity production during the period and is
impacted by the hedge ratio and hedge price (see above), the
spot price and effects from price area differentials.
Jan-Sep. Jul-Sep. Full year
2022 2021 2022 2021 2021
EUR/MWh 17 31 14 28 31
Vattenfall's achieved price in the Nordics has decreased
significantly primarily because of major price area
differentials.
FUEL PRICES
The prices of gas, coal, and CO2 emission allowances affect
mainly Vattenfall’s heat business on the Continent. Gas
prices also affect activities within the business segment
Customers & Solutions, which is responsible for customer
sales of gas.
Jan-Sep. Jul-Sep.
2022 2021Change 2022 2021Change
Gas (EUR/MWh) 132.5 30.3 337% 198.2 47.3 319%
Coal (USD/t) 310.1 104.2 198% 360.6 154.7 133%
CO2 (EUR/t) 82.1 48.2 70% 80.0 57.0 40%
1
Achieved prices from the spot market and hedges. Includes Nordic
hydro, nuclear and wind power generation
The price of gas and coal has increased sharply from January
to September 2022 as a result of the war in Ukraine. Gas
prices were affected by the unplanned halt in deliveries from
Nord Stream 1. The price of coal was affected by high
demand in Europe prompted by rising gas prices and higher
profitability of coal-fired production capacity. The price for
CO2 emission allowances rose primarily as a result of the
increased use of coal as fuel.
PRICE MARGINS
The clean spark spread is the margin between the electricity
price and the cost of gas and emissions allowances used for
its generation. The clean dark spread represents the same
relationship for coal-fired electricity generation. These
spreads affect Vattenfall’s heat business in Germany and the
Netherlands where the fossil-fired combined heat-and-power
(CHP) plants and condensing plants are located. Vattenfall
hedges these spreads in part.
CLEAN SPARK SPREAD AND CLEAN DARK SPREAD
The clean spark spreads were negative for the first nine
months of 2022 as a result of higher gas prices. This had a
negative financial impact on Vattenfall’s combined heat and
power plants. The clean dark spreads increased significantly
during the third quarter.
-75
-25
25
75
125
175
225
2021 2022
Clean Spark Spread NL (52% efficiency)
Clean Dark Spread DE (38% efficiency)
Clean Spark Spread DE (50% efficiency)
5
VATTENFALL INTERIM REPORT JANUARY–SEPTEMBER 2022
Generation development
Combined electricity generation was unchanged at 80.6 TWh
(80.6) for the first nine months of 2022. Generation from
fossil-based power declined (–1.9 TWh) as a result of lower
clean spark spreads. Generation from nuclear power
increased (+1.2 TWh) as a result of higher availability
compared to 2021 when the availability of Ringhals 3 was
lower. Generation from wind power rose (1.1 TWh) as a result
of new capacity, mainly from the offshore wind farm Kriegers
Flak, and as a result of higher wind speeds.
ELECTRICITY GENERATION (TWh)
AVAILABILITY
Availability is the percentage of planned production time for
an asset with no unforeseen technical issues or maintenance-
related outages.
Jan-Sep.
2022 2021
Nuclear 85.9% 82.1%
Wind - offshore 95.4% 95.8%
Wind – onshore 95.6% 96.6%
Availability of Vattenfall’s nuclear power for the year's first
nine months was higher than the corresponding period in
2021. The availability for wind power was lower.
INSTALLED WIND CAPACITY
New installed wind power capacity in the last 12 months
pertains to Blakliden Fäbodberget (353 MW), South Kyle (38
MW of 240 MW), Moerdijk (20 MW of 27 MW), Nij Hiddum
Houw (19 MW), A16 (17 MW of 20 MW) and Haringvliet
(4 MW of 22 MW). The comparison is affected by the partial
divestment of Princess Ariane (Wieringermeer Extension,114
MW), and divestment of other onshore wind farms (92 MW).
MW
30 Sep
2022
30 Sep
2021
Onshore wind 1,688 1,442
Offshore wind 2,602 2,602
Total 4,290 4,044
Sales development
Electricity sales, excluding sales to Nord Pool Spot and
deliveries to minority owners, declined by 1.3 TWh to 121.9
TWh (123.2), primarily as a result of lower volumes in the
business segment in France and in Germany. Gas sales
declined by 6.6 TWh to 33.2 TWh (39.8) as a result of warmer
weather and lower demand in the Netherlands and Germany.
Heat sales declined by 1.0 TWh to 9.5 TWh (10.5) as a result
of warmer weather.
Jan-Sep. Jul-Sep.
2022 2021Change 2022 2021Change
Sales of
electricity to
customers , TWh
81.5 88.5 -8% 24.9 28.2 -12%
Sales of gas,
TWh
33.2 39.8 -17% 4.8 5.3 -9%
Sales of heat,
TWh
9.5 10.5 -10% 1.3 1.3 -
TEMPERATURE EFFECTS
Temperature effects impact sales volume in the operating
segments Customers & Solutions and Heat. Lower
temperatures usually mean higher demand for heating
(including gas) and electricity. In the Nordic countries, this
mainly affects sales of electricity and heat. In Germany and
the Netherlands, gas remains the primary source of heat,
which means that low temperatures increase demand for gas
in addition to increased sales of heat.
TEMPERATURE DEVIATION FROM NORMAL LEVELS (ºC)
Jan-Sep. Jul-Sep.
2022 2021 2022 2021
Nordics 0.7 -0.0 0.3 0.5
Netherlands 1.1 -0.3 1.1 0.1
Germany 1.2 -0.4 1.3 0.1
During the period January-September 2022, the temperature
in Vattenfall's markets was higher than normal, which affected
sales negatively.
0
10
20
30
Fossil Nuclear Hydro Wind Biomass,
waste
Jan-Sep 2022 Jan-Sep 2021
6
VATTENFALL INTERIM REPORT JANUARY–SEPTEMBER 2022
Net sales
January–September: Consolidated net sales increased by
SEK 44.2 billion (including positive currency effects of
SEK 4.6 billion). The increase is mainly attributable to higher
electricity prices in the Netherlands, the Nordics, and Germany.
July–September: Consolidated net sales increased by
SEK 17.0 billion (including positive currency effects of
SEK 2.0 billion). The increase is mainly attributable to higher
electricity prices in the Netherlands, the Nordics, and Germany.
Earnings
January–September: The underlying operating profit
increased by SEK 1.8 billion, which is explained by:
• Higher earnings contribution from the Wind operating
segment (SEK +8.8 billion), mainly owing to higher electricity
prices on the Continent and new capacity
• Higher earnings contribution from the Customers & Solutions
operating segment (SEK +2.4 billion), mainly owing to more
electricity customers in Germany
• Lower earnings contribution from the Heat operating
segment (SEK -3.3 billion), mainly due to higher gas prices,
which resulted in lower clean spark spreads
• Lower earnings contribution from the Power Generation
operating segment (SEK -4.6 billion), owing to lower
achieved prices in the Nordics and lower realised earnings
contributions from trading operations
• Other items, net (SEK -1.5 billion)
Items affecting comparability amounted to SEK 12.9 billion
(30.4), of which most pertains to changes in market value for
energy derivatives and inventories (SEK 14.8 billion) and
reversed impairment losses (SEK 1.3 billion). Higher provisions
related to nuclear power and operating segment Heat
(SEK -3.3 billion) had an offsetting effect. Profit for the period
totalled SEK 17.0 billion (41.9) and was affected by – in addition
to items affecting comparability – lower net financial items
resulting from a lower return from the Swedish Nuclear Waste
Fund. The profit for the period in 2021 was positively affected
by the compensation for the closure of nuclear power
operations in Germany (SEK 12.5 billion) and the capital gain
from the sale of Stromnetz Berlin (SEK 8.4 billion).
July–September: Underlying operating profit increased by SEK
1.5 billion mainly due to positive contributions from the
operating segments Wind (SEK 4.1 billion) and Customers &
Solutions (SEK 1.0 billion). The operating segments Power
Generation and Heat contributed negatively (SEK –2.9 billion
and SEK –0.4 billion, respectively). Items affecting
comparability amounted to SEK 6.0 billion (18.1), of which most
pertains to unrealised changes in market value for energy
derivatives and inventories (SEK 6.4 billion) and reversed
impairment losses (SEK 0.4 billion). This was offset in part by
increased provisions in operating segment Heat
(SEK -0.8 billion). Profit for the period totalled SEK 6.7 billion
(18.3), were affected by lower net financial items as a result of
lower return from the Swedish Nuclear Waste Fund. The profit
for the period in 2021 was positively affected by the capital gain
from the sale of Stromnetz Berlin (SEK 8.4 billion).
Cash flow
January–September: Funds from operations (FFO) increased
by SEK 0.1 billion. Cash flow from changes in working capital
amounted to SEK 81.4 billion. The largest contributing factors
were changes related to the net change in margin calls received
(SEK 67.0 billion) and changes related to CO2 emission
allowances (SEK +23.3 billion).
July–September: Funds from operations (FFO) increased by
SEK 1.3 billion, mainly owing to higher operating profit before
depreciation, amortisation and impairment losses (EBITDA).
Cash flow from changes in working capital amounted to
SEK 83.1 billion, which is mainly explained by the net change in
margin calls received (SEK 70.9 billion). Changes related to
CO2 emission allowances (SEK +19.8 billion) had a contributing
effect.
KEY FIGURES – GROUP OVERVIEW
Jan-Sep Jan-Sep Jul-Sep Jul-Sep Full year Last 12
Amounts in SEK million 2022 2021 2022 2021 2021 months
Net sales 160 825 116 590 53 076 36 125 180 119 224 354
Operating profit before depreciation, amortisation and
impairment losses (EBITDA)1
49 023 65 565 16 386 27 293 75 790 59 248
Operating profit (EBIT)1
36 707 52 521 12 192 22 926 60 271 44 457
Underlying operating profit1
23 844 22 090 6 232 4 782 31 181 32 935
Items affecting comparability1
12 863 30 431 5 960 18 144 29 090 11 522
Profit for the period 16 980 41 912 6 684 18 277 48 013 23 081
Funds from operations (FFO)1
27 598 27 480 7 305 6 054 46 096 46 214
Cash flow from changes in operating assets and operating
liabilities (working capital) 81 416 70 040 83 080 55 169 55 736 67 112
Cash flow from operating activities 109 014 97 520 90 385 61 223 101 832 113 326
1) See Definitions and calculations of key ratios for definitions of Alternative Performance Measures.
7
VATTENFALL INTERIM REPORT JANUARY–SEPTEMBER 2022
Capital structure
Cash and cash equivalents, and short-term investments increased by SEK 98.4 billion compared with the level at 31 December
2021. Committed credit facilities consist of a EUR 2.0 billion Revolving Credit Facility that expires in November 2024 and six other
committed credit facilities totalling EUR 4.3 billion. As per 30 September 2022 available liquid assets and/or committed credit
facilities amounted to 149.7% of net sales. Vattenfall’s target is to maintain a level of no less than 10% of consolidated net sales,
but at least the equivalent of the next 90 days’ maturities.
Net debt decreased by SEK 71.3 billion to a net asset of SEK 116.0 billion and adjusted net debt decreased by SEK 71.0 billion to
a net asset of SEK 44.1 billion compared to 31 December 2021. These reductions are mainly attributable to a positive cash flow
after investments (SEK 103.0 billion), which is largely explained by the change in working capital (SEK 81.4 billion). Significantly
increased electricity and gas prices resulted in higher margin calls received. Dividends paid increased net debt by SEK 24.2 billion.
The adjusted net debt was also affected by lower pension provisions (SEK 15.9 billion), which was partially offset by higher
provisions for nuclear power (SEK 13.9 billion, net). Excluding effects from received and paid margin calls FFO/adjusted net debt
was at 41.4%.
NET DEBT
-60
-40
-20
0
20
40
60
80
-120 000
-80 000
-40 000
0
40 000
80 000
120 000
160 000
Q2
2021
Q3
2021
Q4
2021
Q1
2022
Q2
2022
Q3
2022
%
MSEK
Interest-bearing liabilities, MSEK
Net debt, MSEK
Gross debt/equity, %
Net debt/equity, %
ADJUSTED NET DEBT
-150
-100
-50
0
50
100
150
200
-50 000
-20 000
10 000
40 000
70 000
100 000
130 000
Q2
2021
Q3
2021
Q4
2021
Q1
2022
Q2
2022
Q3
2022
%
MSEK
Adjusted net debt, MSEK
FFO/adjusted net debt, %
Strategic focus areas and targets for 2025
Strategic focus area Targets for 2025 Q3 2022 Outcome 2021
Driving decarbonisation with
our customers & partners
1. Customer engagement, absolute Net
Promoter Score (NPS):1
+18 - +10
Securing a fossil-free energy
supply
2. CO2 emissions intensity:2
≤86 gCO2e/kWh 75 82
Delivering high-performing
operations
3. Funds from operations (FFO)/adjusted net
debt3
: 22%–27% n/a (41.4%)4
171.2%
4. Return On Capital Employed (ROCE)5
, last
12 months: ≥8% 17.3% 22.2%
Empowering our people 5. Lost Time Injury Frequency (LTIF)6
: ≤1.0
6. Employee Engagement Index7
: ≥75%
1.2
-
1.7
75%
1) Absolute NPS is weighted 80% from Customers & Solutions and 20% from Heat, which corresponds to our customer composition. Reported on an annual basis
2) Includes CO2 and other greenhouse gases such as N2O and SF6. as well as indirect emissions from electricity and heat use (scope 2). Consolidated value where
CO2 is primarily related to the operating segment Heat. The target for 2025 is to be on track to achieving the 1.5° C target by 2030, according to SBT
3) Rolling 12-months values. Received margin calls had a significant impact on the outcome for both the first nine months 2022 and for the full year 2021
4) The adjusted net debt decreased to a net asset mainly due to increased margin calls received. Excluding effects from received and paid margin calls
FFO/adjusted net debt was at 41.4%
5) Rolling 12-months values. Compensation for closure of nuclear power in Germany, changes in market value of energy derivatives and inventories and capital
gains from the sale of Stromnetz Berlin's had significant impact on the outcome for the full year 2021
6) Rolling 12-month values. LTIF (Lost Time Injury Frequency) is expressed in terms of the number of lost time work injuries per 1 million hours worked. The metric
pertains only to Vattenfall employees
7) Documentation for measurement of target achievement is derived from the results of an employee survey, which is conducted on an annual basis
8
VATTENFALL INTERIM REPORT JANUARY–SEPTEMBER 2022
Operating segments
Jan-Sep Jan-Sep Jul-Sep Jul-Sep Full year Last 12
Amounts in SEK million 2022 2021 2022 2021 2021 months
Underlying EBIT
Customers & Solutions 4 691 2 245 1 341 353 2 349 4 795
Power Generation 9 789 14 398 1 227 4 117 19 334 14 725
- of which, realised trading result 386 4 106 - 2 002 1 339 3 633 - 87
Wind 11 958 3 188 5 230 1 110 7 866 16 636
Heat - 2 701 638 - 1 301 - 906 - 343 - 3 682
Distribution 1 413 2 693 128 240 3 152 1 872
- of which, Distribution Germany — 666 — 1 666 —
- of which, Distribution Sweden 1 437 2 032 131 236 2 516 1 921
Other1
- 1 111 - 913 - 336 - 125 - 1 189 - 1 387
Eliminations - 195 - 159 - 57 - 7 12 - 24
Underlying operating profit 23 844 22 090 6 232 4 782 31 181 32 935
1) “Other” pertains mainly to all Staff functions, including Treasury and Shared Service Centres.
9
VATTENFALL INTERIM REPORT JANUARY–SEPTEMBER 2022
Customers & Solutions
The Customers & Solutions Business Area is responsible for
sales of electricity, gas and energy services in all of Vattenfall’s
markets.
Strong earnings development as more customers
choose Vattenfall
• The customer base grew by 4% since the beginning of the
year
• Cooperation with the supermarket chain Netto enables
expansion of charging infrastructure for electric vehicles in
Germany
Q1–Q3: Net sales increased by 75 % compared to 2021.
Underlying operating profit increased by 109 %, mainly owing to
a growing customer base in Germany and temporary sourcing
effects for electricity and gas. Compared to year-end 2021,
Vattenfall’s total customer base increased by 4% to 10.8 million
contracts.
Sales of electricity decreased by 3% compared to the
corresponding period in 2021 mainly due to lower sold volumes
to electricity grid operators in France and lower volumes to
private customers in the Nordics. Sales of gas decreased by
17%, mainly due to warmer weather and lower consumption in
the Netherlands and Germany.
Q3: Net sales increased by 95 %. Underlying operating profit
increased by 280 % mainly owing to a growing customer base in
Germany and temporary sourcing effects for electricity and gas.
This was offset in part by lower sales of gas due to warmer
weather in the Netherlands.
Rising energy prices is a challenge for many of Vattenfall’s
customers. Vattenfall’s customer service receive a lot of
questions about invoices, payments and the implications of new
regulations. Vattenfall gives advice to customers about energy
savings and helps its customers address the current situation
and find the most suitable solutions.
Vattenfall cooperates with the supermarket chain Netto for
installing fast charging stations at Netto stores in Germany. The
charging stations will be available to the general public and
supplied with electricity from renewable sources. The initial plan
is to install 940 charging points outside 270 Netto stores.
Construction will take place mainly in 2023 and 2024 with
Vattenfall in charge of planning, construction, and operation of
the charging stations.
KEY FIGURES – CUSTOMERS & SOLUTIONS
Jan-Sep Jan-Sep Jul-Sep Jul-Sep Full year Last 12
Amounts in SEK million unless indicated otherwise 2022 2021 2022 2021 2021 months
Net sales 123 558 70 738 44 140 22 694 106 560 159 380
External net sales 117 303 68 192 41 475 21 666 102 300 151 411
Underlying EBITDA 5 401 2 913 1 593 575 3 230 5 718
Underlying EBIT 4 691 2 245 1 341 353 2 349 4 795
Sales of electricity, TWh 68.7 70.6 21.2 21.9 96.1 94.2
- of which, private customers 20.2 19.3 5.5 5.2 26.8 27.7
- of which, resellers 14.2 5.3 4.5 1.8 7.9 16.8
- of which, business customers 34.3 46.0 11.2 14.9 61.4 49.7
Sales of gas, TWh 32.7 39.1 4.7 5.2 56.0 49.6
Number of employees, full-time equivalents 3 272 3 194 3 272 3 194 3 213
10
VATTENFALL INTERIM REPORT JANUARY–SEPTEMBER 2022
Power Generation
Power Generation comprises the Generation and Markets
Business Areas. The segment includes Vattenfall’s hydro and
nuclear power operations, maintenance services business, and
optimisation and trading operations including certain large
business customers. The result from hedging the Group’s net
exposure in electricity and fuel is reported in this segment.
Lower achieved price had a negative impact on earnings
• Postponed restart of nuclear reactor Ringhals 4
• Business Area Markets has signed a new contract with
Shell for the delivery of electricity from Vattenfall’s offshore
wind farm Thanet in the UK
Q1–Q3: Net sales increased by 86%. Underlying operating profit
decreased by 32%. The decrease was mainly attributable to
lower achieved prices in the Nordic countries that were affected
by major price differences between electricity price areas in
Sweden and a lower realised trading result mainly due to intra-
year timing effects which will be reversed in the future. The
realised trading result in 2021 was at an exceptionally high level.
Higher contribution from pumped hydro storage operations in
Germany and higher nuclear power generation (1.2 TWh) had
an offsetting impact. The average electricity spot price was
higher compared to the first nine months of 2021 but the
achieved price decreased due to higher price differences
between electricity price areas in Sweden.
Q3: Net sales increased by 93%. Underlying operating profit
decreased by 70% mainly owing to a lower realised trading
result and lower achieved prices in the Nordic countries due to
major price differences between electricity price areas in
Sweden. This was offset by higher contribution from pumped
hydro storage in Germany.
The restart after the annual maintenance and fuel replacement
shutdown at Ringhals 4 has been postponed to 31 January
2023. The reason for the postponement is that the plant’s
pressure vessel was damaged while undergoing mandatory
testing. No safety anomalies occurred at the plant and reactor
safety remained unaffected. The damage was limited to the
pressure regulator.
Business Area Markets has signed a five-year agreement with
Shell for the delivery of 300,000 MWh electricity from
Vattenfall’s offshore wind farm Thanet in the UK. This
corresponds to about one-third of the annual electricity
production at Thanet.
After the end of the quarter, the Swedish Radiation Safety
Authority and the Swedish Transmission System Operator,
Svenska Kraftnät, approved the capacity increase of Forsmark 1
nuclear reactor. The capacity increase will take place in two
stages, with approximately 50 MW in 2022 and an additional 50
MW in 2023.
KEY FIGURES – POWER GENERATION
Jan-Sep Jan-Sep Jul-Sep Jul-Sep Full year Last 12
Amounts in SEK million unless indicated otherwise 2022 2021 2022 2021 2021 months
Net sales 137 357 73 669 48 093 24 942 126 318 190 006
External net sales 17 416 23 350 4 140 8 682 40 312 34 378
Underlying EBITDA 13 508 17 641 2 537 5 230 23 714 19 581
Underlying EBIT 9 789 14 398 1 227 4 117 19 334 14 725
- of which, realised trading result 386 4 106 - 2 002 1 339 3 633 - 87
Electricity generation, TWh 60.3 59.5 19.8 16.6 81.2 82.0
- of which, hydro power 30.1 30.5 11.0 9.2 40.8 40.4
- of which, nuclear power 30.2 29.0 8.8 7.4 40.4 41.6
Sales of electricity, TWh 11.1 16.3 3.1 5.8 22.2 17.0
- of which, resellers 9.8 15.5 2.6 5.5 17.5 11.8
- of which, business customers 1.3 0.8 0.5 0.3 4.7 5.2
Sales of gas, TWh 0.5 0.7 0.1 0.1 1.1 0.9
Number of employees, full-time equivalents 7 238 7 307 7 238 7 307 7 260
11
VATTENFALL INTERIM REPORT JANUARY–SEPTEMBER 2022
Wind
The Wind Business Area is responsible for development,
construction and operation of Vattenfall’s wind farms as well as
large-scale and decentralised solar power and batteries.
Increased earnings as a result of higher electricity prices
and new capacity
• Foundation installation completed and delivery of first
electricity from offshore wind farm Hollandse Kust Zuid in
the Netherlands
• Prequalified to participate in tender of floating offshore wind
power in France
• Exercised option to continue to develop the offshore wind
power project N 7.2 in Germany which is expected to cover
the electricity consumption for over one million households
Q1–Q3: Net sales increased by 99% compared to 2021.
Underlying operating profit increased by 275% driven by higher
electricity prices on the Continent and new capacity, especially
attributable to the offshore wind farm Kriegers Flak in Denmark.
Electricity generation increased by 14% primarily as a result of
new capacity and higher wind speeds mainly in the beginning of
the year, especially in Sweden, Germany and Denmark.
Q3: Net sales increased by 129%. Underlying operating profit
increased by 371% mainly as a result of higher continental
electricity prices. Electricity generation decreased by 2% driven
by lower onshore production due to the partial divestment of the
wind farm Princess Ariane This was offset in part by higher
offshore production.
The construction of Vattenfall's wind farm Hollandse Kust Zuid is
moving ahead. The first electricity was delivered in August, and
September saw the completion of the last of the project's 140
foundations. The wind farm is expected to be fully operational in
2023 and have a total installed capacity of 1,520 MW,
equivalent to the annual electricity consumption of 1.5 million
Dutch households.
Vattenfall has been pre-qualified for the upcoming tender for
floating offshore wind power in France. Two areas have been
identified for the project, each with a capacity of 250 MW, or the
annual energy consumption of half a million French households.
The decision to award the project is expected in late 2023, and
the wind farms are expected to be commissioned at the end of
this decade.
Vattenfall used its option to continue to develop to develop the
offshore wind project N-7.2 off the German North Sea coast.
The project will have a total capacity of 980 MW, corresponding
to more than the annual electricity consumption of a million
German households. Pending a final investment decision, the
wind farm could be connected to the German power grid in
2027.
In late September, Vattenfall entered into an agreement with
Siemens Energy and Aker Solutions AS for the delivery of grid
connection infrastructure for the offshore wind farm Norfolk
Boreas off the UK coast. According to the agreement, Siemens
Energy and Aker Solutions is responsible for the technology, the
procurement procedure, construction, and installation of
onshore and offshore high voltage direct current transformer
stations as well as connecting the project to the transmission
grid.
KEY FIGURES – WIND
Jan-Sep Jan-Sep Jul-Sep Jul-Sep Full year Last 12
Amounts in SEK million unless indicated otherwise 2022 2021 2022 2021 2021 months
Net sales 21 122 10 615 8 155 3 559 20 872 31 379
External net sales 3 213 3 641 1 156 1 022 7 791 7 363
Underlying EBITDA 16 411 7 332 6 732 2 566 13 451 22 530
Underlying EBIT 11 958 3 188 5 230 1 110 7 866 16 636
Electricity generation - wind power TWh 8.6 7.5 2.3 2.3 11.2 12.3
Sales of electricity, TWh 0.8 0.7 0.3 0.2 1.0 1.1
Number of employees, full-time equivalents 1 491 1 250 1 491 1 250 1 279
12
VATTENFALL INTERIM REPORT JANUARY–SEPTEMBER 2022
Heat
The Heat Business Area comprises Vattenfall’s heat business
(district heating and decentralised solutions) and gas-fired
condensing plants.
Lower clean spark spreads affected results negatively
• Higher gas prices could not be covered by higher heat and
electricity revenues
• Joint venture with Midlothian Council to invest in low carbon
energy solutions in Scotland
• Increased integration of excess heat into Vattenfall’s district
heating network through corporation with AstaReal in
Sweden and AEB in the Netherlands
Q1–Q3: Net sales increased by 116%. The underlying operating
profit decreased by 523% compared to the first nine months of
2021, mainly owing to higher gas prices which led to lower clean
spark spreads primarily affecting heat operations. Higher
operating expenses largely driven by planned maintenance also
impacted the underlying operating profit negatively. This was
partly offset by higher heat prices following post-hoc price
adjustments for the fuel price development. Hedging of spreads
also had an offsetting effect, which is reported in the Power
Generation operating segment.
Electricity generation decreased as a result of the lower spreads
and sales of heat decreased due to higher temperatures.
Compared to year-end 2021, the number of customers
increased by 2.1% to the equivalent of 2.0 million households1
.
Q3: Net sales increased by 181%. The underlying operating
profit decreased by 44% compared to the third quarter 2021.
Higher gas prices resulted in lower clean spark spreads which
affected the heat operations. Higher operating expenses due to
planned maintenance also had a negative impact on the
underlying operating profit. Higher heat prices had an offsetting
impact as they undergo subsequent adjustment for the
increasing fuel prices.
In September, Vattenfall and Midlothian Council formed a joint
venture (50/50) in Scotland, called Midlothian Energy Limited.
The parties plan to invest GBP 100 million in low carbon energy
solutions over the next five years. Construction of the first district
heating grid is planned to start before the end of the year. Upon
completion, the project is expected to be able to deliver heating
to 3,000 households as well as premises for education and
retail. Initially, excess heat from a waste and recycling plant will
be integrated into the district heating grid.
Vattenfall is working on integrating more excess heat into the
district heating grid. Vattenfall’s partnership with AstaReal in
Sweden is an example where the first excess heat from algae
cultivation was delivered to households in Gustavsberg via
Vattenfall’s district heating grid. Excess heat integration from
waste is also part of the transition to heating without natural gas
in Amsterdam. The capacity between Vattenfall’s partially
owned district heating grid and AEB’s waste incineration plant in
Amsterdam has been expanded and the first heat was delivered
in the third quarter.
KEY FIGURES – HEAT
Jan-Sep Jan-Sep Jul-Sep Jul-Sep Full year Last 12
Amounts in SEK million unless indicated otherwise 2022 2021 2022 2021 2021 months
Net sales 42 466 19 640 14 502 5 170 34 759 57 585
External net sales 14 098 9 836 3 914 2 433 14 655 18 917
Underlying EBITDA - 519 2 827 - 635 - 179 2 590 - 756
Underlying EBIT - 2 701 638 - 1 301 - 906 - 343 - 3 682
Electricity generation - TWh 11.7 13.6 3.0 2.9 19.0 17.1
- of which, fossil-based power 11.5 13.4 3.0 2.8 18.6 16.7
- of which, biomass, waste 0.2 0.2 — 0.1 0.3 0.3
Sales of electricity business customers, TWh 0.9 0.9 0.3 0.3 1.2 1.2
Sales of heat, TWh 9.5 10.5 1.3 1.3 15.6 14.6
Number of employees, full-time equivalents 3 150 3 165 3 150 3 165 3 126
1) Including decentralised energy solutions that have previously been reported separately
13
VATTENFALL INTERIM REPORT JANUARY–SEPTEMBER 2022
Distribution
The Distribution Business Area comprises Vattenfall’s electricity
distribution operations in Sweden and the UK.
High demand for connections to the electricity grid
• Upgrades to regional grid progressing with the inauguration
of a regional grid station in Stockholm and detailed planning
for a 150-kV transmission line in Luleå
• Connection project in Gothenburg selected to be part of an
initiative to reduce lead times for expanding the power grid
• Pilot project for flexible fast charging of electric vehicles in
Riksgränsen in northern Sweden
Q1–Q3: Net sales decreased by 35% and the underlying
operating profit decreased by 48% compared to 2021. The sale
of Stromnetz Berlin on 1 July 2021 affected the net sales
comparison by SEK 5.3 billion and the underlying operating
profit negatively by SEK 0.7 billion. In addition, the underlying
operating profit was affected by higher operating expenses and
a lower gross margin in the Swedish operation, mainly owing to
higher costs related to the transmission network as well as an
increase in network losses caused by higher electricity prices.
Q3: Net sales increased by 8% compared to 2021. Underlying
operating profit decreased by 47% due to higher operating
expenses, mainly due to higher personnel expenses, which was
partly offset by a higher gross margin.
In order to meet the Stockholm region's growth and increased
demand for electricity, the regional grid is undergoing extensive
upgrades. Transformer stations are being rebuilt, new power
lines are being constructed, and existing ones are reinforced to
increase capacity. The work is expected to be completed by
2030 with investments totalling SEK 1.8 billion. As part of the
upgrades, a new regional grid station was inaugurated in
Barkarby in September to increase the power grid capacity and
secure the power supply.
Vattenfall’s customers are determined to decarbonise their
activities and the area around Luleå has seen record-high
demand for connections. Vattenfall is strengthening the regional
grid in the area in stages and has recently been awarded a line
concession for a 150 kV transmission line between Lerbäcken
and Hertsöfältet in Luleå. The detailed planning phase has
begun and the project is expected to be completed in
2024/2025.
Shorter permitting processes for the power grid are central to
enable the energy transition. To that end, the Swedish Energy
Markets Inspectorate has selected yet another Vattenfall project
to participate in the government initiative to shorten lead times
to expand the power grid. The connection project that was
picked should facilitate increased power output, which is a
prerequisite for a sustainable industry transition in the
Gothenburg area.
Vattenfall's new pilot project for flexible, fast charging of electric
vehicles is in progress in Riksgränsen, Sweden's northernmost
border. The project enables connection to the power grid in an
area that currently has limited capacity. The next step is to test
and analyse the solution within the framework of the R&D
project FlexConnect.
In these turbulent times, many of Vattenfall’s customers are
concerned about the market situation, and customer service
enquiries are up by 200% in 2022 compared to 2021. Many
customers are looking to start producing their own electricity;
and so far this year Vattenfall has received 11,000 connection
requests. That represents a 100% increase compared to the
same time last year. Vattenfall is in the process of changing
over to a large-scale workflow approach to reduce the wait times
to connect new production while strengthening operations with
additional resources.
After the end of the quarter, the Swedish Energy Markets
Inspectorate approved the concession application initially filed in
October 2020 for two 130 kV overhead power lines from
Hedelunda to Oxelösund. The lines will enable the connection of
SSAB’s electric arc furnace, which will result in a substantial
reduction in CO2 emissions.
KEY FIGURES – DISTRIBUTION
Jan-Sep Jan-Sep Jul-Sep Jul-Sep Full year Last 12
Amounts in SEK million unless indicated otherwise 2022 2021 2022 2021 2021 months
Net sales 9 026 13 833 2 503 2 308 17 262 12 455
External net sales 8 461 11 338 2 280 2 140 14 643 11 766
Underlying EBITDA 3 298 4 811 756 838 5 913 4 400
Underlying EBIT 1 413 2 693 128 240 3 152 1 872
Number of employees, full-time equivalents 1 322 1 161 1 322 1 161 1 165
14
VATTENFALL INTERIM REPORT JANUARY–SEPTEMBER 2022
Other
Other pertains mainly to all Staff functions, including Treasury
and Shared Service Centres.
Net sales consist primarily of revenues attributable to
Vattenfall’s service organisations such as Shared Services, IT
and Vattenfall Insurance.
KEY FIGURES – OTHER
Jan-Sep Jan-Sep Jul-Sep Jul-Sep Full year Last 12
Amounts in SEK million unless indicated otherwise 2022 2021 2022 2021 2021 months
Net sales 6 157 4 455 2 148 1 426 6 169 7 871
External net sales 334 233 111 182 418 519
Underlying EBITDA - 453 - 231 - 106 126 - 326 - 548
Underlying EBIT - 1 111 - 913 - 336 - 125 - 1 189 - 1 387
Number of employees, full-time equivalents 3 000 2 806 3 000 2 806 2 792
15
VATTENFALL INTERIM REPORT JANUARY–SEPTEMBER 2022
Consolidated income statement
Jan-Sep Jan-Sep Jul-Sep Jul-Sep Full year Last 12
Amounts in SEK million 2022 2021 2022 2021 2021 months
Net sales 160 825 116 590 53 076 36 125 180 119 224 354
Cost of purchases - 82 800 - 44 402 - 27 059 - 10 286 - 87 474 - 125 872
Other external expenses - 14 466 - 13 386 - 5 061 - 3 447 - 18 450 - 19 530
Personnel expenses - 15 142 - 14 807 - 4 734 - 4 306 - 19 801 - 20 136
Other operating income and expenses, net 503 21 613 172 9 292 21 454 344
Participations in the results of associated companies 103 - 43 - 8 - 85 - 58 88
Operating profit before depreciation, amortisation and impairment
losses (EBITDA) 49 023 65 565 16 386 27 293 75 790 59 248
Depreciation, amortisation and impairments - 12 316 - 13 044 - 4 194 - 4 367 - 15 519 - 14 791
Operating profit (EBIT) 36 707 52 521 12 192 22 926 60 271 44 457
Financial income3
609 673 5
227 426 5
783 719
Financial expenses1,2,3
- 6 140 - 4 307 5
- 2 032 - 1 737 5
- 5 906 - 7 739
Return from the Swedish Nuclear Waste Fund - 6 543 3 330 - 659 567 4 225 - 5 648
Profit before income taxes 24 633 52 217 9 728 22 182 59 373 31 789
Income taxes - 7 653 - 10 305 - 3 044 - 3 905 - 11 360 - 8 708
Profit for the period 16 980 41 912 6 684 18 277 48 013 23 081
Attributable to owner of the Parent Company 16 502 41 054 6 242 18 178 46 828 22 276
Attributable to non-controlling interests 478 858 442 99 1 185 805
Supplementary information
Underlying EBITDA4
37 451 35 134 10 820 9 149 48 584 50 901
Underlying EBIT4
23 844 22 090 6 232 4 782 31 181 32 935
Financial items, net excl. discounting effects attributable
to provisions and return from the Swedish Nuclear Waste Fund - 4 032 - 2 106 - 1 304 - 802 - 3 090 - 5 016
1) Including interest components related to pension costs - 431 - 328 - 145 - 110 - 439 - 542
2) Including discounting effects attributable to provisions - 1 499 - 1 528 - 501 - 509 - 2 033 - 2 004
3) Items affecting comparability recognised as
financial income and expenses, net 6 - 6 2 — - 6 6
4) See note 5 for information on items affecting comparability
5) The value has been adjusted compared with information previously published in Vattenfall’s financial reports.
16
VATTENFALL INTERIM REPORT JANUARY–SEPTEMBER 2022
Consolidated statement of
comprehensive income
Jan-Sep Jan-Sep Jul-Sep Jul-Sep Full year Last 12
Amounts in SEK million 2022 2021 2022 2021 2021 months
Profit for the period 16 980 41 912 6 684 18 277 48 013 23 081
Other comprehensive income
Items that will be reclassified to profit or loss when specific conditions
are met
Cash flow hedges - changes in fair value 72 847 61 824 43 412 45 462 82 259 93 282
Cash flow hedges - dissolved against income statement - 76 399 - 8 675 - 37 832 - 5 653 - 31 553 - 99 277
Cash flow hedges - transferred to cost of hedged item 4 11 - 1 2 16 9
Hedging of net investments in foreign operations - 2 013 - 977 - 426 - 405 - 1 414 - 2 450
Translation differences, divested companies — 689 — 643 697 8
Translation differences 10 232 1 870 2 606 538 3 218 11 580
Income taxes related to items that will be reclassified - 3 627 - 16 347 - 2 570 - 12 093 - 15 420 - 2 700
Total items that will be reclassified to profit or loss when specific
conditions are met 1 044 38 395 5 189 28 494 37 803 452
Items that will not be reclassified to profit or loss
Remeasurement pertaining to defined benefit obligations 16 557 426 3 451 - 2 - 670 15 461
Income taxes related to items that will not be reclassified - 4 575 - 5 - 1 059 — 226 - 4 344
Total items that will not be reclassified to profit or loss 11 982 421 2 392 - 2 - 444 11 117
Total other comprehensive income, net after income taxes 13 026 38 816 7 581 28 492 37 359 11 569
Total comprehensive income for the period 30 006 80 728 14 266 46 769 85 372 34 650
Attributable to owner of the Parent Company 28 830 79 727 13 611 46 646 83 915 33 018
Attributable to non-controlling interests 1 176 1 001 655 123 1 457 1 632
17
VATTENFALL INTERIM REPORT JANUARY–SEPTEMBER 2022
Operating segments, Vattenfall Group
Jan-Sep Jan-Sep Jul-Sep Jul-Sep Full year Last 12
Amounts in SEK million 2022 2021 2022 2021 2021 months
External net sales
Customers & Solutions 117 303 68 192 41 475 21 666 102 300 151 411
Power Generation 17 416 23 350 4 140 8 682 40 312 34 378
Wind 3 213 3 641 1 156 1 022 7 791 7 363
Heat 14 098 9 836 3 914 2 433 14 655 18 917
Distribution 8 461 11 338 2 280 2 140 14 643 11 766
- of which, Distribution Germany — 3 202 — 4 3 203 1
- of which, Distribution Sweden 8 358 8 042 2 245 2 105 11 310 11 626
Other1
334 233 111 182 418 519
Total 160 825 116 590 53 076 36 125 180 119 224 354
Internal net sales
Customers & Solutions 6 255 2 546 2 665 1 028 4 260 7 969
Power Generation 119 941 50 319 43 953 16 260 86 006 155 628
Wind 17 909 6 974 6 999 2 537 13 081 24 016
Heat 28 368 9 804 10 588 2 737 20 104 38 668
Distribution 565 2 495 223 168 2 619 689
- of which, Distribution Germany — 2 062 — 2 2 061 - 1
- of which, Distribution Sweden 566 447 214 170 586 705
Other1
5 823 4 222 2 037 1 244 5 751 7 352
Eliminations - 178 861 - 76 360 - 66 465 - 23 974 - 131 821 - 234 322
Total — — — — — —
Total net sales
Customers & Solutions 123 558 70 738 44 140 22 694 106 560 159 380
Power Generation 137 357 73 669 48 093 24 942 126 318 190 006
Wind 21 122 10 615 8 155 3 559 20 872 31 379
Heat 42 466 19 640 14 502 5 170 34 759 57 585
Distribution 9 026 13 833 2 503 2 308 17 262 12 455
- of which, Distribution Germany — 5 264 — 6 5 264 —
- of which, Distribution Sweden 8 924 8 489 2 459 2 275 11 896 12 331
Other1
6 157 4 455 2 148 1 426 6 169 7 871
Eliminations - 178 861 - 76 360 - 66 465 - 23 974 - 131 821 - 234 322
Total 160 825 116 590 53 076 36 125 180 119 224 354
18
VATTENFALL INTERIM REPORT JANUARY–SEPTEMBER 2022
Jan-Sep Jan-Sep Jul-Sep Jul-Sep Full year Last 12
Amounts in SEK million 2022 2021 2022 2021 2021 months
Operating profit before depreciation, amortisation and impairment
losses (EBITDA)
Customers & Solutions 5 404 2 923 1 596 585 3 241 5 722
Power Generation 25 746 39 445 8 904 14 641 42 053 28 354
Wind 16 434 7 407 6 733 2 640 13 534 22 561
Heat - 1 312 2 854 - 1 418 - 187 2 842 - 1 324
Distribution 3 308 4 810 757 838 5 911 4 409
- of which, Distribution Germany — 1 008 — 1 1 008 —
- of which, Distribution Sweden 3 281 3 764 744 818 4 873 4 390
Other1
- 362 8 285 - 129 8 783 8 197 - 450
Eliminations - 195 - 159 - 57 - 7 12 - 24
Total 49 023 65 565 16 386 27 293 75 790 59 248
Underlying EBITDA
Customers & Solutions 5 401 2 913 1 593 575 3 230 5 718
Power Generation 13 508 17 641 2 537 5 230 23 714 19 581
Wind 16 411 7 332 6 732 2 566 13 451 22 530
Heat - 519 2 827 - 635 - 179 2 590 - 756
Distribution 3 298 4 811 756 838 5 913 4 400
- of which, Distribution Germany — 1 009 — 1 1 009 —
- of which, Distribution Sweden 3 271 3 764 743 818 4 874 4 381
Other1
- 453 - 231 - 106 126 - 326 - 548
Eliminations - 195 - 159 - 57 - 7 12 - 24
Total 37 451 35 134 10 820 9 149 48 584 50 901
Jan-Sep Jan-Sep Jul-Sep Jul-Sep Full year Last 12
Amounts in SEK million 2022 2021 2022 2021 2021 months
Operating profit (EBIT)
Customers & Solutions 4 694 2 255 1 345 362 2 446 4 885
Power Generation 22 025 36 201 7 595 13 530 39 502 25 326
Wind 11 981 3 264 5 231 1 185 7 919 16 636
Heat - 2 203 665 - 1 691 - 914 - 91 - 2 959
Distribution 1 424 2 692 128 240 3 150 1 882
- of which, Distribution Germany — 665 — 1 665 —
- of which, Distribution Sweden 1 447 2 032 132 236 2 515 1 930
Other1
- 1 019 7 603 - 359 8 530 7 333 - 1 289
Eliminations - 195 - 159 - 57 - 7 12 - 24
Operating profit (EBIT) 36 707 52 521 12 192 22 926 60 271 44 457
Financial net - 12 074 - 304 - 2 464 - 744 - 898 - 12 668
Profit before tax 24 633 52 217 9 728 22 182 59 373 31 789
Underlying EBIT
Customers & Solutions 4 691 2 245 1 341 353 2 349 4 795
Power Generation 9 789 14 398 1 227 4 117 19 334 14 725
Wind 11 958 3 188 5 230 1 110 7 866 16 636
Heat - 2 701 638 - 1 301 - 906 - 343 - 3 682
Distribution 1 413 2 693 128 240 3 152 1 872
- of which, Distribution Germany — 666 — 1 666 —
- of which, Distribution Sweden 1 437 2 032 131 236 2 516 1 921
Other1
- 1 111 - 913 - 336 - 125 - 1 189 - 1 387
Eliminations - 195 - 159 - 57 - 7 12 - 24
Underlying EBIT 23 844 22 090 6 232 4 782 31 181 32 935
1) “Other” pertains mainly to all Staff functions, including Treasury, Shared Service Centres and material capital gains and -losses.
19
VATTENFALL INTERIM REPORT JANUARY–SEPTEMBER 2022
Consolidated balance sheet
30 Sep 30 Sep 31 Dec
Amounts in SEK million 2022 2021 2021
Assets
Non-current assets
Intangible assets: non-current 18 282 16 853 17 070
Property, plant and equipment 268 624 243 329 252 828
Participations in associated companies and joint arrangements 6 609 4 864 6 110
Other shares and participations 321 311 313
Share in the Swedish Nuclear Waste Fund 46 339 51 364 52 772
Derivative assets 100 852 29 459 35 240
Deferred tax assets 10 794 8 258 8 905
Contract assets1
56 95 85
Other non-current receivables 6 122 6 454 6 118
Total non-current assets 457 999 360 987 379 441
Current assets
Inventories 24 688 22 391 41 539
Intangible assets: current 1 517 42 4 861
Trade receivables and other receivables 39 836 46 951 41 219
Contract assets1
204 357 290
Advance payments paid 16 420 5 443 8 362
Derivative assets 275 435 111 648 120 645
Prepaid expenses and accrued income 11 546 7 045 12 402
Current tax assets 335 1 361 2 717
Short-term investments 95 953 63 803 102 706
Cash and cash equivalents 173 367 67 644 68 176
Assets held for sale 5 189 38 —
Total current assets 644 490 326 723 402 917
Total assets 1 102 489 687 710 782 358
Equity and liabilities
Equity
Attributable to owner of the Parent Company 186 164 176 034 180 710
Attributable to non-controlling interests 18 160 15 100 16 472
Total equity 204 324 191 134 197 182
Non-current liabilities
Hybrid Capital 21 960 20 135 20 421
Other interest-bearing liabilities 54 540 50 517 50 839
Pension provisions 24 457 39 247 40 328
Other interest-bearing provisions 147 767 113 113 116 637
Derivative liabilities 101 831 24 025 30 307
Deferred tax liabilities 48 518 35 463 33 913
Contract liabilities1
7 770 7 109 7 422
Other noninterest-bearing liabilities 2 089 1 945 2 018
Total non-current liabilities 408 932 291 554 301 885
Current liabilities
Trade payables and other liabilities 23 971 34 725 39 241
Contract liabilities1
981 953 1 213
Advance payments received 123 595 54 979 62 790
Derivative liabilities 240 667 83 505 99 511
Accrued expenses and deferred income 16 903 11 143 18 460
Current tax liabilities 2 353 2 797 2 418
Other interest-bearing liabilities 77 430 13 776 55 148
Interest-bearing provisions 3 205 3 144 4 510
Liabilities associated with assets held for sale 128 — —
Total current liabilities 489 233 205 022 283 291
Total equity and liabilities 1 102 489 687 710 782 358
1) The presentation has been adjusted compared with information previously published in Vattenfall’s financial reports. See note 1.
20
VATTENFALL INTERIM REPORT JANUARY–SEPTEMBER 2022
SUPPLEMENTARY INFORMATION
30 Sep 30 Sep 31 Dec
Amounts in SEK million 2022 2021 2021
Calculation of capital employed
Intangible assets: current and non-current 19 799 16 895 21 931
Property, plant and equipment 268 624 243 329 252 828
Participations in associated companies and joint arrangements 6 609 4 864 6 110
Deferred and current tax assets 11 129 9 619 11 622
Non-current noninterest-bearing receivables 4 194 3 443 3 563
Current and non-current contract assets 260 452 375
Inventories 24 688 22 391 41 539
Trade receivables and other receivables 39 836 46 951 41 219
Prepaid expenses and accrued income 11 546 7 045 12 402
Unavailable liquidity 2 233 3 854 3 446
Other 712 339 643
Total assets excl. financial assets 389 630 359 182 395 678
Deferred and current tax liabilities - 50 871 - 38 260 - 36 331
Other noninterest-bearing liabilities - 2 089 - 1 945 - 2 018
Current and non-current contract liabilities - 8 751 - 8 062 - 8 635
Trade payable and other liabilities - 23 971 - 34 725 - 39 241
Accrued expenses and deferred income - 16 903 - 11 143 - 18 460
Other - 1 378 - 422 - 899
Total noninterest-bearing liabilities - 103 963 - 94 557 - 105 584
Other interest-bearing provisions not related to adjusted net debt1
- 27 220 - 9 441 - 9 213
Capital employed2
258 447 255 184 280 881
Capital employed, average 256 816 258 053 271 674
Calculation of net debt
Hybrid Capital - 21 960 - 20 135 - 20 421
Bond issues and liabilities to credit institutions - 44 184 - 41 231 - 37 732
Short-term debt, commercial papers and repo - 67 532 - 1 548 - 46 189
Liabilities to associated companies - 947 - 1 103 - 1 452
Liabilities to owners of non-controlling interests - 10 002 - 10 883 - 10 747
Other liabilities - 9 306 - 9 528 - 9 867
Total interest-bearing liabilities - 153 931 - 84 428 - 126 408
Cash and cash equivalents 173 367 67 644 68 176
Short-term investments 95 953 63 803 102 706
Loans to owners of non-controlling interests in foreign Group companies 619 329 229
Net debt2
116 008 47 348 44 703
Calculation of adjusted gross debt and net debt
Total interest-bearing liabilities - 153 931 - 84 428 - 126 408
50% of Hybrid Capital3
10 980 10 068 10 211
Present value of pension obligations - 24 457 - 39 247 - 40 328
Provisions for gas and wind operations and other environment-related provisions - 13 754 - 11 188 - 11 687
Provisions for nuclear power (net)4
- 54 086 - 37 869 - 40 233
Margin calls received 2 282 2 919 3 340
Liabilities to owners of non-controlling interests due to consortium agreements 10 002 10 883 10 747
Adjusted gross debt - 222 964 - 148 862 - 194 358
Reported cash and cash equivalents and short-term investments 269 320 131 447 170 882
Unavailable liquidity - 2 233 - 3 854 - 3 446
Adjusted cash and cash equivalents and short-term investments 267 087 127 593 167 436
Adjusted net debt2
44 123 - 21 269 - 26 922
1) Includes personnel-related provisions for non-pension purposes, provisions for tax and legal disputes and certain other provisions.
2) See Definitions and calculations of key ratios for definitions of Alternative Performance Measures.
3) 50% of Hybrid Capital is treated as equity by the rating agencies, which thereby reduces adjusted net debt.
4) The calculation is based on Vattenfall’s share of ownership in the respective nuclear power plants, less Vattenfall’s share in the Swedish Nuclear Waste Fund and
liabilities relating to funding of decommissioning obligations in Stade and Brokdorf. Vattenfall has the following ownership interests in the respective plants: Forsmark
66%, Ringhals 70.4%, Brokdorf 20%, Brunsbüttel 66.7%, Krümmel 50% and Stade 33.3%. (According to a special agreement, Vattenfall is responsible for 100% of the
provisions for Ringhals.)
21
VATTENFALL INTERIM REPORT JANUARY–SEPTEMBER 2022
Consolidated statement of cash flows
Jan-Sep Jan-Sep Jul-Sep Jul-Sep Full year Last 12
Amounts in SEK million 2022 2021 2022 2021 2021 months
Operating activities
Operating profit before depreciation, amortisation and impairment losses
(EBITDA) 49 023 65 565 16 386 27 293 75 790 59 248
Tax paid - 2 738 - 2 721 - 883 - 1 008 - 6 725 - 6 742
Capital gains/losses, net - 110 - 8 636 28 - 8 737 - 8 760 - 234
Interest received 508 353 298 177 523 678
Interest paid - 2 833 - 2 571 - 793 - 252 - 3 226 - 3 488
Other, incl. non-cash items - 16 252 - 24 510 - 7 731 - 11 419 - 11 506 - 3 248
Funds from operations (FFO) 27 598 27 480 7 305 6 054 46 096 46 214
Changes in inventories 20 093 - 3 955 20 251 - 1 072 - 23 067 981
Changes in operating receivables 9 529 - 11 556 157 - 2 466 - 31 816 - 10 731
Changes in operating liabilities1
- 12 800 8 561 - 6 151 5 103 26 232 4 871
Margin calls1
67 044 79 226 70 914 55 673 88 995 76 813
Other changes - 2 450 - 2 236 - 2 091 - 2 069 - 4 608 - 4 822
Cash flow from changes in operating assets and operating liabilities 81 416 70 040 83 080 55 169 55 736 67 112
Cash flow from operating activities 109 014 97 520 90 385 61 223 101 832 113 326
Investing activities
Acquisitions in Group companies1
- 173 - 55 — - 53 - 114 - 232
Investments in associated companies and other shares and participations - 72 - 177 - 43 - 260 - 278 - 173
Other investments in non-current assets - 17 063 - 17 572 - 7 493 - 6 790 - 25 157 - 24 648
Total investments - 17 308 - 17 804 - 7 536 - 7 103 - 25 549 - 25 053
Divestments1
294 19 296 41 19 320 19 579 577
Changes in short-term investments1
11 012 - 34 640 - 29 706 - 27 455 - 73 051 - 27 399
Cash flow from investing activities - 6 002 - 33 148 - 37 201 - 15 238 - 79 021 - 51 875
Cash flow before financing activities 103 012 64 372 53 184 45 985 22 811 61 451
Financing activities
Changes in loans to owners of non-controlling interests in foreign Group
companies - 362 51 39 118 153 - 260
Loans raised2
54 749 6 536 8 282 670 51 150 99 363
Amortisation of other debt2
- 31 631 - 32 133 19 943 - 6 419 - 35 870 - 35 368
Divestment of shares in Group companies to owners of non-controlling
interests — 4 016 — 4 016 4 025 9
Redemption of Hybrid Capital — - 2 941 — - 104 - 2 941 —
Issue of Hybrid Capital — 6 481 — — 6 481 —
Dividends paid to owners - 24 191 - 5 189 - 210 - 65 - 5 190 - 24 192
Contribution to owners of non-controlling interests - 923 - 229 - 400 — - 601 - 1 295
Contribution from owners of non-controlling interests 2 210 545 1 575 533 1 786 3 451
Cash flow from financing activities - 148 - 22 863 29 229 - 1 251 18 993 41 708
Cash flow for the period 102 864 41 509 82 413 44 734 41 804 103 159
Jan-Sep Jan-Sep Jul-Sep Jul-Sep Full year Last 12
Amounts in SEK million 2022 2021 2022 2021 2021 months
Cash and cash equivalents
Cash and cash equivalents at start of period 68 176 26 074 90 177 20 463 26 074 67 644
Cash and cash equivalents included in assets held for sale — — — 2 400 — —
Cash flow for the period 102 864 41 509 82 413 44 734 41 804 103 159
Translation differences 2 327 61 777 47 298 2 564
Cash and cash equivalents at end of period 173 367 67 644 173 367 67 644 68 176 173 367
1) The value has been adjusted compared with information previously published in Vattenfall’s financial reports. See note 1.
2) Short-term borrowings in which the duration is three months or shorter are reported net.
22
VATTENFALL INTERIM REPORT JANUARY–SEPTEMBER 2022
SUPPLEMENTARY INFORMATION
Jan-Sep Jan-Sep Jul-Sep Jul-Sep Full year Last 12
Amounts in SEK million 2022 2021 2022 2021 2021 months
Cash flow before financing activities 103 012 64 372 53 184 45 985 22 811 61 451
Change in margin calls from Treasury operations - 1 259 - 1 518 347 - 387 - 1 700 - 1 441
Changes in short-term investments - 11 012 34 640 29 706 27 455 73 051 27 399
Financing activities
Divestment of shares in Group companies to owners of non-controlling
interests — 4 016 — 4 016 4 025 9
Dividends paid to owners - 24 191 - 5 189 - 210 - 65 - 5 190 - 24 192
Contribution to/from owners of non-controlling interests 1 287 316 1 175 533 1 185 2 156
Cash flow after dividend 67 837 96 637 84 202 77 537 94 182 65 382
Analysis of change in net debt
Net debt at start of period 44 703 - 48 178 29 322 - 32 328 - 48 178 47 348
Cash flow after dividend 67 837 96 637 84 202 77 537 94 182 65 382
Changes as a result of valuation at fair value 2 495 803 1 223 195 660 2 352
Changes in interest-bearing liabilities for leasing - 1 052 - 997 - 191 - 390 - 1 442 - 1 497
Interest-bearing liabilities/short-term investments acquired/divested — - 2 — - 2 - 13 - 11
Cash and cash equivalents included in assets held for sale — — — 2 400 — —
Interest-bearing liabilities associated with assets held for sale — — — - 106 — —
Translation differences on net debt 2 025 - 915 1 452 42 - 506 2 434
Net debt at end of period 116 008 47 348 116 008 47 348 44 703 116 008
Cash flow from operating activities 109 014 97 520 90 385 61 223 101 832 113 326
Maintenance/replacement investments - 6 717 - 7 216 - 2 599 - 3 527 - 11 012 - 10 513
Free cash flow1
102 297 90 304 87 786 57 696 90 820 102 813
1) See Definitions and calculations of key ratios for definitions of Alternative Performance Measures.
23
VATTENFALL INTERIM REPORT JANUARY–SEPTEMBER 2022
INVESTMENTS
Jan-Sep Jan-Sep Jul-Sep Jul-Sep Full year Last 12
Amounts in SEK million 2022 2021 2022 2021 2021 months
Electricity generation
Hydro power 452 481 203 169 795 766
Nuclear power 1 163 843 419 289 1 263 1 583
Gas 200 43 59 21 64 221
Wind power and solar PV 10 558 9 182 4 933 2 686 11 157 12 533
Biomass, waste 11 71 2 32 73 13
Total electricity generation 12 384 10 620 5 616 3 197 13 352 15 116
CHP/heat
Fossil-based power 567 516 310 252 1 053 1 104
Heat networks 830 901 323 326 1 511 1 440
Other 51 161 49 55 483 373
Total CHP/heat 1 448 1 578 682 633 3 047 2 917
Electricity networks
Electricity networks 3 146 3 839 1 143 953 5 758 5 065
Total electricity networks 3 146 3 839 1 143 953 5 758 5 065
Purchases of shares, shareholder contributions 245 233 43 313 400 412
Other 1 358 983 524 344 1 557 1 932
Total investments 18 581 17 253 8 008 5 440 24 114 25 442
Accrued investments, unpaid invoices (-)/release of accrued investments
(+) - 1 273 551 - 472 1 663 1 443 - 381
Cash and cash equivalents in acquired companies — — — — - 8 - 8
Total investments with cash flow effect 17 308 17 804 7 536 7 103 25 549 25 053
24
VATTENFALL INTERIM REPORT JANUARY–SEPTEMBER 2022
Consolidated statement of changes in equity
30 Sep 2022 30 Sep 2021 31 Dec 2021
Amounts in SEK million
Attributable
to owner of
the Parent
Company
Attributable
to non-
controlling
interests
Total
equity
Attributable
to owner of
the Parent
Company
Attributable
to non-
controlling
interests
Total
equity
Attributable
to owner of
the Parent
Company
Attributable
to non-
controlling
interests
Total
equity
Balance brought forward 180 710 16 472 197 182 97 724 13 468 111 192 97 724 13 468 111 192
Profit for the period 16 502 478 16 980 41 054 858 41 912 46 828 1 185 48 013
Cash flow hedges - changes in fair value 72 847 — 72 847 61 824 — 61 824 82 259 — 82 259
Cash flow hedges - dissolved against
income statement - 76 399 — - 76 399 - 8 691 16 - 8 675 - 31 569 16 - 31 553
Cash flow hedges - transferred to cost of
hedged item 4 — 4 11 — 11 16 — 16
Hedging of net investments in foreign
operations - 2 013 — - 2 013 - 977 — - 977 - 1 414 — - 1 414
Translation differences - divested
companies — — — 689 — 689 697 — 697
Translation differences - foreign operations 9 534 698 10 232 1 740 130 1 870 2 983 235 3 218
Remeasurement pertaining to defined
benefit obligations 16 557 — 16 557 426 — 426 - 700 30 - 670
Income taxes related to other
comprehensive income - 8 202 — - 8 202 - 16 349 - 3 - 16 352 - 15 185 - 9 - 15 194
Total other comprehensive income for
the period 12 328 698 13 026 38 673 143 38 816 37 087 272 37 359
Total comprehensive income for the
period 28 830 1 176 30 006 79 727 1 001 80 728 83 915 1 457 85 372
Dividends paid to owners - 23 414 - 777 - 24 191 - 4 000 - 1 189 - 5 189 - 4 000 - 1 190 - 5 190
Group contributions from(+)/to(-) owners of
non-controlling interests — — — — — — — 51 51
Changes in ownership in Group companies
on divestments of shares to owners of non-
controlling interests — — — 2 532 1 504 4 036 2 538 1 508 4 046
Contribution to/from owners of non-
controlling interests — 1 287 1 287 — 316 316 — 1 185 1 185
Other changes in ownership — 2 2 51 — 51 — — —
Other changes 38 — 38 — — — 533 - 7 526
Total transactions with equity holders - 23 376 512 - 22 864 - 1 417 631 - 786 - 929 1 547 618
Balance carried forward 186 164 18 160 204 324 176 034 15 100 191 134 180 710 16 472 197 182
- Of which, Reserve for hedges 29 378 8 29 386 38 569 8 38 577 36 968 8 36 976
25
VATTENFALL INTERIM REPORT JANUARY–SEPTEMBER 2022
Key ratios, Vattenfall Group
Jan-Sep Jan-Sep Jul-Sep Jul-Sep Full year Last 12
In % unless otherwise stated. (x) means times1
2022 2021 2022 2021 2021 months
Operating margin 22.8 45.0 23.0 63.5 33.5 19.8
Operating margin2
14.8 18.9 11.7 13.2 17.3 14.7
Pre-tax profit margin 15.3 44.8 18.3 61.4 33.0 14.2
Pre-tax profit margin2
7.3 18.7 7.1 11.2 16.8 9.0
Return on equity3
14.8 40.2 14.8 40.2 36.9 14.8
Return on capital employed3
17.3 22.4 17.3 22.4 22.2 17.3
Return on capital employed2, 3
12.8 11.7 12.8 11.7 11.5 12.8
EBIT interest cover, (x)3
7.9 16.6 7.9 16.6 15.8 7.9
EBIT interest cover, (x)2, 3
5.9 8.7 5.9 8.7 8.3 5.9
FFO interest cover, (x)3
9.1 12.1 9.1 12.1 12.9 9.1
FFO interest cover, net, (x)3
10.2 14.5 10.2 14.5 15.9 10.2
Cash flow interest cover after maintenance investments, (x)3
20.8 33.94
20.8 33.94
27.4 20.8
FFO/gross debt3
30.0 46.0 30.0 46.0 36.5 30.0
FFO/net debt3
- 39.8 - 82.0 - 39.8 - 82.0 - 103.1 - 39.8
FFO/adjusted net debt3
n/a5
182.7 n/a5
182.7 171.2 n/a 5
EBITDA/net financial items, (x) 12.2 31.1 12.6 34.0 24.5 11.8
EBITDA/net financial items, (x)2
9.3 16.7 8.3 11.4 15.7 10.1
Equity/Total assets 18.5 27.8 18.5 27.8 25.2 18.5
Gross debt/equity 75.3 44.2 75.3 44.2 64.1 75.3
Net debt/equity - 56.8 - 24.8 - 56.8 - 24.8 - 22.7 - 56.8
Gross debt/gross debt plus equity 43.0 30.6 43.0 30.6 39.1 43.0
Net debt/net debt plus equity - 131.4 - 32.9 - 131.4 - 32.9 - 29.3 - 131.4
Net debt/EBITDA, (x)3
- 2.0 - 0.6 - 2.0 - 0.6 - 0.6 - 2.0
Adjusted net debt/EBITDA, (x)3
- 0.7 0.3 - 0.7 0.3 0.4 - 0.7
1) See Definitions and calculations of key ratios for definitions of Alternative Performance Measures.
2) Based on Underlying operating profit.
3) Last 12-month values.
4) The value has been adjusted compared with information previously published in Vattenfall’s financial reports.
5) The adjusted net debt decreased to a net asset mainly due to increased margin calls received. Excluding effects from received and paid margin calls FFO/adjusted net
debt was at 41.4%.
26
VATTENFALL INTERIM REPORT JANUARY–SEPTEMBER 2022
Quarterly information, Vattenfall Group
Q3 Q2 Q1 Q4 Q3 Q2 Q1
Amounts in SEK million 2022 2022 2022 2021 2021 2021 2021
Income statement
Net sales 53 076 48 170 59 579 63 529 36 125 34 554 45 911
Operating profit before depreciation, amortisation and
impairment losses (EBITDA) 16 386 15 386 17 249 10 226 27 293 20 531 17 740
Underlying EBITDA 10 820 12 660 13 970 13 452 9 149 9 577 16 408
Operating profit (EBIT) 12 192 11 730 12 783 7 750 22 926 16 210 13 385
Underlying EBIT 6 232 8 107 9 504 9 092 4 782 5 256 12 053
Profit before income taxes 9 728 6 469 8 433 7 156 22 182 16 778 13 257
Profit for the period 6 684 4 231 6 064 6 101 18 277 13 212 10 423
- of which, attributable to owner of the Parent Company 6 242 4 478 5 782 5 774 18 178 13 002 9 875
- of which, attributable to non-controlling interests 442 - 247 282 327 99 210 548
Balance sheet
Capital employed 258 447 289 959 276 749 280 881 255 184 280 855 271 110
Net debt 116 008 29 321 37 611 44 703 47 348 - 32 328 - 43 865
Cash flow
Funds from operations (FFO) 7 305 11 911 8 382 18 616 6 054 7 439 13 987
Cash flow from operating activities 90 385 9 776 - 3 058 4 312 1
61 223 1
23 965 1
12 331 1
Cash flow from investing activities - 37 201 12 523 18 676 - 45 872 1
- 15 238 1
- 12 782 1
- 5 128 1
Cash flow from financing activities 29 229 - 43 145 13 768 41 855 - 1 252 - 6 446 - 15 164
Cash flow for the period 82 413 - 8 935 29 386 295 44 733 4 737 - 7 961
Free cash flow 87 786 20 026 - 5 514 516 1
57 696 1
22 553 1
10 054 1
1) The value has been adjusted compared with information previously published in Vattenfall’s financial reports.
Q3 Q2 Q1 Q4 Q3 Q2 Q1
In % unless otherwise stated. (x) means times1
2022 2022 2022 2021 2021 2021 2021
Key ratios
Return on equity 14.8 23.5 31.0 36.9 40.2 30.3 10.0
Return on capital employed2
17.3 19.3 21.8 22.2 22.4 14.5 5.9
Return on capital employed2, 3
12.8 11.0 10.5 11.5 11.7 11.0 9.9
EBIT interest cover, (x)2
7.9 10.3 14.9 15.8 16.6 12.1 5.1
EBIT interest cover, (x)2, 3
5.9 6.0 7.3 8.3 8.7 9.3 8.6
FFO/gross debt2
30.0 36.3 28.8 36.5 46.0 44.3 40.0
FFO/net debt2
- 39.8 - 153.4 - 107.7 - 103.1 - 82.0 123.1 83.8
FFO/adjusted net debt n/a 4
103.0 120.5 171.2 182.7 38.1 32.8
Equity/Total assets 18.5 20.6 24.4 25.2 27.8 25.8 26.8
Gross debt/equity 75.3 65.6 66.7 64.1 44.2 64.2 72.0
Net debt/equity - 56.8 - 15.5 - 17.9 - 22.7 - 24.8 23.1 34.4
Net debt/net debt plus equity - 131.4 - 18.4 - 21.8 - 29.3 - 32.9 18.8 25.6
Net debt/EBITDA, (x)2
- 2.0 - 0.4 - 0.5 - 0.6 - 0.6 0.5 0.9
Adjusted net debt/EBITDA, (x)2
- 0.7 0.6 0.4 0.4 0.3 1.8 2.4
1) See Definitions and calculations of key ratios for definitions of Alternative Performance Measures.
2) Last 12-month values.
3) Based on Underlying operating profit.
4) The adjusted net debt decreased to a net asset mainly due to increased margin calls received. Excluding effects from received and paid margin calls FFO/adjusted net
debt was at 41.4%.
27
VATTENFALL INTERIM REPORT JANUARY–SEPTEMBER 2022
NOTE 1 | Accounting policies, risks and uncertainties
Accounting policies
This interim report for the Group has been prepared in accordance with
IAS 34 – “Interim Financial Reporting”, and the Swedish Annual
Accounts Act. The accounting policies and calculation methods applied
in this interim report are the same as those described in Vattenfall’s 2021
Annual and Sustainability Report in Note 3 to the consolidated accounts,
Accounting policies. Amended IFRSs endorsed by the EU for application
in the 2022 financial year have no significant effect on Vattenfall’s
financial statements.
Risks and uncertainties
For a description of risks, uncertainties and risk management, please
refer to Vattenfall’s 2021 Annual and Sustainability Report, pages 62-71.
The developments in the energy markets effects Vattenfalls entire
operation. The past nine months have seen a continuation of the high
volatility and price levels observed last year in the European energy
commodity markets. The situation is amplified by the Ukraine war
exacerbating Europe's security of supply for natural gas. On top, current
dry weather conditions and lower power plant availability are straining
electricity supply in most of Europe. As a result of the high energy prices
the risk of a wider economic recession increases.
The sharply rising commodity prices has also caused a significant
increase in the cash liquidity risk across the industry. Margining
arrangements like Credit Support Annex continue to be challenging for
the liquidity position of many companies. Due to the strong increase in
electricity prices, counterparties have provided margin securities to
Vattenfall. Conversely, if electricity prices were to fall significantly,
Vattenfall would have to fund a large outflow of cash for margin
securities.
One of the main risks for Vattenfall are defaults by customers and
counterparties caused by the continued high electricity and commodity
prices. To reflect the increased risk of customer defaults due to high
electricity prices, general high inflation and the expected decline in the
economy the Expected Credit Losses accounted for in Vattenfall were
increased.
The rise in inflation also leads to increased costs, e.g. for raw materials
and services which affects Vattenfall’s operating activities and
investments.
EU Energy Ministers met for an extraordinary Energy Council in
September and discussed short- and long-term interventions to cushion
the effects of the high electricity prices. Interventions that target short-
term profits of electricity generation, e.g. capping revenues from
electricity generation with lower marginal costs, for example from Wind,
Solar, Nuclear and Hydro, or gas price caps may pose a new financial
and strategic risk to Vattenfall’s portfolio. Without accompanying
regulatory measures that will safeguard hedged volumes, interventions
will skew the existing and expected future revenue expectation.
Presentation of financial statements
In the interim reports for 2022 the following amendments in the
presentations were made compared to Vattenfall’s 2021 Annual and
Sustainability Report:
• In the balance sheet contractual assets and liabilities are divided
into short- and long-term contractual assets and liabilities
respectively.
• In the cash flow statement acquisitions in group companies as well
as divestments are shown as the net of acquisition price and cash
in acquired companies and the net of sales price and cash in
divested companies respectively. In addition, changes in margin
calls from the treasury operations, which were previously included
in short term investments in cash flow from investments as well as
changes in operating liabilities, are included in Margin calls related
to derivatives.
Other
Significant related-party transactions are described in Note 44 to the
consolidated accounts in Vattenfall’s 2021 Annual and Sustainability
Report. No material changes have taken place in relations or
transactions with related parties since the publication.
NOTE 2 | Exchange rates
KEY EXCHANGE RATES APPLIED IN THE ACCOUNTS OF THE VATTENFALL GROUP
Jan-Sep Jan-Sep Jul-Sep Jul-Sep Full year
2022 2021 2022 2021 2021
Average rate
EUR 10.5179 10.1436 10.4670 10.1572 10.1469
DKK 1.4138 1.3639 1.4070 1.3658 1.3644
GBP 12.3961 11.7130 12.3329 11.8497 11.7820
USD 9.9185 8.4757 9.8041 8.6110 8.5687
30 Sep 30 Sep 31 Dec
2022 2021 2021
Balance sheet date rate
EUR 10.8993 10.1683 10.2503
DKK 1.4657 1.3674 1.3784
GBP 12.3435 11.8163 12.1987
USD 11.1811 8.7817 9.0502
28
VATTENFALL INTERIM REPORT JANUARY–SEPTEMBER 2022
NOTE 3 | Financial instruments by measurement category and related effects on income
For assets and liabilities with a remaining maturity less than three
months (e.g., cash and bank balances, trade receivables and other
receivables and trade payables and other payables), fair value is
considered to be equal to the carrying amount. For other shares and
participations the fair value is approximated by using cost.
The carrying amounts of financial assets measured at amortised cost do
not differ significantly from their fair values. The difference between
carrying amounts and fair values for financial liabilities measured at
amortised cost amounts to SEK -3,110 million (31 December 2021:
8,509).
Financial instruments that are measured at fair value on the balance
sheet are described below according to the fair value hierarchy (levels),
which in IFRS 13 is defined as:
Level 1: Quoted prices (unadjusted) in active markets for identical assets
or liabilities.
Level 2: Inputs other than quoted prices included in Level 1 that are
observable for the asset or liability, either directly (that is, as prices) or
indirectly (that is, derived from prices). In Level 2 Vattenfall reports
mainly commodity derivatives, currency-forward contracts and interest
rate swaps.
Level 3: Inputs for the asset or liability that are not based on observable
market data.
FINANCIAL ASSETS AND LIABILITIES THAT ARE MEASURED AT FAIR VALUE ON THE BALANCE SHEET AT 30 SEPTEMBER
2022
Amounts in SEK million Level 1 Level 2 Level 3 Total
Assets
Share in the Swedish Nuclear Waste Fund 46 339 — — 46 339
Derivative assets — 372 284 4 003 376 287
Short-term investments, cash equivalents and other shares and participations 145 164 18 483 — 163 647
Total assets 191 503 390 767 4 003 586 273
Liabilities
Derivative liabilities — 342 498 — 342 498
Total liabilities — 342 498 — 342 498
FINANCIAL ASSETS AND LIABILITIES THAT ARE MEASURED AT FAIR VALUE ON THE BALANCE SHEET AT 31 DECEMBER
2021
Amounts in SEK million Level 1 Level 2 Level 3 Total
Assets
Share in the Swedish Nuclear Waste Fund 52 772 — — 52 772
Derivative assets — 154 744 1 141 155 885
Short-term investments, cash equivalents and other shares and participations 116 013 11 404 — 127 417
Total assets 168 785 166 148 1 141 336 074
Liabilities
Derivative liabilities — 129 818 — 129 818
Total liabilities — 129 818 — 129 818
29
VATTENFALL INTERIM REPORT JANUARY–SEPTEMBER 2022
NOTE 4 | Items affecting comparability
Items affecting comparability include capital gains and capital losses from sale of shares and other non-current assets, impairment losses and reversed
impairment losses and other material items that are of an infrequent nature. Also included here are, for trading activities, changes in the fair value of
energy derivatives, which according to IFRS 9 cannot be recognised using hedge accounting and changes in the fair value of inventories.
Jan-Sep Jan-Sep Jul-Sep Jul-Sep Full year Last 12
Amounts in SEK million 2022 2021 2022 2021 2021 months
Items affecting comparability 12 863 30 431 5 960 18 144 29 090 11 522
- of which, capital gains 204 8 803 — 8 762 8 960 361
- of which, capital losses - 94 - 167 - 28 - 25 - 199 - 126
- of which, impairment losses - 1 — — — - 38 - 39
- of which, reversed impairment losses 1 292 — 394 — 1 922 3 214
- of which, provisions - 3 325 - 2 453 - 774 - 1 - 3 785 - 4 657
- of which, changes in the fair value of energy derivatives 13 204 10 537 7 994 7 792 8 715 11 382
- of which, changes in the fair value of inventories 1 582 1 801 - 1 627 1 645 1 313 1 094
- of which, other non-recurring items affecting comparability 1 11 910 1 - 29 12 202 293
Items affecting comparability during January-September 2022 amounted
to SEK 12.9 billion, most of which pertains to changes in market value for
energy derivatives and inventories (SEK 14.8 billion) and provisions in
nuclear operations and Business Area Heat (SEK -3.3 billion). The
reversed impairment losses relates to assets in Business Area Heat.
Items affecting comparability during January-September 2021 amounted
to SEK 30.4 billion, most of which pertains to compensation for closure of
nuclear power in Germany and sales of related production rights (SEK
12.5 billion, reported in other non-recurring items affecting comparability),
and changes in market value for energy derivatives and inventories (SEK
12.3 billion). The increase in provisions pertains to the nuclear operations
(SEK -2.5 billion). Capital gains pertains mainly to the sale of Stromnetz
Berlin (SEK 8.4 billion).
30
VATTENFALL INTERIM REPORT JANUARY–SEPTEMBER 2022
The Parent Company Vattenfall AB
Accounting policies
The Parent Company Vattenfall AB’s accounts are prepared in
accordance with the Swedish Annual Accounts Act and recommendation
RFR 2 – Accounting for Legal Entities, issued by the Swedish Financial
Reporting Board. The accounting policies used in this interim report are
the same as those described in Vattenfall’s 2021 Annual and
Sustainability Report, Note 3 to the Parent Company accounts,
Accounting policies. New accounting policies applicable from 1 January
2021 has had no significant effect on the Parent Company’s financial
statements.
January – September 2022
A condensed income statement and balance sheet for the Parent
Company are presented below.
• Net sales amounted to SEK 24,046 million (28,315).
• Profit before appropriations and income taxes was SEK -54,081
million (-1,332).
• The lower operating profit are mainly attributable to changes in
market value for energy derivatives, for all future years’ hedges
amounting to SEK -51,006 million. In addition, the Parent Company
is charged with SEK -9,185 million for increased commitments for
future decommissioning of Ringhals and Forsmark resulting from
increased provisions for those group companies and the negative
development of the share in the Swedish Nuclear Waste Fund.
• The improved net financial items refers to dividends from group
companies, mainly from Vattenfall GmbH.
• The balance sheet total was SEK 539,464 million (31 December
2021:468,482).
• Investments during the period amounted to SEK 697 million (5,443),
whereof last year’s investment pertained mainly to group internal
asset transactions.
• Cash and cash equivalents, and short-term investments amounted
to SEK 219,788 million (31 December 2021: 145,743).
• Dividend paid to the owner of SEK 23,414 million (4,000).
Risks and uncertainties
See Note 1 to the consolidated accounts, Accounting policies, risks and
uncertainties.
Other
The owners to the Swedish nuclear companies are required to provide
security to the Swedish state as a guarantee that sufficient funds exist to
cover the future costs of nuclear waste management. The security is
provided in the form of guarantee commitments from the owners of the
nuclear power companies and includes both financial and supplementary
security. The state has during the first six month during 2022 decided to
increase the levels of the security. The effect for Vattenfall AB will be an
increase of 14,7 billion SEK.
Significant related-party transactions are described in Note 44 to the
consolidated accounts, Related party disclosures, in Vattenfall’s 2021
Annual and Sustainability Report. No material changes have taken place
in relations or transactions with related parties compared with the
description in Vattenfall’s 2021 Annual and Sustainability Report.
31
VATTENFALL INTERIM REPORT JANUARY–SEPTEMBER 2022
Parent Company income statement
Jan-Sep Jan-Sep Full year Last 12
Amounts in SEK million 2022 2021 2021 months
Net sales 24 046 28 315 40 045 35 776
Cost of purchases related to production - 83 984 - 26 240 - 37 035 - 94 779
Other external expenses - 3 792 - 3 317 - 5 250 - 5 725
Personnel expenses - 2 368 - 1 644 - 2 247 - 2 971
Other operating incomes and expenses, net 17 339 - 52 - 374
Operating profit before depreciation, amortisation and impairment losses (EBITDA) - 66 081 - 2 547 - 4 539 - 68 073
Depreciation, amortisation and impairments - 504 - 473 - 629 - 660
Operating profit (EBIT) - 66 585 - 3 020 - 5 168 - 68 733
Result from participations in subsidiaries 15 772 2 232 2 231 15 771
Result from participations in associated companies - 61 1 1 - 61
Other financial income 1 201 1 237 1 537 1 501
Other financial expenses - 4 408 - 1 782 - 2 820 - 5 446
Profit before appropriations and income taxes - 54 081 - 1 332 - 4 219 - 56 968
Appropriations 4 840 1 057 5 086 8 869
Profit before income taxes - 49 241 - 275 867 - 48 099
Income taxes 12 820 489 445 12 776
Profit for the period - 36 421 214 1 312 - 35 323
32
VATTENFALL INTERIM REPORT JANUARY–SEPTEMBER 2022
Parent Company balance sheet
30 Sep 30 Sep 31 Dec
Amounts in SEK million 2022 2021 2021
Assets
Non-current assets
Intangible assets: non-current 323 333 330
Property, plant and equipment 6 937 6 647 7 003
Shares and participations 166 993 166 449 166 802
Deferred tax assets 15 116 1 948 2 272
Other non-current receivables group 66 537 64 030 65 553
Other non-current receivables 4 277 4 681 5 570
Total non-current assets 260 183 244 088 247 530
Current assets
Inventories 371 386 342
Intangible assets: current 18 7 9
Current receivables group 10 223 10 925 59 366
Current receivables 48 203 10 953 13 791
Current tax assets 678 168 1 701
Short-term investments 95 140 62 975 101 877
Cash and cash equivalents 124 648 56 046 43 866
Total current assets 279 281 141 460 220 952
Total assets 539 464 385 548 468 482
Equity, provisions and liabilities
Equity
Restricted equity
Share capital (131,700,000 shares with a share quota value of SEK 50) 6 585 6 585 6 585
Revaluation reserve 37 989 37 989 37 989
Other reserves 1 365 1 357 1 370
Non-restricted equity
Retained earnings 42 814 66 200 64 911
Profit for the period - 36 421 214 1 312
Total equity 52 332 112 345 112 167
Untaxed reserves 2 328 12 285 7 168
Provisions 6 042 5 072 5 621
Non-current liabilities
Hybrid capital 21 960 20 135 20 421
Other interest-bearing liabilities group 222 8 1 573
Other interest-bearing liabilities 50 364 37 505 37 902
Other noninterest-bearing liabilities group 12 590 12 488 12 590
Other noninterest-bearing liabilities 9 456 273 279
Total non-current liabilities 94 592 70 409 72 765
Current liabilities
Other interest-bearing liabilities group 243 134 160 187 197 355
Other interest-bearing liabilities 77 013 13 768 54 960
Current tax liabilities — 2 —
Other noninterest-bearing liabilities group 2 123 1 298 4 521
Other noninterest-bearing liabilities 61 900 10 182 13 925
Total current liabilities 384 170 185 437 270 761
Total equity, provisions and liabilities 539 464 385 548 468 482
33
VATTENFALL INTERIM REPORT JANUARY–SEPTEMBER 2022
Definitions and calculations of key ratios
Alternative Performance Measures
In order to ensure a fair presentation of the Group’s operations, the
Vattenfall Group uses a number of Alternative Performance Measures
that are not defined in IFRS or in the Swedish Annual Accounts Act. The
Alternative Performance Measures that Vattenfall uses are described
below, including their definitions and how they are calculated. The
Alternative Performance Measures used are unchanged compared with
earlier periods.
Definition
EBIT: Operating profit (Earnings Before Interest and Tax)
EBITDA: Operating profit before depreciation, amortisation and impairment losses (Earnings Before Interest, Tax,
Depreciation and Amortisation)
Items affecting comparability: Capital gains and capital losses from shares and other non-current assets, impairment losses and reversed
impairment losses and other material items that are of an infrequent nature. Also included here are, for trading
activities, changes in the fair value of energy derivatives, which according to IFRS 9 cannot be recognised using
hedge accounting and changes in the fair value of inventories. See Consolidated income statement for a
specification of items affecting comparability.
Underlying EBITDA: Underlying operating profit before depreciation, amortisation and impairment losses. This measure is intended to
provide a better view on the operating result by excluding items affecting comparability that are of an infrequent
nature, while also excluding non-cash depreciation and amortisation.
Underlying operating profit: Operating profit (EBIT) excluding items affecting comparability. This measure is intended to provide a better view
on the operating result by excluding items affecting comparability that are of an infrequent nature.
FFO: Funds From Operations, see Consolidated statement of cash flow
Free cash flow: Cash flow from operating activities less maintenance investments
Interest-bearing liabilities See Consolidated balance sheet - Supplementary Information
Net debt: See Consolidated balance sheet - Supplementary Information
Adjusted net debt: See Consolidated balance sheet - Supplementary Information
Capital employed: Total assets less financial assets, noninterest-bearing liabilities and certain other interest-bearing provisions not
included in adjusted net debt. see Consolidated balance sheet - Supplementary Information
Other definitions Definition
Hybrid Capital: Perpetual subordinated securities, junior to all Vattenfall’s unsubordinated debt instruments.
LTIF: Lost Time Injury Frequency (LTIF) is expressed in terms of the number of lost time work injuries (per 1 million
hours worked), i.e., work-related accidents resulting in absence longer than one day, and accidents resulting in
fatality.
CALCULATION OF EBITDA, UNDERLYING EBITDA AND UNDERLYING EBIT
Jan-Sep Jan-Sep Jul-Sep Jul-Sep Full year Last 12
Amounts in SEK million 2022 2021 2022 2021 2021 months
Operating profit (EBIT) 36 707 52 521 12 192 22 926 60 271 44 457
Depreciation, amortisation and impairment losses - 12 316 - 13 044 - 4 194 - 4 367 - 15 519 - 14 791
Operating profit before depreciation, amortisation and impairment
losses (EBITDA) 49 023 65 565 16 386 27 293 75 790 59 248
Items affecting comparability excl. impairment losses and reversed
impairment losses - 11 572 - 30 431 - 5 566 - 18 144 - 27 206 - 8 347
Underlying operating profit before depreciation, amortisation and
impairment losses 37 451 35 134 10 820 9 149 48 584 50 901
Operating profit (EBIT) 36 707 52 521 12 192 22 926 60 271 44 457
Items affecting comparability - 12 863 - 30 431 - 5 960 - 18 144 - 29 090 - 11 522
Underlying operating profit 23 844 22 090 6 232 4 782 31 181 32 935
34
VATTENFALL INTERIM REPORT JANUARY–SEPTEMBER 2022
The key ratios are presented as percentages (%) or times (x).
KEY RATIOS BASED ON LAST 12-MONTH VALUES OCTOBER 2021 – SEPTEMBER 2022:
Operating margin, % = 100 x
EBIT 44 457
= 19.8
Net sales 224 354
Operating margin excl. items
= 100 x
Underlying EBIT 32 935
= 14.7
affecting comparability, % Net sales 224 354
Pre-tax profit margin, % = 100 x
Profit before income taxes 31 789
= 14.2
Net sales 224 354
Pre-tax profit margin excl. items
= 100 x
Profit before income taxes excl. items affecting comparability 20 267
= 9.0
affecting comparability, % Net sales 224 354
Return on equity, % = 100 x
Profit for the period attributable to owner of the Parent Company 22 276
= 14.8
Average equity for the period attributable to owner of the 150 124
Parent Company excl. the Reserve for cash flow hedges
Return on capital employed, % = 100 x
EBIT 44 457
= 17.3
Capital employed, average 256 816
Return on capital employed excl.
= 100 x
Underlying EBIT 32 935
= 12.8
items affecting comparability, % Capital employed, average 256 816
EBIT interest cover, (x) =
EBIT + financial income 45 176
= 7.9
Financial expenses excl. discounting effects attributable to 5 735
provisions
EBIT interest cover excl. Items = Underlying EBIT + financial income 33 654 = 5.9
affecting comparability, (x) Financial expenses excl. discounting effects attributable to 5 735
provisions
FFO + financial expenses excl.
FFO interest cover, (x) =
discounting effects attributable to provisions 51 949
= 9.1
Financial expenses excl. discounting effects attributable to 5 735
provisions
FFO + financial items net excl. discounting effects attributable
FFO interest cover, net, (x) =
to provisions and return from the Swedish Nuclear Waste Fund 51 230
= 10.2
Financial items net excl. discounting effects attributable to 5 016
provisions and return from the Swedish Nuclear Waste Fund
35
VATTENFALL INTERIM REPORT JANUARY–SEPTEMBER 2022
Cash flow from operating activities less maintenance
investments + financial expenses excl. Discounting
Cash flow interest cover after
=
effects attributable to provisions and interest components
related to pension costs 108 006
= 20.8
maintenance investments, (x) Financial expenses excl. discounting effects attributable to 5 193
provisions and interest components related to pension costs
FFO/gross debt, % = 100 x
FFO 46 214
= 30.0
Interest-bearing liabilities 153 931
FFO/net debt, % = 100 x
FFO 46 214
= -39.8
Net debt -116 008
FFO/adjusted net debt, % 1
= 100 x
FFO 46 214
= -104.7
Adjusted net debt -44 123
FFO/adjusted net debt excl. margin
calls, %
= 100 x
FFO 46 214
= 41.4
Adjusted net debt excl. margin calls 111 525
EBITDA/net financial
=
EBITDA 59 248
= 11.8
items, (x) Financial items net excl. discounting effects attributable to 5 016
provisions and return from the Swedish Nuclear Waste Fund
EBITDA excl. items affecting
=
EBITDA excl. items affecting comparability 50 901
= 10.1
comparability/net financial Financial items net excl. discounting effects attributable to 5 016
items, (x) provisions and return from the Swedish Nuclear Waste Fund
KEY RATIOS BASED ON THE BALANCE SHEET PER 30 SEPTEMBER 2022:
Equity/total assets, % = 100 x
Equity 204 324
= 18.5
Balance sheet total 1102 489
Gross debt/equity, % = 100 x
Interest-bearing liabilities 153 931
= 75.3
Equity 204 324
Net debt/equity, % = 100 x
Net debt -116 008
= -56.8
Equity 204 324
Gross debt/gross debt
= 100 x
Interest-bearing liabilities 153 931
= 43.0
equity, % Interest-bearing liabilities + equity 358 255
Net debt/net debt plus
= 100 x
Net debt -116 008
= -131.4
equity, % Net debt + equity 88 316
Net debt/EBITDA, (x) =
Net debt -116 008
= -2.0
EBITDA 59 248
Adjusted net debt/
=
Adjusted net debt -44 123
= -0.7
EBITDA, (x) EBITDA 59 248
1) The adjusted net debt decreased to a net asset mainly due to increased margin calls received. Excluding effects from received and paid margin calls FFO/adjusted net
debt was at 41.4%.
36
VATTENFALL INTERIM REPORT JANUARY–SEPTEMBER 2022
The information was submitted for publication, through the agency of the contact persons set out above, at 08.00 CEST on 27
October 2022. This report has been prepared in both Swedish and English versions. In the event of discrepancies between the two
versions, the Swedish version shall govern.
Interim report signature
Solna, 27 October 2022
Anna Borg
President and CEO
This interim report has not been reviewed by the company’s
auditor.
Financial calendar
Year-end report 2022, 8 February 2023
Annual General Meeting, 26 April 2023
Interim report January-March, 27 April 2023
Interim report January-June, 20 July 2023
Interim report January-September, 26 October 2023
Contact information
Vattenfall AB (publ)
SE-169 92 Stockholm
Corporate identity number 556036-2138
T +46-8-739 50 00
www.vattenfall.com
www.vattenfall.se
Anna Borg
President and CEO
T +46-8-739 50 09
Kerstin Ahlfont
CFO
T +46-8-739 64 28
Ruben van Bavel
Acting Head of Group Control &
Investor Relations
T +31 650 126 296
Vattenfall’s press office
T +46-8-739 50 10
press@vattenfall.com

Weitere ähnliche Inhalte

Ähnlich wie Q3: Interim report January-September 2022

Q1 2018: Interim report January-March
Q1 2018: Interim report January-MarchQ1 2018: Interim report January-March
Q1 2018: Interim report January-MarchVattenfall
 
Q1 2023: Interim Report January-March
Q1 2023: Interim Report January-MarchQ1 2023: Interim Report January-March
Q1 2023: Interim Report January-MarchVattenfall
 
Vattenfall’s Q2 and half-year results 2018
Vattenfall’s Q2 and half-year results 2018Vattenfall’s Q2 and half-year results 2018
Vattenfall’s Q2 and half-year results 2018Vattenfall
 
Vattenfall's Q3 report 2018
Vattenfall's Q3 report 2018Vattenfall's Q3 report 2018
Vattenfall's Q3 report 2018Vattenfall
 
Q1 2022: Interim Report January-March
Q1 2022: Interim Report January-MarchQ1 2022: Interim Report January-March
Q1 2022: Interim Report January-MarchVattenfall
 
Vattenfall Q1 report 2017
Vattenfall Q1 report 2017Vattenfall Q1 report 2017
Vattenfall Q1 report 2017Vattenfall
 
Q1 2019: Interim report January-March
Q1 2019: Interim report January-MarchQ1 2019: Interim report January-March
Q1 2019: Interim report January-MarchVattenfall
 
Year-End report 2019 - Vattenfall
Year-End report 2019 - VattenfallYear-End report 2019 - Vattenfall
Year-End report 2019 - VattenfallVattenfall
 
Year-End report 2020 – Vattenfall
Year-End report 2020 – VattenfallYear-End report 2020 – Vattenfall
Year-End report 2020 – VattenfallVattenfall
 
Q1 2020: Interim report January-March
Q1 2020: Interim report January-MarchQ1 2020: Interim report January-March
Q1 2020: Interim report January-MarchVattenfall
 
Q2 2020: Interim report January-June
Q2 2020: Interim report January-JuneQ2 2020: Interim report January-June
Q2 2020: Interim report January-JuneVattenfall
 
Vattenfall Q2 report 2019
Vattenfall Q2 report 2019Vattenfall Q2 report 2019
Vattenfall Q2 report 2019Vattenfall
 
Year end report 2018 - Vattenfall
Year end report 2018 - VattenfallYear end report 2018 - Vattenfall
Year end report 2018 - VattenfallVattenfall
 
Third quarter 2020: Interim report January-September
Third quarter 2020: Interim report January-SeptemberThird quarter 2020: Interim report January-September
Third quarter 2020: Interim report January-SeptemberVattenfall
 
Vattenfall's year-end report 2017
Vattenfall's year-end report 2017Vattenfall's year-end report 2017
Vattenfall's year-end report 2017Vattenfall
 
Presentation of Vattenfall's full year 2015 results
Presentation of Vattenfall's full year 2015 resultsPresentation of Vattenfall's full year 2015 results
Presentation of Vattenfall's full year 2015 resultsVattenfall
 
Q3 2019: Interim report January-September
Q3 2019: Interim report January-SeptemberQ3 2019: Interim report January-September
Q3 2019: Interim report January-SeptemberVattenfall
 
Vattenfall’s Q2 and half-year results 2017
Vattenfall’s Q2 and half-year results 2017Vattenfall’s Q2 and half-year results 2017
Vattenfall’s Q2 and half-year results 2017Vattenfall
 
Vattenfall’s Q3 report 2017
Vattenfall’s Q3 report 2017Vattenfall’s Q3 report 2017
Vattenfall’s Q3 report 2017Vattenfall
 
Vattenfall's quarterly report January - March 2015
Vattenfall's quarterly report January - March 2015Vattenfall's quarterly report January - March 2015
Vattenfall's quarterly report January - March 2015Vattenfall
 

Ähnlich wie Q3: Interim report January-September 2022 (20)

Q1 2018: Interim report January-March
Q1 2018: Interim report January-MarchQ1 2018: Interim report January-March
Q1 2018: Interim report January-March
 
Q1 2023: Interim Report January-March
Q1 2023: Interim Report January-MarchQ1 2023: Interim Report January-March
Q1 2023: Interim Report January-March
 
Vattenfall’s Q2 and half-year results 2018
Vattenfall’s Q2 and half-year results 2018Vattenfall’s Q2 and half-year results 2018
Vattenfall’s Q2 and half-year results 2018
 
Vattenfall's Q3 report 2018
Vattenfall's Q3 report 2018Vattenfall's Q3 report 2018
Vattenfall's Q3 report 2018
 
Q1 2022: Interim Report January-March
Q1 2022: Interim Report January-MarchQ1 2022: Interim Report January-March
Q1 2022: Interim Report January-March
 
Vattenfall Q1 report 2017
Vattenfall Q1 report 2017Vattenfall Q1 report 2017
Vattenfall Q1 report 2017
 
Q1 2019: Interim report January-March
Q1 2019: Interim report January-MarchQ1 2019: Interim report January-March
Q1 2019: Interim report January-March
 
Year-End report 2019 - Vattenfall
Year-End report 2019 - VattenfallYear-End report 2019 - Vattenfall
Year-End report 2019 - Vattenfall
 
Year-End report 2020 – Vattenfall
Year-End report 2020 – VattenfallYear-End report 2020 – Vattenfall
Year-End report 2020 – Vattenfall
 
Q1 2020: Interim report January-March
Q1 2020: Interim report January-MarchQ1 2020: Interim report January-March
Q1 2020: Interim report January-March
 
Q2 2020: Interim report January-June
Q2 2020: Interim report January-JuneQ2 2020: Interim report January-June
Q2 2020: Interim report January-June
 
Vattenfall Q2 report 2019
Vattenfall Q2 report 2019Vattenfall Q2 report 2019
Vattenfall Q2 report 2019
 
Year end report 2018 - Vattenfall
Year end report 2018 - VattenfallYear end report 2018 - Vattenfall
Year end report 2018 - Vattenfall
 
Third quarter 2020: Interim report January-September
Third quarter 2020: Interim report January-SeptemberThird quarter 2020: Interim report January-September
Third quarter 2020: Interim report January-September
 
Vattenfall's year-end report 2017
Vattenfall's year-end report 2017Vattenfall's year-end report 2017
Vattenfall's year-end report 2017
 
Presentation of Vattenfall's full year 2015 results
Presentation of Vattenfall's full year 2015 resultsPresentation of Vattenfall's full year 2015 results
Presentation of Vattenfall's full year 2015 results
 
Q3 2019: Interim report January-September
Q3 2019: Interim report January-SeptemberQ3 2019: Interim report January-September
Q3 2019: Interim report January-September
 
Vattenfall’s Q2 and half-year results 2017
Vattenfall’s Q2 and half-year results 2017Vattenfall’s Q2 and half-year results 2017
Vattenfall’s Q2 and half-year results 2017
 
Vattenfall’s Q3 report 2017
Vattenfall’s Q3 report 2017Vattenfall’s Q3 report 2017
Vattenfall’s Q3 report 2017
 
Vattenfall's quarterly report January - March 2015
Vattenfall's quarterly report January - March 2015Vattenfall's quarterly report January - March 2015
Vattenfall's quarterly report January - March 2015
 

Mehr von Vattenfall

Kvartal 3 2023: Delårsrapport Januari-September
Kvartal 3 2023: Delårsrapport Januari-SeptemberKvartal 3 2023: Delårsrapport Januari-September
Kvartal 3 2023: Delårsrapport Januari-SeptemberVattenfall
 
Kvartal 2 2023: Delårsrapport Januari-Juni
Kvartal 2 2023: Delårsrapport Januari-JuniKvartal 2 2023: Delårsrapport Januari-Juni
Kvartal 2 2023: Delårsrapport Januari-JuniVattenfall
 
Kvartal 1 2023: Delårsrapport januari-mars
Kvartal 1 2023: Delårsrapport januari-marsKvartal 1 2023: Delårsrapport januari-mars
Kvartal 1 2023: Delårsrapport januari-marsVattenfall
 
Bokslutskommuniké 2022
Bokslutskommuniké 2022Bokslutskommuniké 2022
Bokslutskommuniké 2022Vattenfall
 
Kvartal 3 2022: Delårsrapport januari-september
Kvartal 3 2022: Delårsrapport januari-septemberKvartal 3 2022: Delårsrapport januari-september
Kvartal 3 2022: Delårsrapport januari-septemberVattenfall
 
Kvartal 2 2022: Delårsrapport januari-juni 2022
Kvartal 2 2022: Delårsrapport januari-juni 2022Kvartal 2 2022: Delårsrapport januari-juni 2022
Kvartal 2 2022: Delårsrapport januari-juni 2022Vattenfall
 
Kvartal 1 2022: Delårsrapport januari-mars
Kvartal 1 2022: Delårsrapport januari-marsKvartal 1 2022: Delårsrapport januari-mars
Kvartal 1 2022: Delårsrapport januari-marsVattenfall
 
Bokslutskommuniké 2021 - Vattenfall
Bokslutskommuniké 2021 - VattenfallBokslutskommuniké 2021 - Vattenfall
Bokslutskommuniké 2021 - VattenfallVattenfall
 
Kvartal 3 2021: Delårsrapport januari-september 2021
Kvartal 3 2021: Delårsrapport januari-september 2021Kvartal 3 2021: Delårsrapport januari-september 2021
Kvartal 3 2021: Delårsrapport januari-september 2021Vattenfall
 
Kvartal 2 2021: Delårsrapport januari-juni 2021
Kvartal 2 2021: Delårsrapport januari-juni 2021Kvartal 2 2021: Delårsrapport januari-juni 2021
Kvartal 2 2021: Delårsrapport januari-juni 2021Vattenfall
 
Kvartal 1 2021: Delårsrapport januari-mars 2021
Kvartal 1 2021: Delårsrapport januari-mars 2021Kvartal 1 2021: Delårsrapport januari-mars 2021
Kvartal 1 2021: Delårsrapport januari-mars 2021Vattenfall
 
Bokslutskommuniké 2020 – Vattenfall
Bokslutskommuniké 2020 – VattenfallBokslutskommuniké 2020 – Vattenfall
Bokslutskommuniké 2020 – VattenfallVattenfall
 
Kvartal 3 2020: Delårsrapport januari-september 2020
Kvartal 3 2020: Delårsrapport januari-september 2020Kvartal 3 2020: Delårsrapport januari-september 2020
Kvartal 3 2020: Delårsrapport januari-september 2020Vattenfall
 
Kvartal 2 2020: Delårsrapport januari-juni 2020
Kvartal 2 2020: Delårsrapport januari-juni 2020Kvartal 2 2020: Delårsrapport januari-juni 2020
Kvartal 2 2020: Delårsrapport januari-juni 2020Vattenfall
 
Kvartal 1 2020: Delårsrapport januari-mars 2020
Kvartal 1 2020: Delårsrapport januari-mars 2020Kvartal 1 2020: Delårsrapport januari-mars 2020
Kvartal 1 2020: Delårsrapport januari-mars 2020Vattenfall
 

Mehr von Vattenfall (15)

Kvartal 3 2023: Delårsrapport Januari-September
Kvartal 3 2023: Delårsrapport Januari-SeptemberKvartal 3 2023: Delårsrapport Januari-September
Kvartal 3 2023: Delårsrapport Januari-September
 
Kvartal 2 2023: Delårsrapport Januari-Juni
Kvartal 2 2023: Delårsrapport Januari-JuniKvartal 2 2023: Delårsrapport Januari-Juni
Kvartal 2 2023: Delårsrapport Januari-Juni
 
Kvartal 1 2023: Delårsrapport januari-mars
Kvartal 1 2023: Delårsrapport januari-marsKvartal 1 2023: Delårsrapport januari-mars
Kvartal 1 2023: Delårsrapport januari-mars
 
Bokslutskommuniké 2022
Bokslutskommuniké 2022Bokslutskommuniké 2022
Bokslutskommuniké 2022
 
Kvartal 3 2022: Delårsrapport januari-september
Kvartal 3 2022: Delårsrapport januari-septemberKvartal 3 2022: Delårsrapport januari-september
Kvartal 3 2022: Delårsrapport januari-september
 
Kvartal 2 2022: Delårsrapport januari-juni 2022
Kvartal 2 2022: Delårsrapport januari-juni 2022Kvartal 2 2022: Delårsrapport januari-juni 2022
Kvartal 2 2022: Delårsrapport januari-juni 2022
 
Kvartal 1 2022: Delårsrapport januari-mars
Kvartal 1 2022: Delårsrapport januari-marsKvartal 1 2022: Delårsrapport januari-mars
Kvartal 1 2022: Delårsrapport januari-mars
 
Bokslutskommuniké 2021 - Vattenfall
Bokslutskommuniké 2021 - VattenfallBokslutskommuniké 2021 - Vattenfall
Bokslutskommuniké 2021 - Vattenfall
 
Kvartal 3 2021: Delårsrapport januari-september 2021
Kvartal 3 2021: Delårsrapport januari-september 2021Kvartal 3 2021: Delårsrapport januari-september 2021
Kvartal 3 2021: Delårsrapport januari-september 2021
 
Kvartal 2 2021: Delårsrapport januari-juni 2021
Kvartal 2 2021: Delårsrapport januari-juni 2021Kvartal 2 2021: Delårsrapport januari-juni 2021
Kvartal 2 2021: Delårsrapport januari-juni 2021
 
Kvartal 1 2021: Delårsrapport januari-mars 2021
Kvartal 1 2021: Delårsrapport januari-mars 2021Kvartal 1 2021: Delårsrapport januari-mars 2021
Kvartal 1 2021: Delårsrapport januari-mars 2021
 
Bokslutskommuniké 2020 – Vattenfall
Bokslutskommuniké 2020 – VattenfallBokslutskommuniké 2020 – Vattenfall
Bokslutskommuniké 2020 – Vattenfall
 
Kvartal 3 2020: Delårsrapport januari-september 2020
Kvartal 3 2020: Delårsrapport januari-september 2020Kvartal 3 2020: Delårsrapport januari-september 2020
Kvartal 3 2020: Delårsrapport januari-september 2020
 
Kvartal 2 2020: Delårsrapport januari-juni 2020
Kvartal 2 2020: Delårsrapport januari-juni 2020Kvartal 2 2020: Delårsrapport januari-juni 2020
Kvartal 2 2020: Delårsrapport januari-juni 2020
 
Kvartal 1 2020: Delårsrapport januari-mars 2020
Kvartal 1 2020: Delårsrapport januari-mars 2020Kvartal 1 2020: Delårsrapport januari-mars 2020
Kvartal 1 2020: Delårsrapport januari-mars 2020
 

Kürzlich hochgeladen

Yaroslav Rozhankivskyy: Три складові і три передумови максимальної продуктивн...
Yaroslav Rozhankivskyy: Три складові і три передумови максимальної продуктивн...Yaroslav Rozhankivskyy: Три складові і три передумови максимальної продуктивн...
Yaroslav Rozhankivskyy: Три складові і три передумови максимальної продуктивн...Lviv Startup Club
 
Enhancing and Restoring Safety & Quality Cultures - Dave Litwiller - May 2024...
Enhancing and Restoring Safety & Quality Cultures - Dave Litwiller - May 2024...Enhancing and Restoring Safety & Quality Cultures - Dave Litwiller - May 2024...
Enhancing and Restoring Safety & Quality Cultures - Dave Litwiller - May 2024...Dave Litwiller
 
Call Girls Pune Just Call 9907093804 Top Class Call Girl Service Available
Call Girls Pune Just Call 9907093804 Top Class Call Girl Service AvailableCall Girls Pune Just Call 9907093804 Top Class Call Girl Service Available
Call Girls Pune Just Call 9907093804 Top Class Call Girl Service AvailableDipal Arora
 
Understanding the Pakistan Budgeting Process: Basics and Key Insights
Understanding the Pakistan Budgeting Process: Basics and Key InsightsUnderstanding the Pakistan Budgeting Process: Basics and Key Insights
Understanding the Pakistan Budgeting Process: Basics and Key Insightsseribangash
 
Insurers' journeys to build a mastery in the IoT usage
Insurers' journeys to build a mastery in the IoT usageInsurers' journeys to build a mastery in the IoT usage
Insurers' journeys to build a mastery in the IoT usageMatteo Carbone
 
GD Birla and his contribution in management
GD Birla and his contribution in managementGD Birla and his contribution in management
GD Birla and his contribution in managementchhavia330
 
VIP Call Girls In Saharaganj ( Lucknow ) 🔝 8923113531 🔝 Cash Payment (COD) 👒
VIP Call Girls In Saharaganj ( Lucknow  ) 🔝 8923113531 🔝  Cash Payment (COD) 👒VIP Call Girls In Saharaganj ( Lucknow  ) 🔝 8923113531 🔝  Cash Payment (COD) 👒
VIP Call Girls In Saharaganj ( Lucknow ) 🔝 8923113531 🔝 Cash Payment (COD) 👒anilsa9823
 
Call Girls in Gomti Nagar - 7388211116 - With room Service
Call Girls in Gomti Nagar - 7388211116  - With room ServiceCall Girls in Gomti Nagar - 7388211116  - With room Service
Call Girls in Gomti Nagar - 7388211116 - With room Servicediscovermytutordmt
 
7.pdf This presentation captures many uses and the significance of the number...
7.pdf This presentation captures many uses and the significance of the number...7.pdf This presentation captures many uses and the significance of the number...
7.pdf This presentation captures many uses and the significance of the number...Paul Menig
 
It will be International Nurses' Day on 12 May
It will be International Nurses' Day on 12 MayIt will be International Nurses' Day on 12 May
It will be International Nurses' Day on 12 MayNZSG
 
Pharma Works Profile of Karan Communications
Pharma Works Profile of Karan CommunicationsPharma Works Profile of Karan Communications
Pharma Works Profile of Karan Communicationskarancommunications
 
Monte Carlo simulation : Simulation using MCSM
Monte Carlo simulation : Simulation using MCSMMonte Carlo simulation : Simulation using MCSM
Monte Carlo simulation : Simulation using MCSMRavindra Nath Shukla
 
Event mailer assignment progress report .pdf
Event mailer assignment progress report .pdfEvent mailer assignment progress report .pdf
Event mailer assignment progress report .pdftbatkhuu1
 
VIP Call Girl Jamshedpur Aashi 8250192130 Independent Escort Service Jamshedpur
VIP Call Girl Jamshedpur Aashi 8250192130 Independent Escort Service JamshedpurVIP Call Girl Jamshedpur Aashi 8250192130 Independent Escort Service Jamshedpur
VIP Call Girl Jamshedpur Aashi 8250192130 Independent Escort Service JamshedpurSuhani Kapoor
 
Progress Report - Oracle Database Analyst Summit
Progress  Report - Oracle Database Analyst SummitProgress  Report - Oracle Database Analyst Summit
Progress Report - Oracle Database Analyst SummitHolger Mueller
 
Monthly Social Media Update April 2024 pptx.pptx
Monthly Social Media Update April 2024 pptx.pptxMonthly Social Media Update April 2024 pptx.pptx
Monthly Social Media Update April 2024 pptx.pptxAndy Lambert
 
Russian Faridabad Call Girls(Badarpur) : ☎ 8168257667, @4999
Russian Faridabad Call Girls(Badarpur) : ☎ 8168257667, @4999Russian Faridabad Call Girls(Badarpur) : ☎ 8168257667, @4999
Russian Faridabad Call Girls(Badarpur) : ☎ 8168257667, @4999Tina Ji
 
Best VIP Call Girls Noida Sector 40 Call Me: 8448380779
Best VIP Call Girls Noida Sector 40 Call Me: 8448380779Best VIP Call Girls Noida Sector 40 Call Me: 8448380779
Best VIP Call Girls Noida Sector 40 Call Me: 8448380779Delhi Call girls
 
Mysore Call Girls 8617370543 WhatsApp Number 24x7 Best Services
Mysore Call Girls 8617370543 WhatsApp Number 24x7 Best ServicesMysore Call Girls 8617370543 WhatsApp Number 24x7 Best Services
Mysore Call Girls 8617370543 WhatsApp Number 24x7 Best ServicesDipal Arora
 
Grateful 7 speech thanking everyone that has helped.pdf
Grateful 7 speech thanking everyone that has helped.pdfGrateful 7 speech thanking everyone that has helped.pdf
Grateful 7 speech thanking everyone that has helped.pdfPaul Menig
 

Kürzlich hochgeladen (20)

Yaroslav Rozhankivskyy: Три складові і три передумови максимальної продуктивн...
Yaroslav Rozhankivskyy: Три складові і три передумови максимальної продуктивн...Yaroslav Rozhankivskyy: Три складові і три передумови максимальної продуктивн...
Yaroslav Rozhankivskyy: Три складові і три передумови максимальної продуктивн...
 
Enhancing and Restoring Safety & Quality Cultures - Dave Litwiller - May 2024...
Enhancing and Restoring Safety & Quality Cultures - Dave Litwiller - May 2024...Enhancing and Restoring Safety & Quality Cultures - Dave Litwiller - May 2024...
Enhancing and Restoring Safety & Quality Cultures - Dave Litwiller - May 2024...
 
Call Girls Pune Just Call 9907093804 Top Class Call Girl Service Available
Call Girls Pune Just Call 9907093804 Top Class Call Girl Service AvailableCall Girls Pune Just Call 9907093804 Top Class Call Girl Service Available
Call Girls Pune Just Call 9907093804 Top Class Call Girl Service Available
 
Understanding the Pakistan Budgeting Process: Basics and Key Insights
Understanding the Pakistan Budgeting Process: Basics and Key InsightsUnderstanding the Pakistan Budgeting Process: Basics and Key Insights
Understanding the Pakistan Budgeting Process: Basics and Key Insights
 
Insurers' journeys to build a mastery in the IoT usage
Insurers' journeys to build a mastery in the IoT usageInsurers' journeys to build a mastery in the IoT usage
Insurers' journeys to build a mastery in the IoT usage
 
GD Birla and his contribution in management
GD Birla and his contribution in managementGD Birla and his contribution in management
GD Birla and his contribution in management
 
VIP Call Girls In Saharaganj ( Lucknow ) 🔝 8923113531 🔝 Cash Payment (COD) 👒
VIP Call Girls In Saharaganj ( Lucknow  ) 🔝 8923113531 🔝  Cash Payment (COD) 👒VIP Call Girls In Saharaganj ( Lucknow  ) 🔝 8923113531 🔝  Cash Payment (COD) 👒
VIP Call Girls In Saharaganj ( Lucknow ) 🔝 8923113531 🔝 Cash Payment (COD) 👒
 
Call Girls in Gomti Nagar - 7388211116 - With room Service
Call Girls in Gomti Nagar - 7388211116  - With room ServiceCall Girls in Gomti Nagar - 7388211116  - With room Service
Call Girls in Gomti Nagar - 7388211116 - With room Service
 
7.pdf This presentation captures many uses and the significance of the number...
7.pdf This presentation captures many uses and the significance of the number...7.pdf This presentation captures many uses and the significance of the number...
7.pdf This presentation captures many uses and the significance of the number...
 
It will be International Nurses' Day on 12 May
It will be International Nurses' Day on 12 MayIt will be International Nurses' Day on 12 May
It will be International Nurses' Day on 12 May
 
Pharma Works Profile of Karan Communications
Pharma Works Profile of Karan CommunicationsPharma Works Profile of Karan Communications
Pharma Works Profile of Karan Communications
 
Monte Carlo simulation : Simulation using MCSM
Monte Carlo simulation : Simulation using MCSMMonte Carlo simulation : Simulation using MCSM
Monte Carlo simulation : Simulation using MCSM
 
Event mailer assignment progress report .pdf
Event mailer assignment progress report .pdfEvent mailer assignment progress report .pdf
Event mailer assignment progress report .pdf
 
VIP Call Girl Jamshedpur Aashi 8250192130 Independent Escort Service Jamshedpur
VIP Call Girl Jamshedpur Aashi 8250192130 Independent Escort Service JamshedpurVIP Call Girl Jamshedpur Aashi 8250192130 Independent Escort Service Jamshedpur
VIP Call Girl Jamshedpur Aashi 8250192130 Independent Escort Service Jamshedpur
 
Progress Report - Oracle Database Analyst Summit
Progress  Report - Oracle Database Analyst SummitProgress  Report - Oracle Database Analyst Summit
Progress Report - Oracle Database Analyst Summit
 
Monthly Social Media Update April 2024 pptx.pptx
Monthly Social Media Update April 2024 pptx.pptxMonthly Social Media Update April 2024 pptx.pptx
Monthly Social Media Update April 2024 pptx.pptx
 
Russian Faridabad Call Girls(Badarpur) : ☎ 8168257667, @4999
Russian Faridabad Call Girls(Badarpur) : ☎ 8168257667, @4999Russian Faridabad Call Girls(Badarpur) : ☎ 8168257667, @4999
Russian Faridabad Call Girls(Badarpur) : ☎ 8168257667, @4999
 
Best VIP Call Girls Noida Sector 40 Call Me: 8448380779
Best VIP Call Girls Noida Sector 40 Call Me: 8448380779Best VIP Call Girls Noida Sector 40 Call Me: 8448380779
Best VIP Call Girls Noida Sector 40 Call Me: 8448380779
 
Mysore Call Girls 8617370543 WhatsApp Number 24x7 Best Services
Mysore Call Girls 8617370543 WhatsApp Number 24x7 Best ServicesMysore Call Girls 8617370543 WhatsApp Number 24x7 Best Services
Mysore Call Girls 8617370543 WhatsApp Number 24x7 Best Services
 
Grateful 7 speech thanking everyone that has helped.pdf
Grateful 7 speech thanking everyone that has helped.pdfGrateful 7 speech thanking everyone that has helped.pdf
Grateful 7 speech thanking everyone that has helped.pdf
 

Q3: Interim report January-September 2022

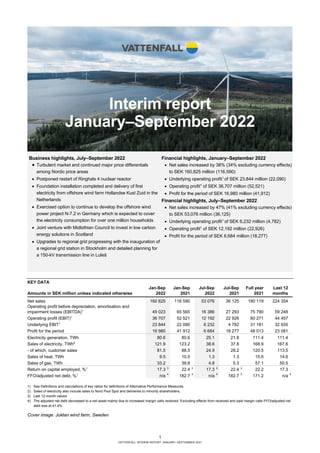
  • 1. 1 VATTENFALL INTERIM REPORT JANUARY–SEPTEMBER 2021 Interim report January–September 2022 KEY DATA Jan-Sep Jan-Sep Jul-Sep Jul-Sep Full year Last 12 Amounts in SEK million unless indicated otherwise 2022 2021 2022 2021 2021 months Net sales 160 825 116 590 53 076 36 125 180 119 224 354 Operating profit before depreciation, amortisation and impairment losses (EBITDA)1 49 023 65 565 16 386 27 293 75 790 59 248 Operating profit (EBIT)1 36 707 52 521 12 192 22 926 60 271 44 457 Underlying EBIT1 23 844 22 090 6 232 4 782 31 181 32 935 Profit for the period 16 980 41 912 6 684 18 277 48 013 23 081 Electricity generation, TWh 80.6 80.6 25.1 21.8 111.4 111.4 Sales of electricity, TWh2 121.9 123.2 38.6 37.8 168.9 167.6 - of which, customer sales 81.5 88.5 24.9 28.2 120.5 113.5 Sales of heat, TWh 9.5 10.5 1.3 1.3 15.6 14.6 Sales of gas, TWh 33.2 39.8 4.8 5.3 57.1 50.5 Return on capital employed, %1 17.3 3 22.4 3 17.3 3 22.4 3 22.2 17.3 FFO/adjusted net debt, %1 n/a 4 182.7 3 n/a 4 182.7 3 171.2 n/a 4 1) See Definitions and calculations of key ratios for definitions of Alternative Performance Measures. 2) Sales of electricity also include sales to Nord Pool Spot and deliveries to minority shareholders. 3) Last 12-month values 4) The adjusted net debt decreased to a net asset mainly due to increased margin calls received. Excluding effects from received and paid margin calls FFO/adjusted net debt was at 41.4% Cover image: Juktan wind farm, Sweden Business highlights, July–September 2022 • Turbulent market and continued major price differentials among Nordic price areas • Postponed restart of Ringhals 4 nuclear reactor • Foundation installation completed and delivery of first electricity from offshore wind farm Hollandse Kust Zuid in the Netherlands • Exercised option to continue to develop the offshore wind power project N-7.2 in Germany which is expected to cover the electricity consumption for over one million households • Joint venture with Midlothian Council to invest in low carbon energy solutions in Scotland • Upgrades to regional grid progressing with the inauguration of a regional grid station in Stockholm and detailed planning for a 150-kV transmission line in Luleå Financial highlights, January–September 2022 • Net sales increased by 38% (34% excluding currency effects) to SEK 160,825 million (116,590) • Underlying operating profit1 of SEK 23,844 million (22,090) • Operating profit1 of SEK 36,707 million (52,521) • Profit for the period of SEK 16,980 million (41,912) Financial highlights, July–September 2022 • Net sales increased by 47% (41% excluding currency effects) to SEK 53,076 million (36,125) • Underlying operating profit1 of SEK 6,232 million (4,782) • Operating profit1 of SEK 12,192 million (22,926) • Profit for the period of SEK 6,684 million (18,277)
  • 2. 2 VATTENFALL INTERIM REPORT JANUARY–SEPTEMBER 2021 CEO’s comment Stable result and strong financial position in troubled times The third quarter was characterised by the turbulent markets and there is major uncertainty ahead of the winter. Vattenfall’s financial position is however strong and the underlying results for the period were stable. Positive contributions from the wind and sales segments’ continued to be offset by negative effects from price differences between Nordic price areas. It is imperative to continue investing in new energy. In the quarter, we utilised our option to continue developing a wind power project corresponding to the electricity consumption of a million households. Anxiety ahead of winter Based on enquiries to our customer support and the public debate at large, we know that many of our customers feel anxious ahead of the winter. Vattenfall is actively engaged in initiatives and dialogues that can help mitigate effects of the current situation. For example, we support our customers by providing advice about energy savings and various types of contracts. It is important to reduce energy consumption in Europe in the short term, especially at peak times, since lower electricity consumption affects both individual customers’ energy bills and contributes to lower market prices for electricity. Major market uncertainty following summer Electricity market prices continue to fluctuate greatly around historically high levels. High fuel prices remain the primary driver of electricity prices on the Continent; that in Germany and the Netherlands have been three to four times higher than in Q3 2021. In the Nordic countries, particularly in southern Sweden, prices have been affected by the Continent but unfavourable weather and wind conditions also impacted, especially in August. Even as fuel and electricity rates have declined somewhat, the situation remains strained. The delayed restart of Ringhals 4 is naturally particularly unfortunate in this situation. The reactor is expected to come back online on 31 January 2023. Stable result and strong financial position Profit for the period declined by SEK 24.9 billion to SEK 17.0 billion. This is mainly due to major positive one-off effects during 2021 related to the sale of our electricity distribution business in Berlin and compensation for the early closure of German nuclear power. Underlying operating profit increased by SEK 1.8 billion to SEK 23.8 billion, primarily driven by our wind business. Our sales operations also performed well as customers increasingly chose Vattenfall because of our greater capacity to handle market uncertainty as an integrated utility. Price area differences continued, however, to impact our Nordic power portfolio negatively. Looking ahead, we see major uncertainties related to intermediate goods and fuel costs, but also higher credit risks driven by the market situation. Several market actors have experienced difficulties as a result of major outflows of margins related to futures contracts. Vattenfall has had net inflows of margin calls and our financial position is strong. In order to safeguard our strong financial position, we are currently engaged in optimising our business flows and pre-emptively building up additional liquidity buffers to be able to manage future outflows. Important to continue investments in new energy During the quarter, Vattenfall used its option to continue to develop the wind farm project N-7.2 off the German North Sea Coast, that is expected to produce fossil-free electricity corresponding to the annual electricity consumption of over a million households. In the Netherlands, all the foundations have now been installed and the first electricity has been delivered from Hollandse Kust Zuid, which will be the world's largest wind farm when commissioned next year. In our partnership for fossil-free steel, HYBRIT, the pilot plant for hydrogen storage has now started, and test findings show that the quality of fossil-free sponge iron produced via the HYBRIT process is higher than its fossil counterpart. Our society needs secure and fossil-free electricity that is affordable. Also, sectors such as transportation and industry need to be electrified, not least for the sake of competitiveness. That is why it is more important than ever that we do not slow down and take the necessary steps for a decarbonised future. Vattenfall contributes to this by investing in all types of fossil-free electricity production and power grids. Anna Borg President and CEO Profit for the period First nine months of 2022 17.0 SEK billion (41.9) Underlying operating profit First nine months of 2022 23.8 SEK billion (22.1) FFO/adjusted net debt Last 12 months N/A (41.4%)1 (182.7) Return on capital employed Last 12 months 17.3% (22.4) 1 Vattenfall’s adjusted net debt is currently negative. The figure in parentheses shows the key figure adjusted for margin calls.
  • 3. 3 VATTENFALL INTERIM REPORT JANUARY–SEPTEMBER 2022 Group overview Vattenfall generates electricity and heat from a portfolio of energy sources, such as hydro and nuclear power, wind power, and fossil fuels. We sell electricity, gas, and heat to private customers and businesses primarily in northern Europe. Vattenfall hedges parts of the future electricity generation through sales in the forward and futures markets. Market development Electricity markets continue to be characterised by major fluctuations triggered by developments on the Continent. Sharply rising gas prices have resulted in record-high electricity prices on the Continent and the Nordic system price has been greatly impacted. Higher average electricity prices for the first nine months of 2022 contributed positively to Vattenfall’s results. Major differences between the system price in the Nordics and the price in respective price areas, however, had a negative impact and resulted in a lower achieved price after price hedges. ELECTRICITY SPOT PRICES, EUR/MWh The average spot price in the Nordic countries increased as a result of higher electricity prices on the Continent, which was primarily attributable to higher prices for fuel and emissions allowances. Jan-Sep. Jul-Sep. 2022 2021 Change 2022 2021 Change Nordics 136.0 50.9 167% 176.00 68.30 158% Germany 249.8 69.2 261% 375.8 97.1 287% Netherlands 256.7 71.6 259% 365.4 101.5 260% NORDIC HYDROLOGY Hydrological balance is a measure of the estimated energy volume stored in the form of snow, and water reservoirs and ground water in relation to a normal situation. Historically, Nordic electricity prices have had a negative correlation with the hydrological balance, since the available hydro power capacity normally regulated what energy sources would be used in the system. Electricity prices in the northern parts of the Nordic countries remain linked to the hydrological balance, while the correlation with system price and the price development in the southern regions has decreased, especially in the past year. By the end of the third quarter 2022, the hydrological balance for the Nordics was below normal levels primarily as a result of the low fill rate in water reservoirs in southern Norway. NORDIC HYDROLOGICAL BALANCE (TWh) However, the fill rates in Vattenfall’s water reservoir rose to 80% (71%), which is 14 percentage points above normal levels. This is attributable to an increased inflow from precipitation in northern Sweden, especially in July and August. This, in turn, had a negative impact on the spot price for electricity in the price areas for northern Sweden. NORDIC PRICE AREA DIFFERENCES The electricity market in the Nordic countries is divided into separate price areas. Sweden has four price areas and Vattenfall’s hydro power assets’ are mainly located in SE1 and SE2 while the nuclear power assets are located in SE3. Vattenfall also has wind power assets in SE4. In recent years, the differences in electricity prices between the areas have grown wider as a result of, among other things, bottlenecks in the transmission grid, which prevents the electricity from reaching southern regions. Moreover, new transmission connections to the Continent have contributed further to higher prices in southern Sweden. The Nordic system price (SYS) is a reference price for all price areas and is calculated by the power exchange Nord Pool. SPOT PRICES PER PRICE AREA AND SYSTEM PRICE (EUR/MWh) 1 Difference between SE1 and SE2 is invisible due to high correlation The price area differentials have remained high for the first nine months of 2022. In southern Sweden, prices increased significantly compared to last year (see above), while the average price for northern Sweden remained relatively stable 0 50 100 150 200 250 300 2019 2020 2021 2022 EUR/MWh SE1¹ SE2¹ SE3 SE4 SYS -30 -20 -10 0 10 20 30 40 2021 2022
  • 4. 4 VATTENFALL INTERIM REPORT JANUARY–SEPTEMBER 2022 INDICATIVE NORDIC HEDGE PRICES AND FINANCIAL HEDGE RATIO (SE, DK, FI) AS PER 30 SEPTEMBER 2022 Vattenfall’s hedging strategy has the objective to even on earnings by selling parts of the planned production in the forward markets. The main exposures arise from outright power in the Nordics with nuclear and hydro power as well as a growing share of wind power in the Nordics, on the Continent and in the UK. 2022 2023 2024 EUR/MWh 25 30 40 Hedge ratio (%) 66 57 38 Due to large price area differences Vattenfall has adjusted its hedging strategy throughout the year, resulting in lower hedge ratio and hedge price for 2022. ACHIEVED NORDIC ELECTRICITY PRICES (SE, DK, FI)1 The achieved price is the average price that Vattenfall received for its electricity production during the period and is impacted by the hedge ratio and hedge price (see above), the spot price and effects from price area differentials. Jan-Sep. Jul-Sep. Full year 2022 2021 2022 2021 2021 EUR/MWh 17 31 14 28 31 Vattenfall's achieved price in the Nordics has decreased significantly primarily because of major price area differentials. FUEL PRICES The prices of gas, coal, and CO2 emission allowances affect mainly Vattenfall’s heat business on the Continent. Gas prices also affect activities within the business segment Customers & Solutions, which is responsible for customer sales of gas. Jan-Sep. Jul-Sep. 2022 2021Change 2022 2021Change Gas (EUR/MWh) 132.5 30.3 337% 198.2 47.3 319% Coal (USD/t) 310.1 104.2 198% 360.6 154.7 133% CO2 (EUR/t) 82.1 48.2 70% 80.0 57.0 40% 1 Achieved prices from the spot market and hedges. Includes Nordic hydro, nuclear and wind power generation The price of gas and coal has increased sharply from January to September 2022 as a result of the war in Ukraine. Gas prices were affected by the unplanned halt in deliveries from Nord Stream 1. The price of coal was affected by high demand in Europe prompted by rising gas prices and higher profitability of coal-fired production capacity. The price for CO2 emission allowances rose primarily as a result of the increased use of coal as fuel. PRICE MARGINS The clean spark spread is the margin between the electricity price and the cost of gas and emissions allowances used for its generation. The clean dark spread represents the same relationship for coal-fired electricity generation. These spreads affect Vattenfall’s heat business in Germany and the Netherlands where the fossil-fired combined heat-and-power (CHP) plants and condensing plants are located. Vattenfall hedges these spreads in part. CLEAN SPARK SPREAD AND CLEAN DARK SPREAD The clean spark spreads were negative for the first nine months of 2022 as a result of higher gas prices. This had a negative financial impact on Vattenfall’s combined heat and power plants. The clean dark spreads increased significantly during the third quarter. -75 -25 25 75 125 175 225 2021 2022 Clean Spark Spread NL (52% efficiency) Clean Dark Spread DE (38% efficiency) Clean Spark Spread DE (50% efficiency)
  • 5. 5 VATTENFALL INTERIM REPORT JANUARY–SEPTEMBER 2022 Generation development Combined electricity generation was unchanged at 80.6 TWh (80.6) for the first nine months of 2022. Generation from fossil-based power declined (–1.9 TWh) as a result of lower clean spark spreads. Generation from nuclear power increased (+1.2 TWh) as a result of higher availability compared to 2021 when the availability of Ringhals 3 was lower. Generation from wind power rose (1.1 TWh) as a result of new capacity, mainly from the offshore wind farm Kriegers Flak, and as a result of higher wind speeds. ELECTRICITY GENERATION (TWh) AVAILABILITY Availability is the percentage of planned production time for an asset with no unforeseen technical issues or maintenance- related outages. Jan-Sep. 2022 2021 Nuclear 85.9% 82.1% Wind - offshore 95.4% 95.8% Wind – onshore 95.6% 96.6% Availability of Vattenfall’s nuclear power for the year's first nine months was higher than the corresponding period in 2021. The availability for wind power was lower. INSTALLED WIND CAPACITY New installed wind power capacity in the last 12 months pertains to Blakliden Fäbodberget (353 MW), South Kyle (38 MW of 240 MW), Moerdijk (20 MW of 27 MW), Nij Hiddum Houw (19 MW), A16 (17 MW of 20 MW) and Haringvliet (4 MW of 22 MW). The comparison is affected by the partial divestment of Princess Ariane (Wieringermeer Extension,114 MW), and divestment of other onshore wind farms (92 MW). MW 30 Sep 2022 30 Sep 2021 Onshore wind 1,688 1,442 Offshore wind 2,602 2,602 Total 4,290 4,044 Sales development Electricity sales, excluding sales to Nord Pool Spot and deliveries to minority owners, declined by 1.3 TWh to 121.9 TWh (123.2), primarily as a result of lower volumes in the business segment in France and in Germany. Gas sales declined by 6.6 TWh to 33.2 TWh (39.8) as a result of warmer weather and lower demand in the Netherlands and Germany. Heat sales declined by 1.0 TWh to 9.5 TWh (10.5) as a result of warmer weather. Jan-Sep. Jul-Sep. 2022 2021Change 2022 2021Change Sales of electricity to customers , TWh 81.5 88.5 -8% 24.9 28.2 -12% Sales of gas, TWh 33.2 39.8 -17% 4.8 5.3 -9% Sales of heat, TWh 9.5 10.5 -10% 1.3 1.3 - TEMPERATURE EFFECTS Temperature effects impact sales volume in the operating segments Customers & Solutions and Heat. Lower temperatures usually mean higher demand for heating (including gas) and electricity. In the Nordic countries, this mainly affects sales of electricity and heat. In Germany and the Netherlands, gas remains the primary source of heat, which means that low temperatures increase demand for gas in addition to increased sales of heat. TEMPERATURE DEVIATION FROM NORMAL LEVELS (ºC) Jan-Sep. Jul-Sep. 2022 2021 2022 2021 Nordics 0.7 -0.0 0.3 0.5 Netherlands 1.1 -0.3 1.1 0.1 Germany 1.2 -0.4 1.3 0.1 During the period January-September 2022, the temperature in Vattenfall's markets was higher than normal, which affected sales negatively. 0 10 20 30 Fossil Nuclear Hydro Wind Biomass, waste Jan-Sep 2022 Jan-Sep 2021
  • 6. 6 VATTENFALL INTERIM REPORT JANUARY–SEPTEMBER 2022 Net sales January–September: Consolidated net sales increased by SEK 44.2 billion (including positive currency effects of SEK 4.6 billion). The increase is mainly attributable to higher electricity prices in the Netherlands, the Nordics, and Germany. July–September: Consolidated net sales increased by SEK 17.0 billion (including positive currency effects of SEK 2.0 billion). The increase is mainly attributable to higher electricity prices in the Netherlands, the Nordics, and Germany. Earnings January–September: The underlying operating profit increased by SEK 1.8 billion, which is explained by: • Higher earnings contribution from the Wind operating segment (SEK +8.8 billion), mainly owing to higher electricity prices on the Continent and new capacity • Higher earnings contribution from the Customers & Solutions operating segment (SEK +2.4 billion), mainly owing to more electricity customers in Germany • Lower earnings contribution from the Heat operating segment (SEK -3.3 billion), mainly due to higher gas prices, which resulted in lower clean spark spreads • Lower earnings contribution from the Power Generation operating segment (SEK -4.6 billion), owing to lower achieved prices in the Nordics and lower realised earnings contributions from trading operations • Other items, net (SEK -1.5 billion) Items affecting comparability amounted to SEK 12.9 billion (30.4), of which most pertains to changes in market value for energy derivatives and inventories (SEK 14.8 billion) and reversed impairment losses (SEK 1.3 billion). Higher provisions related to nuclear power and operating segment Heat (SEK -3.3 billion) had an offsetting effect. Profit for the period totalled SEK 17.0 billion (41.9) and was affected by – in addition to items affecting comparability – lower net financial items resulting from a lower return from the Swedish Nuclear Waste Fund. The profit for the period in 2021 was positively affected by the compensation for the closure of nuclear power operations in Germany (SEK 12.5 billion) and the capital gain from the sale of Stromnetz Berlin (SEK 8.4 billion). July–September: Underlying operating profit increased by SEK 1.5 billion mainly due to positive contributions from the operating segments Wind (SEK 4.1 billion) and Customers & Solutions (SEK 1.0 billion). The operating segments Power Generation and Heat contributed negatively (SEK –2.9 billion and SEK –0.4 billion, respectively). Items affecting comparability amounted to SEK 6.0 billion (18.1), of which most pertains to unrealised changes in market value for energy derivatives and inventories (SEK 6.4 billion) and reversed impairment losses (SEK 0.4 billion). This was offset in part by increased provisions in operating segment Heat (SEK -0.8 billion). Profit for the period totalled SEK 6.7 billion (18.3), were affected by lower net financial items as a result of lower return from the Swedish Nuclear Waste Fund. The profit for the period in 2021 was positively affected by the capital gain from the sale of Stromnetz Berlin (SEK 8.4 billion). Cash flow January–September: Funds from operations (FFO) increased by SEK 0.1 billion. Cash flow from changes in working capital amounted to SEK 81.4 billion. The largest contributing factors were changes related to the net change in margin calls received (SEK 67.0 billion) and changes related to CO2 emission allowances (SEK +23.3 billion). July–September: Funds from operations (FFO) increased by SEK 1.3 billion, mainly owing to higher operating profit before depreciation, amortisation and impairment losses (EBITDA). Cash flow from changes in working capital amounted to SEK 83.1 billion, which is mainly explained by the net change in margin calls received (SEK 70.9 billion). Changes related to CO2 emission allowances (SEK +19.8 billion) had a contributing effect. KEY FIGURES – GROUP OVERVIEW Jan-Sep Jan-Sep Jul-Sep Jul-Sep Full year Last 12 Amounts in SEK million 2022 2021 2022 2021 2021 months Net sales 160 825 116 590 53 076 36 125 180 119 224 354 Operating profit before depreciation, amortisation and impairment losses (EBITDA)1 49 023 65 565 16 386 27 293 75 790 59 248 Operating profit (EBIT)1 36 707 52 521 12 192 22 926 60 271 44 457 Underlying operating profit1 23 844 22 090 6 232 4 782 31 181 32 935 Items affecting comparability1 12 863 30 431 5 960 18 144 29 090 11 522 Profit for the period 16 980 41 912 6 684 18 277 48 013 23 081 Funds from operations (FFO)1 27 598 27 480 7 305 6 054 46 096 46 214 Cash flow from changes in operating assets and operating liabilities (working capital) 81 416 70 040 83 080 55 169 55 736 67 112 Cash flow from operating activities 109 014 97 520 90 385 61 223 101 832 113 326 1) See Definitions and calculations of key ratios for definitions of Alternative Performance Measures.
  • 7. 7 VATTENFALL INTERIM REPORT JANUARY–SEPTEMBER 2022 Capital structure Cash and cash equivalents, and short-term investments increased by SEK 98.4 billion compared with the level at 31 December 2021. Committed credit facilities consist of a EUR 2.0 billion Revolving Credit Facility that expires in November 2024 and six other committed credit facilities totalling EUR 4.3 billion. As per 30 September 2022 available liquid assets and/or committed credit facilities amounted to 149.7% of net sales. Vattenfall’s target is to maintain a level of no less than 10% of consolidated net sales, but at least the equivalent of the next 90 days’ maturities. Net debt decreased by SEK 71.3 billion to a net asset of SEK 116.0 billion and adjusted net debt decreased by SEK 71.0 billion to a net asset of SEK 44.1 billion compared to 31 December 2021. These reductions are mainly attributable to a positive cash flow after investments (SEK 103.0 billion), which is largely explained by the change in working capital (SEK 81.4 billion). Significantly increased electricity and gas prices resulted in higher margin calls received. Dividends paid increased net debt by SEK 24.2 billion. The adjusted net debt was also affected by lower pension provisions (SEK 15.9 billion), which was partially offset by higher provisions for nuclear power (SEK 13.9 billion, net). Excluding effects from received and paid margin calls FFO/adjusted net debt was at 41.4%. NET DEBT -60 -40 -20 0 20 40 60 80 -120 000 -80 000 -40 000 0 40 000 80 000 120 000 160 000 Q2 2021 Q3 2021 Q4 2021 Q1 2022 Q2 2022 Q3 2022 % MSEK Interest-bearing liabilities, MSEK Net debt, MSEK Gross debt/equity, % Net debt/equity, % ADJUSTED NET DEBT -150 -100 -50 0 50 100 150 200 -50 000 -20 000 10 000 40 000 70 000 100 000 130 000 Q2 2021 Q3 2021 Q4 2021 Q1 2022 Q2 2022 Q3 2022 % MSEK Adjusted net debt, MSEK FFO/adjusted net debt, % Strategic focus areas and targets for 2025 Strategic focus area Targets for 2025 Q3 2022 Outcome 2021 Driving decarbonisation with our customers & partners 1. Customer engagement, absolute Net Promoter Score (NPS):1 +18 - +10 Securing a fossil-free energy supply 2. CO2 emissions intensity:2 ≤86 gCO2e/kWh 75 82 Delivering high-performing operations 3. Funds from operations (FFO)/adjusted net debt3 : 22%–27% n/a (41.4%)4 171.2% 4. Return On Capital Employed (ROCE)5 , last 12 months: ≥8% 17.3% 22.2% Empowering our people 5. Lost Time Injury Frequency (LTIF)6 : ≤1.0 6. Employee Engagement Index7 : ≥75% 1.2 - 1.7 75% 1) Absolute NPS is weighted 80% from Customers & Solutions and 20% from Heat, which corresponds to our customer composition. Reported on an annual basis 2) Includes CO2 and other greenhouse gases such as N2O and SF6. as well as indirect emissions from electricity and heat use (scope 2). Consolidated value where CO2 is primarily related to the operating segment Heat. The target for 2025 is to be on track to achieving the 1.5° C target by 2030, according to SBT 3) Rolling 12-months values. Received margin calls had a significant impact on the outcome for both the first nine months 2022 and for the full year 2021 4) The adjusted net debt decreased to a net asset mainly due to increased margin calls received. Excluding effects from received and paid margin calls FFO/adjusted net debt was at 41.4% 5) Rolling 12-months values. Compensation for closure of nuclear power in Germany, changes in market value of energy derivatives and inventories and capital gains from the sale of Stromnetz Berlin's had significant impact on the outcome for the full year 2021 6) Rolling 12-month values. LTIF (Lost Time Injury Frequency) is expressed in terms of the number of lost time work injuries per 1 million hours worked. The metric pertains only to Vattenfall employees 7) Documentation for measurement of target achievement is derived from the results of an employee survey, which is conducted on an annual basis
  • 8. 8 VATTENFALL INTERIM REPORT JANUARY–SEPTEMBER 2022 Operating segments Jan-Sep Jan-Sep Jul-Sep Jul-Sep Full year Last 12 Amounts in SEK million 2022 2021 2022 2021 2021 months Underlying EBIT Customers & Solutions 4 691 2 245 1 341 353 2 349 4 795 Power Generation 9 789 14 398 1 227 4 117 19 334 14 725 - of which, realised trading result 386 4 106 - 2 002 1 339 3 633 - 87 Wind 11 958 3 188 5 230 1 110 7 866 16 636 Heat - 2 701 638 - 1 301 - 906 - 343 - 3 682 Distribution 1 413 2 693 128 240 3 152 1 872 - of which, Distribution Germany — 666 — 1 666 — - of which, Distribution Sweden 1 437 2 032 131 236 2 516 1 921 Other1 - 1 111 - 913 - 336 - 125 - 1 189 - 1 387 Eliminations - 195 - 159 - 57 - 7 12 - 24 Underlying operating profit 23 844 22 090 6 232 4 782 31 181 32 935 1) “Other” pertains mainly to all Staff functions, including Treasury and Shared Service Centres.
  • 9. 9 VATTENFALL INTERIM REPORT JANUARY–SEPTEMBER 2022 Customers & Solutions The Customers & Solutions Business Area is responsible for sales of electricity, gas and energy services in all of Vattenfall’s markets. Strong earnings development as more customers choose Vattenfall • The customer base grew by 4% since the beginning of the year • Cooperation with the supermarket chain Netto enables expansion of charging infrastructure for electric vehicles in Germany Q1–Q3: Net sales increased by 75 % compared to 2021. Underlying operating profit increased by 109 %, mainly owing to a growing customer base in Germany and temporary sourcing effects for electricity and gas. Compared to year-end 2021, Vattenfall’s total customer base increased by 4% to 10.8 million contracts. Sales of electricity decreased by 3% compared to the corresponding period in 2021 mainly due to lower sold volumes to electricity grid operators in France and lower volumes to private customers in the Nordics. Sales of gas decreased by 17%, mainly due to warmer weather and lower consumption in the Netherlands and Germany. Q3: Net sales increased by 95 %. Underlying operating profit increased by 280 % mainly owing to a growing customer base in Germany and temporary sourcing effects for electricity and gas. This was offset in part by lower sales of gas due to warmer weather in the Netherlands. Rising energy prices is a challenge for many of Vattenfall’s customers. Vattenfall’s customer service receive a lot of questions about invoices, payments and the implications of new regulations. Vattenfall gives advice to customers about energy savings and helps its customers address the current situation and find the most suitable solutions. Vattenfall cooperates with the supermarket chain Netto for installing fast charging stations at Netto stores in Germany. The charging stations will be available to the general public and supplied with electricity from renewable sources. The initial plan is to install 940 charging points outside 270 Netto stores. Construction will take place mainly in 2023 and 2024 with Vattenfall in charge of planning, construction, and operation of the charging stations. KEY FIGURES – CUSTOMERS & SOLUTIONS Jan-Sep Jan-Sep Jul-Sep Jul-Sep Full year Last 12 Amounts in SEK million unless indicated otherwise 2022 2021 2022 2021 2021 months Net sales 123 558 70 738 44 140 22 694 106 560 159 380 External net sales 117 303 68 192 41 475 21 666 102 300 151 411 Underlying EBITDA 5 401 2 913 1 593 575 3 230 5 718 Underlying EBIT 4 691 2 245 1 341 353 2 349 4 795 Sales of electricity, TWh 68.7 70.6 21.2 21.9 96.1 94.2 - of which, private customers 20.2 19.3 5.5 5.2 26.8 27.7 - of which, resellers 14.2 5.3 4.5 1.8 7.9 16.8 - of which, business customers 34.3 46.0 11.2 14.9 61.4 49.7 Sales of gas, TWh 32.7 39.1 4.7 5.2 56.0 49.6 Number of employees, full-time equivalents 3 272 3 194 3 272 3 194 3 213
  • 10. 10 VATTENFALL INTERIM REPORT JANUARY–SEPTEMBER 2022 Power Generation Power Generation comprises the Generation and Markets Business Areas. The segment includes Vattenfall’s hydro and nuclear power operations, maintenance services business, and optimisation and trading operations including certain large business customers. The result from hedging the Group’s net exposure in electricity and fuel is reported in this segment. Lower achieved price had a negative impact on earnings • Postponed restart of nuclear reactor Ringhals 4 • Business Area Markets has signed a new contract with Shell for the delivery of electricity from Vattenfall’s offshore wind farm Thanet in the UK Q1–Q3: Net sales increased by 86%. Underlying operating profit decreased by 32%. The decrease was mainly attributable to lower achieved prices in the Nordic countries that were affected by major price differences between electricity price areas in Sweden and a lower realised trading result mainly due to intra- year timing effects which will be reversed in the future. The realised trading result in 2021 was at an exceptionally high level. Higher contribution from pumped hydro storage operations in Germany and higher nuclear power generation (1.2 TWh) had an offsetting impact. The average electricity spot price was higher compared to the first nine months of 2021 but the achieved price decreased due to higher price differences between electricity price areas in Sweden. Q3: Net sales increased by 93%. Underlying operating profit decreased by 70% mainly owing to a lower realised trading result and lower achieved prices in the Nordic countries due to major price differences between electricity price areas in Sweden. This was offset by higher contribution from pumped hydro storage in Germany. The restart after the annual maintenance and fuel replacement shutdown at Ringhals 4 has been postponed to 31 January 2023. The reason for the postponement is that the plant’s pressure vessel was damaged while undergoing mandatory testing. No safety anomalies occurred at the plant and reactor safety remained unaffected. The damage was limited to the pressure regulator. Business Area Markets has signed a five-year agreement with Shell for the delivery of 300,000 MWh electricity from Vattenfall’s offshore wind farm Thanet in the UK. This corresponds to about one-third of the annual electricity production at Thanet. After the end of the quarter, the Swedish Radiation Safety Authority and the Swedish Transmission System Operator, Svenska Kraftnät, approved the capacity increase of Forsmark 1 nuclear reactor. The capacity increase will take place in two stages, with approximately 50 MW in 2022 and an additional 50 MW in 2023. KEY FIGURES – POWER GENERATION Jan-Sep Jan-Sep Jul-Sep Jul-Sep Full year Last 12 Amounts in SEK million unless indicated otherwise 2022 2021 2022 2021 2021 months Net sales 137 357 73 669 48 093 24 942 126 318 190 006 External net sales 17 416 23 350 4 140 8 682 40 312 34 378 Underlying EBITDA 13 508 17 641 2 537 5 230 23 714 19 581 Underlying EBIT 9 789 14 398 1 227 4 117 19 334 14 725 - of which, realised trading result 386 4 106 - 2 002 1 339 3 633 - 87 Electricity generation, TWh 60.3 59.5 19.8 16.6 81.2 82.0 - of which, hydro power 30.1 30.5 11.0 9.2 40.8 40.4 - of which, nuclear power 30.2 29.0 8.8 7.4 40.4 41.6 Sales of electricity, TWh 11.1 16.3 3.1 5.8 22.2 17.0 - of which, resellers 9.8 15.5 2.6 5.5 17.5 11.8 - of which, business customers 1.3 0.8 0.5 0.3 4.7 5.2 Sales of gas, TWh 0.5 0.7 0.1 0.1 1.1 0.9 Number of employees, full-time equivalents 7 238 7 307 7 238 7 307 7 260
  • 11. 11 VATTENFALL INTERIM REPORT JANUARY–SEPTEMBER 2022 Wind The Wind Business Area is responsible for development, construction and operation of Vattenfall’s wind farms as well as large-scale and decentralised solar power and batteries. Increased earnings as a result of higher electricity prices and new capacity • Foundation installation completed and delivery of first electricity from offshore wind farm Hollandse Kust Zuid in the Netherlands • Prequalified to participate in tender of floating offshore wind power in France • Exercised option to continue to develop the offshore wind power project N 7.2 in Germany which is expected to cover the electricity consumption for over one million households Q1–Q3: Net sales increased by 99% compared to 2021. Underlying operating profit increased by 275% driven by higher electricity prices on the Continent and new capacity, especially attributable to the offshore wind farm Kriegers Flak in Denmark. Electricity generation increased by 14% primarily as a result of new capacity and higher wind speeds mainly in the beginning of the year, especially in Sweden, Germany and Denmark. Q3: Net sales increased by 129%. Underlying operating profit increased by 371% mainly as a result of higher continental electricity prices. Electricity generation decreased by 2% driven by lower onshore production due to the partial divestment of the wind farm Princess Ariane This was offset in part by higher offshore production. The construction of Vattenfall's wind farm Hollandse Kust Zuid is moving ahead. The first electricity was delivered in August, and September saw the completion of the last of the project's 140 foundations. The wind farm is expected to be fully operational in 2023 and have a total installed capacity of 1,520 MW, equivalent to the annual electricity consumption of 1.5 million Dutch households. Vattenfall has been pre-qualified for the upcoming tender for floating offshore wind power in France. Two areas have been identified for the project, each with a capacity of 250 MW, or the annual energy consumption of half a million French households. The decision to award the project is expected in late 2023, and the wind farms are expected to be commissioned at the end of this decade. Vattenfall used its option to continue to develop to develop the offshore wind project N-7.2 off the German North Sea coast. The project will have a total capacity of 980 MW, corresponding to more than the annual electricity consumption of a million German households. Pending a final investment decision, the wind farm could be connected to the German power grid in 2027. In late September, Vattenfall entered into an agreement with Siemens Energy and Aker Solutions AS for the delivery of grid connection infrastructure for the offshore wind farm Norfolk Boreas off the UK coast. According to the agreement, Siemens Energy and Aker Solutions is responsible for the technology, the procurement procedure, construction, and installation of onshore and offshore high voltage direct current transformer stations as well as connecting the project to the transmission grid. KEY FIGURES – WIND Jan-Sep Jan-Sep Jul-Sep Jul-Sep Full year Last 12 Amounts in SEK million unless indicated otherwise 2022 2021 2022 2021 2021 months Net sales 21 122 10 615 8 155 3 559 20 872 31 379 External net sales 3 213 3 641 1 156 1 022 7 791 7 363 Underlying EBITDA 16 411 7 332 6 732 2 566 13 451 22 530 Underlying EBIT 11 958 3 188 5 230 1 110 7 866 16 636 Electricity generation - wind power TWh 8.6 7.5 2.3 2.3 11.2 12.3 Sales of electricity, TWh 0.8 0.7 0.3 0.2 1.0 1.1 Number of employees, full-time equivalents 1 491 1 250 1 491 1 250 1 279
  • 12. 12 VATTENFALL INTERIM REPORT JANUARY–SEPTEMBER 2022 Heat The Heat Business Area comprises Vattenfall’s heat business (district heating and decentralised solutions) and gas-fired condensing plants. Lower clean spark spreads affected results negatively • Higher gas prices could not be covered by higher heat and electricity revenues • Joint venture with Midlothian Council to invest in low carbon energy solutions in Scotland • Increased integration of excess heat into Vattenfall’s district heating network through corporation with AstaReal in Sweden and AEB in the Netherlands Q1–Q3: Net sales increased by 116%. The underlying operating profit decreased by 523% compared to the first nine months of 2021, mainly owing to higher gas prices which led to lower clean spark spreads primarily affecting heat operations. Higher operating expenses largely driven by planned maintenance also impacted the underlying operating profit negatively. This was partly offset by higher heat prices following post-hoc price adjustments for the fuel price development. Hedging of spreads also had an offsetting effect, which is reported in the Power Generation operating segment. Electricity generation decreased as a result of the lower spreads and sales of heat decreased due to higher temperatures. Compared to year-end 2021, the number of customers increased by 2.1% to the equivalent of 2.0 million households1 . Q3: Net sales increased by 181%. The underlying operating profit decreased by 44% compared to the third quarter 2021. Higher gas prices resulted in lower clean spark spreads which affected the heat operations. Higher operating expenses due to planned maintenance also had a negative impact on the underlying operating profit. Higher heat prices had an offsetting impact as they undergo subsequent adjustment for the increasing fuel prices. In September, Vattenfall and Midlothian Council formed a joint venture (50/50) in Scotland, called Midlothian Energy Limited. The parties plan to invest GBP 100 million in low carbon energy solutions over the next five years. Construction of the first district heating grid is planned to start before the end of the year. Upon completion, the project is expected to be able to deliver heating to 3,000 households as well as premises for education and retail. Initially, excess heat from a waste and recycling plant will be integrated into the district heating grid. Vattenfall is working on integrating more excess heat into the district heating grid. Vattenfall’s partnership with AstaReal in Sweden is an example where the first excess heat from algae cultivation was delivered to households in Gustavsberg via Vattenfall’s district heating grid. Excess heat integration from waste is also part of the transition to heating without natural gas in Amsterdam. The capacity between Vattenfall’s partially owned district heating grid and AEB’s waste incineration plant in Amsterdam has been expanded and the first heat was delivered in the third quarter. KEY FIGURES – HEAT Jan-Sep Jan-Sep Jul-Sep Jul-Sep Full year Last 12 Amounts in SEK million unless indicated otherwise 2022 2021 2022 2021 2021 months Net sales 42 466 19 640 14 502 5 170 34 759 57 585 External net sales 14 098 9 836 3 914 2 433 14 655 18 917 Underlying EBITDA - 519 2 827 - 635 - 179 2 590 - 756 Underlying EBIT - 2 701 638 - 1 301 - 906 - 343 - 3 682 Electricity generation - TWh 11.7 13.6 3.0 2.9 19.0 17.1 - of which, fossil-based power 11.5 13.4 3.0 2.8 18.6 16.7 - of which, biomass, waste 0.2 0.2 — 0.1 0.3 0.3 Sales of electricity business customers, TWh 0.9 0.9 0.3 0.3 1.2 1.2 Sales of heat, TWh 9.5 10.5 1.3 1.3 15.6 14.6 Number of employees, full-time equivalents 3 150 3 165 3 150 3 165 3 126 1) Including decentralised energy solutions that have previously been reported separately
  • 13. 13 VATTENFALL INTERIM REPORT JANUARY–SEPTEMBER 2022 Distribution The Distribution Business Area comprises Vattenfall’s electricity distribution operations in Sweden and the UK. High demand for connections to the electricity grid • Upgrades to regional grid progressing with the inauguration of a regional grid station in Stockholm and detailed planning for a 150-kV transmission line in Luleå • Connection project in Gothenburg selected to be part of an initiative to reduce lead times for expanding the power grid • Pilot project for flexible fast charging of electric vehicles in Riksgränsen in northern Sweden Q1–Q3: Net sales decreased by 35% and the underlying operating profit decreased by 48% compared to 2021. The sale of Stromnetz Berlin on 1 July 2021 affected the net sales comparison by SEK 5.3 billion and the underlying operating profit negatively by SEK 0.7 billion. In addition, the underlying operating profit was affected by higher operating expenses and a lower gross margin in the Swedish operation, mainly owing to higher costs related to the transmission network as well as an increase in network losses caused by higher electricity prices. Q3: Net sales increased by 8% compared to 2021. Underlying operating profit decreased by 47% due to higher operating expenses, mainly due to higher personnel expenses, which was partly offset by a higher gross margin. In order to meet the Stockholm region's growth and increased demand for electricity, the regional grid is undergoing extensive upgrades. Transformer stations are being rebuilt, new power lines are being constructed, and existing ones are reinforced to increase capacity. The work is expected to be completed by 2030 with investments totalling SEK 1.8 billion. As part of the upgrades, a new regional grid station was inaugurated in Barkarby in September to increase the power grid capacity and secure the power supply. Vattenfall’s customers are determined to decarbonise their activities and the area around Luleå has seen record-high demand for connections. Vattenfall is strengthening the regional grid in the area in stages and has recently been awarded a line concession for a 150 kV transmission line between Lerbäcken and Hertsöfältet in Luleå. The detailed planning phase has begun and the project is expected to be completed in 2024/2025. Shorter permitting processes for the power grid are central to enable the energy transition. To that end, the Swedish Energy Markets Inspectorate has selected yet another Vattenfall project to participate in the government initiative to shorten lead times to expand the power grid. The connection project that was picked should facilitate increased power output, which is a prerequisite for a sustainable industry transition in the Gothenburg area. Vattenfall's new pilot project for flexible, fast charging of electric vehicles is in progress in Riksgränsen, Sweden's northernmost border. The project enables connection to the power grid in an area that currently has limited capacity. The next step is to test and analyse the solution within the framework of the R&D project FlexConnect. In these turbulent times, many of Vattenfall’s customers are concerned about the market situation, and customer service enquiries are up by 200% in 2022 compared to 2021. Many customers are looking to start producing their own electricity; and so far this year Vattenfall has received 11,000 connection requests. That represents a 100% increase compared to the same time last year. Vattenfall is in the process of changing over to a large-scale workflow approach to reduce the wait times to connect new production while strengthening operations with additional resources. After the end of the quarter, the Swedish Energy Markets Inspectorate approved the concession application initially filed in October 2020 for two 130 kV overhead power lines from Hedelunda to Oxelösund. The lines will enable the connection of SSAB’s electric arc furnace, which will result in a substantial reduction in CO2 emissions. KEY FIGURES – DISTRIBUTION Jan-Sep Jan-Sep Jul-Sep Jul-Sep Full year Last 12 Amounts in SEK million unless indicated otherwise 2022 2021 2022 2021 2021 months Net sales 9 026 13 833 2 503 2 308 17 262 12 455 External net sales 8 461 11 338 2 280 2 140 14 643 11 766 Underlying EBITDA 3 298 4 811 756 838 5 913 4 400 Underlying EBIT 1 413 2 693 128 240 3 152 1 872 Number of employees, full-time equivalents 1 322 1 161 1 322 1 161 1 165
  • 14. 14 VATTENFALL INTERIM REPORT JANUARY–SEPTEMBER 2022 Other Other pertains mainly to all Staff functions, including Treasury and Shared Service Centres. Net sales consist primarily of revenues attributable to Vattenfall’s service organisations such as Shared Services, IT and Vattenfall Insurance. KEY FIGURES – OTHER Jan-Sep Jan-Sep Jul-Sep Jul-Sep Full year Last 12 Amounts in SEK million unless indicated otherwise 2022 2021 2022 2021 2021 months Net sales 6 157 4 455 2 148 1 426 6 169 7 871 External net sales 334 233 111 182 418 519 Underlying EBITDA - 453 - 231 - 106 126 - 326 - 548 Underlying EBIT - 1 111 - 913 - 336 - 125 - 1 189 - 1 387 Number of employees, full-time equivalents 3 000 2 806 3 000 2 806 2 792
  • 15. 15 VATTENFALL INTERIM REPORT JANUARY–SEPTEMBER 2022 Consolidated income statement Jan-Sep Jan-Sep Jul-Sep Jul-Sep Full year Last 12 Amounts in SEK million 2022 2021 2022 2021 2021 months Net sales 160 825 116 590 53 076 36 125 180 119 224 354 Cost of purchases - 82 800 - 44 402 - 27 059 - 10 286 - 87 474 - 125 872 Other external expenses - 14 466 - 13 386 - 5 061 - 3 447 - 18 450 - 19 530 Personnel expenses - 15 142 - 14 807 - 4 734 - 4 306 - 19 801 - 20 136 Other operating income and expenses, net 503 21 613 172 9 292 21 454 344 Participations in the results of associated companies 103 - 43 - 8 - 85 - 58 88 Operating profit before depreciation, amortisation and impairment losses (EBITDA) 49 023 65 565 16 386 27 293 75 790 59 248 Depreciation, amortisation and impairments - 12 316 - 13 044 - 4 194 - 4 367 - 15 519 - 14 791 Operating profit (EBIT) 36 707 52 521 12 192 22 926 60 271 44 457 Financial income3 609 673 5 227 426 5 783 719 Financial expenses1,2,3 - 6 140 - 4 307 5 - 2 032 - 1 737 5 - 5 906 - 7 739 Return from the Swedish Nuclear Waste Fund - 6 543 3 330 - 659 567 4 225 - 5 648 Profit before income taxes 24 633 52 217 9 728 22 182 59 373 31 789 Income taxes - 7 653 - 10 305 - 3 044 - 3 905 - 11 360 - 8 708 Profit for the period 16 980 41 912 6 684 18 277 48 013 23 081 Attributable to owner of the Parent Company 16 502 41 054 6 242 18 178 46 828 22 276 Attributable to non-controlling interests 478 858 442 99 1 185 805 Supplementary information Underlying EBITDA4 37 451 35 134 10 820 9 149 48 584 50 901 Underlying EBIT4 23 844 22 090 6 232 4 782 31 181 32 935 Financial items, net excl. discounting effects attributable to provisions and return from the Swedish Nuclear Waste Fund - 4 032 - 2 106 - 1 304 - 802 - 3 090 - 5 016 1) Including interest components related to pension costs - 431 - 328 - 145 - 110 - 439 - 542 2) Including discounting effects attributable to provisions - 1 499 - 1 528 - 501 - 509 - 2 033 - 2 004 3) Items affecting comparability recognised as financial income and expenses, net 6 - 6 2 — - 6 6 4) See note 5 for information on items affecting comparability 5) The value has been adjusted compared with information previously published in Vattenfall’s financial reports.
  • 16. 16 VATTENFALL INTERIM REPORT JANUARY–SEPTEMBER 2022 Consolidated statement of comprehensive income Jan-Sep Jan-Sep Jul-Sep Jul-Sep Full year Last 12 Amounts in SEK million 2022 2021 2022 2021 2021 months Profit for the period 16 980 41 912 6 684 18 277 48 013 23 081 Other comprehensive income Items that will be reclassified to profit or loss when specific conditions are met Cash flow hedges - changes in fair value 72 847 61 824 43 412 45 462 82 259 93 282 Cash flow hedges - dissolved against income statement - 76 399 - 8 675 - 37 832 - 5 653 - 31 553 - 99 277 Cash flow hedges - transferred to cost of hedged item 4 11 - 1 2 16 9 Hedging of net investments in foreign operations - 2 013 - 977 - 426 - 405 - 1 414 - 2 450 Translation differences, divested companies — 689 — 643 697 8 Translation differences 10 232 1 870 2 606 538 3 218 11 580 Income taxes related to items that will be reclassified - 3 627 - 16 347 - 2 570 - 12 093 - 15 420 - 2 700 Total items that will be reclassified to profit or loss when specific conditions are met 1 044 38 395 5 189 28 494 37 803 452 Items that will not be reclassified to profit or loss Remeasurement pertaining to defined benefit obligations 16 557 426 3 451 - 2 - 670 15 461 Income taxes related to items that will not be reclassified - 4 575 - 5 - 1 059 — 226 - 4 344 Total items that will not be reclassified to profit or loss 11 982 421 2 392 - 2 - 444 11 117 Total other comprehensive income, net after income taxes 13 026 38 816 7 581 28 492 37 359 11 569 Total comprehensive income for the period 30 006 80 728 14 266 46 769 85 372 34 650 Attributable to owner of the Parent Company 28 830 79 727 13 611 46 646 83 915 33 018 Attributable to non-controlling interests 1 176 1 001 655 123 1 457 1 632
  • 17. 17 VATTENFALL INTERIM REPORT JANUARY–SEPTEMBER 2022 Operating segments, Vattenfall Group Jan-Sep Jan-Sep Jul-Sep Jul-Sep Full year Last 12 Amounts in SEK million 2022 2021 2022 2021 2021 months External net sales Customers & Solutions 117 303 68 192 41 475 21 666 102 300 151 411 Power Generation 17 416 23 350 4 140 8 682 40 312 34 378 Wind 3 213 3 641 1 156 1 022 7 791 7 363 Heat 14 098 9 836 3 914 2 433 14 655 18 917 Distribution 8 461 11 338 2 280 2 140 14 643 11 766 - of which, Distribution Germany — 3 202 — 4 3 203 1 - of which, Distribution Sweden 8 358 8 042 2 245 2 105 11 310 11 626 Other1 334 233 111 182 418 519 Total 160 825 116 590 53 076 36 125 180 119 224 354 Internal net sales Customers & Solutions 6 255 2 546 2 665 1 028 4 260 7 969 Power Generation 119 941 50 319 43 953 16 260 86 006 155 628 Wind 17 909 6 974 6 999 2 537 13 081 24 016 Heat 28 368 9 804 10 588 2 737 20 104 38 668 Distribution 565 2 495 223 168 2 619 689 - of which, Distribution Germany — 2 062 — 2 2 061 - 1 - of which, Distribution Sweden 566 447 214 170 586 705 Other1 5 823 4 222 2 037 1 244 5 751 7 352 Eliminations - 178 861 - 76 360 - 66 465 - 23 974 - 131 821 - 234 322 Total — — — — — — Total net sales Customers & Solutions 123 558 70 738 44 140 22 694 106 560 159 380 Power Generation 137 357 73 669 48 093 24 942 126 318 190 006 Wind 21 122 10 615 8 155 3 559 20 872 31 379 Heat 42 466 19 640 14 502 5 170 34 759 57 585 Distribution 9 026 13 833 2 503 2 308 17 262 12 455 - of which, Distribution Germany — 5 264 — 6 5 264 — - of which, Distribution Sweden 8 924 8 489 2 459 2 275 11 896 12 331 Other1 6 157 4 455 2 148 1 426 6 169 7 871 Eliminations - 178 861 - 76 360 - 66 465 - 23 974 - 131 821 - 234 322 Total 160 825 116 590 53 076 36 125 180 119 224 354
  • 18. 18 VATTENFALL INTERIM REPORT JANUARY–SEPTEMBER 2022 Jan-Sep Jan-Sep Jul-Sep Jul-Sep Full year Last 12 Amounts in SEK million 2022 2021 2022 2021 2021 months Operating profit before depreciation, amortisation and impairment losses (EBITDA) Customers & Solutions 5 404 2 923 1 596 585 3 241 5 722 Power Generation 25 746 39 445 8 904 14 641 42 053 28 354 Wind 16 434 7 407 6 733 2 640 13 534 22 561 Heat - 1 312 2 854 - 1 418 - 187 2 842 - 1 324 Distribution 3 308 4 810 757 838 5 911 4 409 - of which, Distribution Germany — 1 008 — 1 1 008 — - of which, Distribution Sweden 3 281 3 764 744 818 4 873 4 390 Other1 - 362 8 285 - 129 8 783 8 197 - 450 Eliminations - 195 - 159 - 57 - 7 12 - 24 Total 49 023 65 565 16 386 27 293 75 790 59 248 Underlying EBITDA Customers & Solutions 5 401 2 913 1 593 575 3 230 5 718 Power Generation 13 508 17 641 2 537 5 230 23 714 19 581 Wind 16 411 7 332 6 732 2 566 13 451 22 530 Heat - 519 2 827 - 635 - 179 2 590 - 756 Distribution 3 298 4 811 756 838 5 913 4 400 - of which, Distribution Germany — 1 009 — 1 1 009 — - of which, Distribution Sweden 3 271 3 764 743 818 4 874 4 381 Other1 - 453 - 231 - 106 126 - 326 - 548 Eliminations - 195 - 159 - 57 - 7 12 - 24 Total 37 451 35 134 10 820 9 149 48 584 50 901 Jan-Sep Jan-Sep Jul-Sep Jul-Sep Full year Last 12 Amounts in SEK million 2022 2021 2022 2021 2021 months Operating profit (EBIT) Customers & Solutions 4 694 2 255 1 345 362 2 446 4 885 Power Generation 22 025 36 201 7 595 13 530 39 502 25 326 Wind 11 981 3 264 5 231 1 185 7 919 16 636 Heat - 2 203 665 - 1 691 - 914 - 91 - 2 959 Distribution 1 424 2 692 128 240 3 150 1 882 - of which, Distribution Germany — 665 — 1 665 — - of which, Distribution Sweden 1 447 2 032 132 236 2 515 1 930 Other1 - 1 019 7 603 - 359 8 530 7 333 - 1 289 Eliminations - 195 - 159 - 57 - 7 12 - 24 Operating profit (EBIT) 36 707 52 521 12 192 22 926 60 271 44 457 Operating profit (EBIT) 36 707 52 521 12 192 22 926 60 271 44 457 Financial net - 12 074 - 304 - 2 464 - 744 - 898 - 12 668 Profit before tax 24 633 52 217 9 728 22 182 59 373 31 789 Underlying EBIT Customers & Solutions 4 691 2 245 1 341 353 2 349 4 795 Power Generation 9 789 14 398 1 227 4 117 19 334 14 725 Wind 11 958 3 188 5 230 1 110 7 866 16 636 Heat - 2 701 638 - 1 301 - 906 - 343 - 3 682 Distribution 1 413 2 693 128 240 3 152 1 872 - of which, Distribution Germany — 666 — 1 666 — - of which, Distribution Sweden 1 437 2 032 131 236 2 516 1 921 Other1 - 1 111 - 913 - 336 - 125 - 1 189 - 1 387 Eliminations - 195 - 159 - 57 - 7 12 - 24 Underlying EBIT 23 844 22 090 6 232 4 782 31 181 32 935 1) “Other” pertains mainly to all Staff functions, including Treasury, Shared Service Centres and material capital gains and -losses.
  • 19. 19 VATTENFALL INTERIM REPORT JANUARY–SEPTEMBER 2022 Consolidated balance sheet 30 Sep 30 Sep 31 Dec Amounts in SEK million 2022 2021 2021 Assets Non-current assets Intangible assets: non-current 18 282 16 853 17 070 Property, plant and equipment 268 624 243 329 252 828 Participations in associated companies and joint arrangements 6 609 4 864 6 110 Other shares and participations 321 311 313 Share in the Swedish Nuclear Waste Fund 46 339 51 364 52 772 Derivative assets 100 852 29 459 35 240 Deferred tax assets 10 794 8 258 8 905 Contract assets1 56 95 85 Other non-current receivables 6 122 6 454 6 118 Total non-current assets 457 999 360 987 379 441 Current assets Inventories 24 688 22 391 41 539 Intangible assets: current 1 517 42 4 861 Trade receivables and other receivables 39 836 46 951 41 219 Contract assets1 204 357 290 Advance payments paid 16 420 5 443 8 362 Derivative assets 275 435 111 648 120 645 Prepaid expenses and accrued income 11 546 7 045 12 402 Current tax assets 335 1 361 2 717 Short-term investments 95 953 63 803 102 706 Cash and cash equivalents 173 367 67 644 68 176 Assets held for sale 5 189 38 — Total current assets 644 490 326 723 402 917 Total assets 1 102 489 687 710 782 358 Equity and liabilities Equity Attributable to owner of the Parent Company 186 164 176 034 180 710 Attributable to non-controlling interests 18 160 15 100 16 472 Total equity 204 324 191 134 197 182 Non-current liabilities Hybrid Capital 21 960 20 135 20 421 Other interest-bearing liabilities 54 540 50 517 50 839 Pension provisions 24 457 39 247 40 328 Other interest-bearing provisions 147 767 113 113 116 637 Derivative liabilities 101 831 24 025 30 307 Deferred tax liabilities 48 518 35 463 33 913 Contract liabilities1 7 770 7 109 7 422 Other noninterest-bearing liabilities 2 089 1 945 2 018 Total non-current liabilities 408 932 291 554 301 885 Current liabilities Trade payables and other liabilities 23 971 34 725 39 241 Contract liabilities1 981 953 1 213 Advance payments received 123 595 54 979 62 790 Derivative liabilities 240 667 83 505 99 511 Accrued expenses and deferred income 16 903 11 143 18 460 Current tax liabilities 2 353 2 797 2 418 Other interest-bearing liabilities 77 430 13 776 55 148 Interest-bearing provisions 3 205 3 144 4 510 Liabilities associated with assets held for sale 128 — — Total current liabilities 489 233 205 022 283 291 Total equity and liabilities 1 102 489 687 710 782 358 1) The presentation has been adjusted compared with information previously published in Vattenfall’s financial reports. See note 1.
  • 20. 20 VATTENFALL INTERIM REPORT JANUARY–SEPTEMBER 2022 SUPPLEMENTARY INFORMATION 30 Sep 30 Sep 31 Dec Amounts in SEK million 2022 2021 2021 Calculation of capital employed Intangible assets: current and non-current 19 799 16 895 21 931 Property, plant and equipment 268 624 243 329 252 828 Participations in associated companies and joint arrangements 6 609 4 864 6 110 Deferred and current tax assets 11 129 9 619 11 622 Non-current noninterest-bearing receivables 4 194 3 443 3 563 Current and non-current contract assets 260 452 375 Inventories 24 688 22 391 41 539 Trade receivables and other receivables 39 836 46 951 41 219 Prepaid expenses and accrued income 11 546 7 045 12 402 Unavailable liquidity 2 233 3 854 3 446 Other 712 339 643 Total assets excl. financial assets 389 630 359 182 395 678 Deferred and current tax liabilities - 50 871 - 38 260 - 36 331 Other noninterest-bearing liabilities - 2 089 - 1 945 - 2 018 Current and non-current contract liabilities - 8 751 - 8 062 - 8 635 Trade payable and other liabilities - 23 971 - 34 725 - 39 241 Accrued expenses and deferred income - 16 903 - 11 143 - 18 460 Other - 1 378 - 422 - 899 Total noninterest-bearing liabilities - 103 963 - 94 557 - 105 584 Other interest-bearing provisions not related to adjusted net debt1 - 27 220 - 9 441 - 9 213 Capital employed2 258 447 255 184 280 881 Capital employed, average 256 816 258 053 271 674 Calculation of net debt Hybrid Capital - 21 960 - 20 135 - 20 421 Bond issues and liabilities to credit institutions - 44 184 - 41 231 - 37 732 Short-term debt, commercial papers and repo - 67 532 - 1 548 - 46 189 Liabilities to associated companies - 947 - 1 103 - 1 452 Liabilities to owners of non-controlling interests - 10 002 - 10 883 - 10 747 Other liabilities - 9 306 - 9 528 - 9 867 Total interest-bearing liabilities - 153 931 - 84 428 - 126 408 Cash and cash equivalents 173 367 67 644 68 176 Short-term investments 95 953 63 803 102 706 Loans to owners of non-controlling interests in foreign Group companies 619 329 229 Net debt2 116 008 47 348 44 703 Calculation of adjusted gross debt and net debt Total interest-bearing liabilities - 153 931 - 84 428 - 126 408 50% of Hybrid Capital3 10 980 10 068 10 211 Present value of pension obligations - 24 457 - 39 247 - 40 328 Provisions for gas and wind operations and other environment-related provisions - 13 754 - 11 188 - 11 687 Provisions for nuclear power (net)4 - 54 086 - 37 869 - 40 233 Margin calls received 2 282 2 919 3 340 Liabilities to owners of non-controlling interests due to consortium agreements 10 002 10 883 10 747 Adjusted gross debt - 222 964 - 148 862 - 194 358 Reported cash and cash equivalents and short-term investments 269 320 131 447 170 882 Unavailable liquidity - 2 233 - 3 854 - 3 446 Adjusted cash and cash equivalents and short-term investments 267 087 127 593 167 436 Adjusted net debt2 44 123 - 21 269 - 26 922 1) Includes personnel-related provisions for non-pension purposes, provisions for tax and legal disputes and certain other provisions. 2) See Definitions and calculations of key ratios for definitions of Alternative Performance Measures. 3) 50% of Hybrid Capital is treated as equity by the rating agencies, which thereby reduces adjusted net debt. 4) The calculation is based on Vattenfall’s share of ownership in the respective nuclear power plants, less Vattenfall’s share in the Swedish Nuclear Waste Fund and liabilities relating to funding of decommissioning obligations in Stade and Brokdorf. Vattenfall has the following ownership interests in the respective plants: Forsmark 66%, Ringhals 70.4%, Brokdorf 20%, Brunsbüttel 66.7%, Krümmel 50% and Stade 33.3%. (According to a special agreement, Vattenfall is responsible for 100% of the provisions for Ringhals.)
  • 21. 21 VATTENFALL INTERIM REPORT JANUARY–SEPTEMBER 2022 Consolidated statement of cash flows Jan-Sep Jan-Sep Jul-Sep Jul-Sep Full year Last 12 Amounts in SEK million 2022 2021 2022 2021 2021 months Operating activities Operating profit before depreciation, amortisation and impairment losses (EBITDA) 49 023 65 565 16 386 27 293 75 790 59 248 Tax paid - 2 738 - 2 721 - 883 - 1 008 - 6 725 - 6 742 Capital gains/losses, net - 110 - 8 636 28 - 8 737 - 8 760 - 234 Interest received 508 353 298 177 523 678 Interest paid - 2 833 - 2 571 - 793 - 252 - 3 226 - 3 488 Other, incl. non-cash items - 16 252 - 24 510 - 7 731 - 11 419 - 11 506 - 3 248 Funds from operations (FFO) 27 598 27 480 7 305 6 054 46 096 46 214 Changes in inventories 20 093 - 3 955 20 251 - 1 072 - 23 067 981 Changes in operating receivables 9 529 - 11 556 157 - 2 466 - 31 816 - 10 731 Changes in operating liabilities1 - 12 800 8 561 - 6 151 5 103 26 232 4 871 Margin calls1 67 044 79 226 70 914 55 673 88 995 76 813 Other changes - 2 450 - 2 236 - 2 091 - 2 069 - 4 608 - 4 822 Cash flow from changes in operating assets and operating liabilities 81 416 70 040 83 080 55 169 55 736 67 112 Cash flow from operating activities 109 014 97 520 90 385 61 223 101 832 113 326 Investing activities Acquisitions in Group companies1 - 173 - 55 — - 53 - 114 - 232 Investments in associated companies and other shares and participations - 72 - 177 - 43 - 260 - 278 - 173 Other investments in non-current assets - 17 063 - 17 572 - 7 493 - 6 790 - 25 157 - 24 648 Total investments - 17 308 - 17 804 - 7 536 - 7 103 - 25 549 - 25 053 Divestments1 294 19 296 41 19 320 19 579 577 Changes in short-term investments1 11 012 - 34 640 - 29 706 - 27 455 - 73 051 - 27 399 Cash flow from investing activities - 6 002 - 33 148 - 37 201 - 15 238 - 79 021 - 51 875 Cash flow before financing activities 103 012 64 372 53 184 45 985 22 811 61 451 Financing activities Changes in loans to owners of non-controlling interests in foreign Group companies - 362 51 39 118 153 - 260 Loans raised2 54 749 6 536 8 282 670 51 150 99 363 Amortisation of other debt2 - 31 631 - 32 133 19 943 - 6 419 - 35 870 - 35 368 Divestment of shares in Group companies to owners of non-controlling interests — 4 016 — 4 016 4 025 9 Redemption of Hybrid Capital — - 2 941 — - 104 - 2 941 — Issue of Hybrid Capital — 6 481 — — 6 481 — Dividends paid to owners - 24 191 - 5 189 - 210 - 65 - 5 190 - 24 192 Contribution to owners of non-controlling interests - 923 - 229 - 400 — - 601 - 1 295 Contribution from owners of non-controlling interests 2 210 545 1 575 533 1 786 3 451 Cash flow from financing activities - 148 - 22 863 29 229 - 1 251 18 993 41 708 Cash flow for the period 102 864 41 509 82 413 44 734 41 804 103 159 Jan-Sep Jan-Sep Jul-Sep Jul-Sep Full year Last 12 Amounts in SEK million 2022 2021 2022 2021 2021 months Cash and cash equivalents Cash and cash equivalents at start of period 68 176 26 074 90 177 20 463 26 074 67 644 Cash and cash equivalents included in assets held for sale — — — 2 400 — — Cash flow for the period 102 864 41 509 82 413 44 734 41 804 103 159 Translation differences 2 327 61 777 47 298 2 564 Cash and cash equivalents at end of period 173 367 67 644 173 367 67 644 68 176 173 367 1) The value has been adjusted compared with information previously published in Vattenfall’s financial reports. See note 1. 2) Short-term borrowings in which the duration is three months or shorter are reported net.
  • 22. 22 VATTENFALL INTERIM REPORT JANUARY–SEPTEMBER 2022 SUPPLEMENTARY INFORMATION Jan-Sep Jan-Sep Jul-Sep Jul-Sep Full year Last 12 Amounts in SEK million 2022 2021 2022 2021 2021 months Cash flow before financing activities 103 012 64 372 53 184 45 985 22 811 61 451 Change in margin calls from Treasury operations - 1 259 - 1 518 347 - 387 - 1 700 - 1 441 Changes in short-term investments - 11 012 34 640 29 706 27 455 73 051 27 399 Financing activities Divestment of shares in Group companies to owners of non-controlling interests — 4 016 — 4 016 4 025 9 Dividends paid to owners - 24 191 - 5 189 - 210 - 65 - 5 190 - 24 192 Contribution to/from owners of non-controlling interests 1 287 316 1 175 533 1 185 2 156 Cash flow after dividend 67 837 96 637 84 202 77 537 94 182 65 382 Analysis of change in net debt Net debt at start of period 44 703 - 48 178 29 322 - 32 328 - 48 178 47 348 Cash flow after dividend 67 837 96 637 84 202 77 537 94 182 65 382 Changes as a result of valuation at fair value 2 495 803 1 223 195 660 2 352 Changes in interest-bearing liabilities for leasing - 1 052 - 997 - 191 - 390 - 1 442 - 1 497 Interest-bearing liabilities/short-term investments acquired/divested — - 2 — - 2 - 13 - 11 Cash and cash equivalents included in assets held for sale — — — 2 400 — — Interest-bearing liabilities associated with assets held for sale — — — - 106 — — Translation differences on net debt 2 025 - 915 1 452 42 - 506 2 434 Net debt at end of period 116 008 47 348 116 008 47 348 44 703 116 008 Cash flow from operating activities 109 014 97 520 90 385 61 223 101 832 113 326 Maintenance/replacement investments - 6 717 - 7 216 - 2 599 - 3 527 - 11 012 - 10 513 Free cash flow1 102 297 90 304 87 786 57 696 90 820 102 813 1) See Definitions and calculations of key ratios for definitions of Alternative Performance Measures.
  • 23. 23 VATTENFALL INTERIM REPORT JANUARY–SEPTEMBER 2022 INVESTMENTS Jan-Sep Jan-Sep Jul-Sep Jul-Sep Full year Last 12 Amounts in SEK million 2022 2021 2022 2021 2021 months Electricity generation Hydro power 452 481 203 169 795 766 Nuclear power 1 163 843 419 289 1 263 1 583 Gas 200 43 59 21 64 221 Wind power and solar PV 10 558 9 182 4 933 2 686 11 157 12 533 Biomass, waste 11 71 2 32 73 13 Total electricity generation 12 384 10 620 5 616 3 197 13 352 15 116 CHP/heat Fossil-based power 567 516 310 252 1 053 1 104 Heat networks 830 901 323 326 1 511 1 440 Other 51 161 49 55 483 373 Total CHP/heat 1 448 1 578 682 633 3 047 2 917 Electricity networks Electricity networks 3 146 3 839 1 143 953 5 758 5 065 Total electricity networks 3 146 3 839 1 143 953 5 758 5 065 Purchases of shares, shareholder contributions 245 233 43 313 400 412 Other 1 358 983 524 344 1 557 1 932 Total investments 18 581 17 253 8 008 5 440 24 114 25 442 Accrued investments, unpaid invoices (-)/release of accrued investments (+) - 1 273 551 - 472 1 663 1 443 - 381 Cash and cash equivalents in acquired companies — — — — - 8 - 8 Total investments with cash flow effect 17 308 17 804 7 536 7 103 25 549 25 053
  • 24. 24 VATTENFALL INTERIM REPORT JANUARY–SEPTEMBER 2022 Consolidated statement of changes in equity 30 Sep 2022 30 Sep 2021 31 Dec 2021 Amounts in SEK million Attributable to owner of the Parent Company Attributable to non- controlling interests Total equity Attributable to owner of the Parent Company Attributable to non- controlling interests Total equity Attributable to owner of the Parent Company Attributable to non- controlling interests Total equity Balance brought forward 180 710 16 472 197 182 97 724 13 468 111 192 97 724 13 468 111 192 Profit for the period 16 502 478 16 980 41 054 858 41 912 46 828 1 185 48 013 Cash flow hedges - changes in fair value 72 847 — 72 847 61 824 — 61 824 82 259 — 82 259 Cash flow hedges - dissolved against income statement - 76 399 — - 76 399 - 8 691 16 - 8 675 - 31 569 16 - 31 553 Cash flow hedges - transferred to cost of hedged item 4 — 4 11 — 11 16 — 16 Hedging of net investments in foreign operations - 2 013 — - 2 013 - 977 — - 977 - 1 414 — - 1 414 Translation differences - divested companies — — — 689 — 689 697 — 697 Translation differences - foreign operations 9 534 698 10 232 1 740 130 1 870 2 983 235 3 218 Remeasurement pertaining to defined benefit obligations 16 557 — 16 557 426 — 426 - 700 30 - 670 Income taxes related to other comprehensive income - 8 202 — - 8 202 - 16 349 - 3 - 16 352 - 15 185 - 9 - 15 194 Total other comprehensive income for the period 12 328 698 13 026 38 673 143 38 816 37 087 272 37 359 Total comprehensive income for the period 28 830 1 176 30 006 79 727 1 001 80 728 83 915 1 457 85 372 Dividends paid to owners - 23 414 - 777 - 24 191 - 4 000 - 1 189 - 5 189 - 4 000 - 1 190 - 5 190 Group contributions from(+)/to(-) owners of non-controlling interests — — — — — — — 51 51 Changes in ownership in Group companies on divestments of shares to owners of non- controlling interests — — — 2 532 1 504 4 036 2 538 1 508 4 046 Contribution to/from owners of non- controlling interests — 1 287 1 287 — 316 316 — 1 185 1 185 Other changes in ownership — 2 2 51 — 51 — — — Other changes 38 — 38 — — — 533 - 7 526 Total transactions with equity holders - 23 376 512 - 22 864 - 1 417 631 - 786 - 929 1 547 618 Balance carried forward 186 164 18 160 204 324 176 034 15 100 191 134 180 710 16 472 197 182 - Of which, Reserve for hedges 29 378 8 29 386 38 569 8 38 577 36 968 8 36 976
  • 25. 25 VATTENFALL INTERIM REPORT JANUARY–SEPTEMBER 2022 Key ratios, Vattenfall Group Jan-Sep Jan-Sep Jul-Sep Jul-Sep Full year Last 12 In % unless otherwise stated. (x) means times1 2022 2021 2022 2021 2021 months Operating margin 22.8 45.0 23.0 63.5 33.5 19.8 Operating margin2 14.8 18.9 11.7 13.2 17.3 14.7 Pre-tax profit margin 15.3 44.8 18.3 61.4 33.0 14.2 Pre-tax profit margin2 7.3 18.7 7.1 11.2 16.8 9.0 Return on equity3 14.8 40.2 14.8 40.2 36.9 14.8 Return on capital employed3 17.3 22.4 17.3 22.4 22.2 17.3 Return on capital employed2, 3 12.8 11.7 12.8 11.7 11.5 12.8 EBIT interest cover, (x)3 7.9 16.6 7.9 16.6 15.8 7.9 EBIT interest cover, (x)2, 3 5.9 8.7 5.9 8.7 8.3 5.9 FFO interest cover, (x)3 9.1 12.1 9.1 12.1 12.9 9.1 FFO interest cover, net, (x)3 10.2 14.5 10.2 14.5 15.9 10.2 Cash flow interest cover after maintenance investments, (x)3 20.8 33.94 20.8 33.94 27.4 20.8 FFO/gross debt3 30.0 46.0 30.0 46.0 36.5 30.0 FFO/net debt3 - 39.8 - 82.0 - 39.8 - 82.0 - 103.1 - 39.8 FFO/adjusted net debt3 n/a5 182.7 n/a5 182.7 171.2 n/a 5 EBITDA/net financial items, (x) 12.2 31.1 12.6 34.0 24.5 11.8 EBITDA/net financial items, (x)2 9.3 16.7 8.3 11.4 15.7 10.1 Equity/Total assets 18.5 27.8 18.5 27.8 25.2 18.5 Gross debt/equity 75.3 44.2 75.3 44.2 64.1 75.3 Net debt/equity - 56.8 - 24.8 - 56.8 - 24.8 - 22.7 - 56.8 Gross debt/gross debt plus equity 43.0 30.6 43.0 30.6 39.1 43.0 Net debt/net debt plus equity - 131.4 - 32.9 - 131.4 - 32.9 - 29.3 - 131.4 Net debt/EBITDA, (x)3 - 2.0 - 0.6 - 2.0 - 0.6 - 0.6 - 2.0 Adjusted net debt/EBITDA, (x)3 - 0.7 0.3 - 0.7 0.3 0.4 - 0.7 1) See Definitions and calculations of key ratios for definitions of Alternative Performance Measures. 2) Based on Underlying operating profit. 3) Last 12-month values. 4) The value has been adjusted compared with information previously published in Vattenfall’s financial reports. 5) The adjusted net debt decreased to a net asset mainly due to increased margin calls received. Excluding effects from received and paid margin calls FFO/adjusted net debt was at 41.4%.
  • 26. 26 VATTENFALL INTERIM REPORT JANUARY–SEPTEMBER 2022 Quarterly information, Vattenfall Group Q3 Q2 Q1 Q4 Q3 Q2 Q1 Amounts in SEK million 2022 2022 2022 2021 2021 2021 2021 Income statement Net sales 53 076 48 170 59 579 63 529 36 125 34 554 45 911 Operating profit before depreciation, amortisation and impairment losses (EBITDA) 16 386 15 386 17 249 10 226 27 293 20 531 17 740 Underlying EBITDA 10 820 12 660 13 970 13 452 9 149 9 577 16 408 Operating profit (EBIT) 12 192 11 730 12 783 7 750 22 926 16 210 13 385 Underlying EBIT 6 232 8 107 9 504 9 092 4 782 5 256 12 053 Profit before income taxes 9 728 6 469 8 433 7 156 22 182 16 778 13 257 Profit for the period 6 684 4 231 6 064 6 101 18 277 13 212 10 423 - of which, attributable to owner of the Parent Company 6 242 4 478 5 782 5 774 18 178 13 002 9 875 - of which, attributable to non-controlling interests 442 - 247 282 327 99 210 548 Balance sheet Capital employed 258 447 289 959 276 749 280 881 255 184 280 855 271 110 Net debt 116 008 29 321 37 611 44 703 47 348 - 32 328 - 43 865 Cash flow Funds from operations (FFO) 7 305 11 911 8 382 18 616 6 054 7 439 13 987 Cash flow from operating activities 90 385 9 776 - 3 058 4 312 1 61 223 1 23 965 1 12 331 1 Cash flow from investing activities - 37 201 12 523 18 676 - 45 872 1 - 15 238 1 - 12 782 1 - 5 128 1 Cash flow from financing activities 29 229 - 43 145 13 768 41 855 - 1 252 - 6 446 - 15 164 Cash flow for the period 82 413 - 8 935 29 386 295 44 733 4 737 - 7 961 Free cash flow 87 786 20 026 - 5 514 516 1 57 696 1 22 553 1 10 054 1 1) The value has been adjusted compared with information previously published in Vattenfall’s financial reports. Q3 Q2 Q1 Q4 Q3 Q2 Q1 In % unless otherwise stated. (x) means times1 2022 2022 2022 2021 2021 2021 2021 Key ratios Return on equity 14.8 23.5 31.0 36.9 40.2 30.3 10.0 Return on capital employed2 17.3 19.3 21.8 22.2 22.4 14.5 5.9 Return on capital employed2, 3 12.8 11.0 10.5 11.5 11.7 11.0 9.9 EBIT interest cover, (x)2 7.9 10.3 14.9 15.8 16.6 12.1 5.1 EBIT interest cover, (x)2, 3 5.9 6.0 7.3 8.3 8.7 9.3 8.6 FFO/gross debt2 30.0 36.3 28.8 36.5 46.0 44.3 40.0 FFO/net debt2 - 39.8 - 153.4 - 107.7 - 103.1 - 82.0 123.1 83.8 FFO/adjusted net debt n/a 4 103.0 120.5 171.2 182.7 38.1 32.8 Equity/Total assets 18.5 20.6 24.4 25.2 27.8 25.8 26.8 Gross debt/equity 75.3 65.6 66.7 64.1 44.2 64.2 72.0 Net debt/equity - 56.8 - 15.5 - 17.9 - 22.7 - 24.8 23.1 34.4 Net debt/net debt plus equity - 131.4 - 18.4 - 21.8 - 29.3 - 32.9 18.8 25.6 Net debt/EBITDA, (x)2 - 2.0 - 0.4 - 0.5 - 0.6 - 0.6 0.5 0.9 Adjusted net debt/EBITDA, (x)2 - 0.7 0.6 0.4 0.4 0.3 1.8 2.4 1) See Definitions and calculations of key ratios for definitions of Alternative Performance Measures. 2) Last 12-month values. 3) Based on Underlying operating profit. 4) The adjusted net debt decreased to a net asset mainly due to increased margin calls received. Excluding effects from received and paid margin calls FFO/adjusted net debt was at 41.4%.
  • 27. 27 VATTENFALL INTERIM REPORT JANUARY–SEPTEMBER 2022 NOTE 1 | Accounting policies, risks and uncertainties Accounting policies This interim report for the Group has been prepared in accordance with IAS 34 – “Interim Financial Reporting”, and the Swedish Annual Accounts Act. The accounting policies and calculation methods applied in this interim report are the same as those described in Vattenfall’s 2021 Annual and Sustainability Report in Note 3 to the consolidated accounts, Accounting policies. Amended IFRSs endorsed by the EU for application in the 2022 financial year have no significant effect on Vattenfall’s financial statements. Risks and uncertainties For a description of risks, uncertainties and risk management, please refer to Vattenfall’s 2021 Annual and Sustainability Report, pages 62-71. The developments in the energy markets effects Vattenfalls entire operation. The past nine months have seen a continuation of the high volatility and price levels observed last year in the European energy commodity markets. The situation is amplified by the Ukraine war exacerbating Europe's security of supply for natural gas. On top, current dry weather conditions and lower power plant availability are straining electricity supply in most of Europe. As a result of the high energy prices the risk of a wider economic recession increases. The sharply rising commodity prices has also caused a significant increase in the cash liquidity risk across the industry. Margining arrangements like Credit Support Annex continue to be challenging for the liquidity position of many companies. Due to the strong increase in electricity prices, counterparties have provided margin securities to Vattenfall. Conversely, if electricity prices were to fall significantly, Vattenfall would have to fund a large outflow of cash for margin securities. One of the main risks for Vattenfall are defaults by customers and counterparties caused by the continued high electricity and commodity prices. To reflect the increased risk of customer defaults due to high electricity prices, general high inflation and the expected decline in the economy the Expected Credit Losses accounted for in Vattenfall were increased. The rise in inflation also leads to increased costs, e.g. for raw materials and services which affects Vattenfall’s operating activities and investments. EU Energy Ministers met for an extraordinary Energy Council in September and discussed short- and long-term interventions to cushion the effects of the high electricity prices. Interventions that target short- term profits of electricity generation, e.g. capping revenues from electricity generation with lower marginal costs, for example from Wind, Solar, Nuclear and Hydro, or gas price caps may pose a new financial and strategic risk to Vattenfall’s portfolio. Without accompanying regulatory measures that will safeguard hedged volumes, interventions will skew the existing and expected future revenue expectation. Presentation of financial statements In the interim reports for 2022 the following amendments in the presentations were made compared to Vattenfall’s 2021 Annual and Sustainability Report: • In the balance sheet contractual assets and liabilities are divided into short- and long-term contractual assets and liabilities respectively. • In the cash flow statement acquisitions in group companies as well as divestments are shown as the net of acquisition price and cash in acquired companies and the net of sales price and cash in divested companies respectively. In addition, changes in margin calls from the treasury operations, which were previously included in short term investments in cash flow from investments as well as changes in operating liabilities, are included in Margin calls related to derivatives. Other Significant related-party transactions are described in Note 44 to the consolidated accounts in Vattenfall’s 2021 Annual and Sustainability Report. No material changes have taken place in relations or transactions with related parties since the publication. NOTE 2 | Exchange rates KEY EXCHANGE RATES APPLIED IN THE ACCOUNTS OF THE VATTENFALL GROUP Jan-Sep Jan-Sep Jul-Sep Jul-Sep Full year 2022 2021 2022 2021 2021 Average rate EUR 10.5179 10.1436 10.4670 10.1572 10.1469 DKK 1.4138 1.3639 1.4070 1.3658 1.3644 GBP 12.3961 11.7130 12.3329 11.8497 11.7820 USD 9.9185 8.4757 9.8041 8.6110 8.5687 30 Sep 30 Sep 31 Dec 2022 2021 2021 Balance sheet date rate EUR 10.8993 10.1683 10.2503 DKK 1.4657 1.3674 1.3784 GBP 12.3435 11.8163 12.1987 USD 11.1811 8.7817 9.0502
  • 28. 28 VATTENFALL INTERIM REPORT JANUARY–SEPTEMBER 2022 NOTE 3 | Financial instruments by measurement category and related effects on income For assets and liabilities with a remaining maturity less than three months (e.g., cash and bank balances, trade receivables and other receivables and trade payables and other payables), fair value is considered to be equal to the carrying amount. For other shares and participations the fair value is approximated by using cost. The carrying amounts of financial assets measured at amortised cost do not differ significantly from their fair values. The difference between carrying amounts and fair values for financial liabilities measured at amortised cost amounts to SEK -3,110 million (31 December 2021: 8,509). Financial instruments that are measured at fair value on the balance sheet are described below according to the fair value hierarchy (levels), which in IFRS 13 is defined as: Level 1: Quoted prices (unadjusted) in active markets for identical assets or liabilities. Level 2: Inputs other than quoted prices included in Level 1 that are observable for the asset or liability, either directly (that is, as prices) or indirectly (that is, derived from prices). In Level 2 Vattenfall reports mainly commodity derivatives, currency-forward contracts and interest rate swaps. Level 3: Inputs for the asset or liability that are not based on observable market data. FINANCIAL ASSETS AND LIABILITIES THAT ARE MEASURED AT FAIR VALUE ON THE BALANCE SHEET AT 30 SEPTEMBER 2022 Amounts in SEK million Level 1 Level 2 Level 3 Total Assets Share in the Swedish Nuclear Waste Fund 46 339 — — 46 339 Derivative assets — 372 284 4 003 376 287 Short-term investments, cash equivalents and other shares and participations 145 164 18 483 — 163 647 Total assets 191 503 390 767 4 003 586 273 Liabilities Derivative liabilities — 342 498 — 342 498 Total liabilities — 342 498 — 342 498 FINANCIAL ASSETS AND LIABILITIES THAT ARE MEASURED AT FAIR VALUE ON THE BALANCE SHEET AT 31 DECEMBER 2021 Amounts in SEK million Level 1 Level 2 Level 3 Total Assets Share in the Swedish Nuclear Waste Fund 52 772 — — 52 772 Derivative assets — 154 744 1 141 155 885 Short-term investments, cash equivalents and other shares and participations 116 013 11 404 — 127 417 Total assets 168 785 166 148 1 141 336 074 Liabilities Derivative liabilities — 129 818 — 129 818 Total liabilities — 129 818 — 129 818
  • 29. 29 VATTENFALL INTERIM REPORT JANUARY–SEPTEMBER 2022 NOTE 4 | Items affecting comparability Items affecting comparability include capital gains and capital losses from sale of shares and other non-current assets, impairment losses and reversed impairment losses and other material items that are of an infrequent nature. Also included here are, for trading activities, changes in the fair value of energy derivatives, which according to IFRS 9 cannot be recognised using hedge accounting and changes in the fair value of inventories. Jan-Sep Jan-Sep Jul-Sep Jul-Sep Full year Last 12 Amounts in SEK million 2022 2021 2022 2021 2021 months Items affecting comparability 12 863 30 431 5 960 18 144 29 090 11 522 - of which, capital gains 204 8 803 — 8 762 8 960 361 - of which, capital losses - 94 - 167 - 28 - 25 - 199 - 126 - of which, impairment losses - 1 — — — - 38 - 39 - of which, reversed impairment losses 1 292 — 394 — 1 922 3 214 - of which, provisions - 3 325 - 2 453 - 774 - 1 - 3 785 - 4 657 - of which, changes in the fair value of energy derivatives 13 204 10 537 7 994 7 792 8 715 11 382 - of which, changes in the fair value of inventories 1 582 1 801 - 1 627 1 645 1 313 1 094 - of which, other non-recurring items affecting comparability 1 11 910 1 - 29 12 202 293 Items affecting comparability during January-September 2022 amounted to SEK 12.9 billion, most of which pertains to changes in market value for energy derivatives and inventories (SEK 14.8 billion) and provisions in nuclear operations and Business Area Heat (SEK -3.3 billion). The reversed impairment losses relates to assets in Business Area Heat. Items affecting comparability during January-September 2021 amounted to SEK 30.4 billion, most of which pertains to compensation for closure of nuclear power in Germany and sales of related production rights (SEK 12.5 billion, reported in other non-recurring items affecting comparability), and changes in market value for energy derivatives and inventories (SEK 12.3 billion). The increase in provisions pertains to the nuclear operations (SEK -2.5 billion). Capital gains pertains mainly to the sale of Stromnetz Berlin (SEK 8.4 billion).
  • 30. 30 VATTENFALL INTERIM REPORT JANUARY–SEPTEMBER 2022 The Parent Company Vattenfall AB Accounting policies The Parent Company Vattenfall AB’s accounts are prepared in accordance with the Swedish Annual Accounts Act and recommendation RFR 2 – Accounting for Legal Entities, issued by the Swedish Financial Reporting Board. The accounting policies used in this interim report are the same as those described in Vattenfall’s 2021 Annual and Sustainability Report, Note 3 to the Parent Company accounts, Accounting policies. New accounting policies applicable from 1 January 2021 has had no significant effect on the Parent Company’s financial statements. January – September 2022 A condensed income statement and balance sheet for the Parent Company are presented below. • Net sales amounted to SEK 24,046 million (28,315). • Profit before appropriations and income taxes was SEK -54,081 million (-1,332). • The lower operating profit are mainly attributable to changes in market value for energy derivatives, for all future years’ hedges amounting to SEK -51,006 million. In addition, the Parent Company is charged with SEK -9,185 million for increased commitments for future decommissioning of Ringhals and Forsmark resulting from increased provisions for those group companies and the negative development of the share in the Swedish Nuclear Waste Fund. • The improved net financial items refers to dividends from group companies, mainly from Vattenfall GmbH. • The balance sheet total was SEK 539,464 million (31 December 2021:468,482). • Investments during the period amounted to SEK 697 million (5,443), whereof last year’s investment pertained mainly to group internal asset transactions. • Cash and cash equivalents, and short-term investments amounted to SEK 219,788 million (31 December 2021: 145,743). • Dividend paid to the owner of SEK 23,414 million (4,000). Risks and uncertainties See Note 1 to the consolidated accounts, Accounting policies, risks and uncertainties. Other The owners to the Swedish nuclear companies are required to provide security to the Swedish state as a guarantee that sufficient funds exist to cover the future costs of nuclear waste management. The security is provided in the form of guarantee commitments from the owners of the nuclear power companies and includes both financial and supplementary security. The state has during the first six month during 2022 decided to increase the levels of the security. The effect for Vattenfall AB will be an increase of 14,7 billion SEK. Significant related-party transactions are described in Note 44 to the consolidated accounts, Related party disclosures, in Vattenfall’s 2021 Annual and Sustainability Report. No material changes have taken place in relations or transactions with related parties compared with the description in Vattenfall’s 2021 Annual and Sustainability Report.
  • 31. 31 VATTENFALL INTERIM REPORT JANUARY–SEPTEMBER 2022 Parent Company income statement Jan-Sep Jan-Sep Full year Last 12 Amounts in SEK million 2022 2021 2021 months Net sales 24 046 28 315 40 045 35 776 Cost of purchases related to production - 83 984 - 26 240 - 37 035 - 94 779 Other external expenses - 3 792 - 3 317 - 5 250 - 5 725 Personnel expenses - 2 368 - 1 644 - 2 247 - 2 971 Other operating incomes and expenses, net 17 339 - 52 - 374 Operating profit before depreciation, amortisation and impairment losses (EBITDA) - 66 081 - 2 547 - 4 539 - 68 073 Depreciation, amortisation and impairments - 504 - 473 - 629 - 660 Operating profit (EBIT) - 66 585 - 3 020 - 5 168 - 68 733 Result from participations in subsidiaries 15 772 2 232 2 231 15 771 Result from participations in associated companies - 61 1 1 - 61 Other financial income 1 201 1 237 1 537 1 501 Other financial expenses - 4 408 - 1 782 - 2 820 - 5 446 Profit before appropriations and income taxes - 54 081 - 1 332 - 4 219 - 56 968 Appropriations 4 840 1 057 5 086 8 869 Profit before income taxes - 49 241 - 275 867 - 48 099 Income taxes 12 820 489 445 12 776 Profit for the period - 36 421 214 1 312 - 35 323
  • 32. 32 VATTENFALL INTERIM REPORT JANUARY–SEPTEMBER 2022 Parent Company balance sheet 30 Sep 30 Sep 31 Dec Amounts in SEK million 2022 2021 2021 Assets Non-current assets Intangible assets: non-current 323 333 330 Property, plant and equipment 6 937 6 647 7 003 Shares and participations 166 993 166 449 166 802 Deferred tax assets 15 116 1 948 2 272 Other non-current receivables group 66 537 64 030 65 553 Other non-current receivables 4 277 4 681 5 570 Total non-current assets 260 183 244 088 247 530 Current assets Inventories 371 386 342 Intangible assets: current 18 7 9 Current receivables group 10 223 10 925 59 366 Current receivables 48 203 10 953 13 791 Current tax assets 678 168 1 701 Short-term investments 95 140 62 975 101 877 Cash and cash equivalents 124 648 56 046 43 866 Total current assets 279 281 141 460 220 952 Total assets 539 464 385 548 468 482 Equity, provisions and liabilities Equity Restricted equity Share capital (131,700,000 shares with a share quota value of SEK 50) 6 585 6 585 6 585 Revaluation reserve 37 989 37 989 37 989 Other reserves 1 365 1 357 1 370 Non-restricted equity Retained earnings 42 814 66 200 64 911 Profit for the period - 36 421 214 1 312 Total equity 52 332 112 345 112 167 Untaxed reserves 2 328 12 285 7 168 Provisions 6 042 5 072 5 621 Non-current liabilities Hybrid capital 21 960 20 135 20 421 Other interest-bearing liabilities group 222 8 1 573 Other interest-bearing liabilities 50 364 37 505 37 902 Other noninterest-bearing liabilities group 12 590 12 488 12 590 Other noninterest-bearing liabilities 9 456 273 279 Total non-current liabilities 94 592 70 409 72 765 Current liabilities Other interest-bearing liabilities group 243 134 160 187 197 355 Other interest-bearing liabilities 77 013 13 768 54 960 Current tax liabilities — 2 — Other noninterest-bearing liabilities group 2 123 1 298 4 521 Other noninterest-bearing liabilities 61 900 10 182 13 925 Total current liabilities 384 170 185 437 270 761 Total equity, provisions and liabilities 539 464 385 548 468 482
  • 33. 33 VATTENFALL INTERIM REPORT JANUARY–SEPTEMBER 2022 Definitions and calculations of key ratios Alternative Performance Measures In order to ensure a fair presentation of the Group’s operations, the Vattenfall Group uses a number of Alternative Performance Measures that are not defined in IFRS or in the Swedish Annual Accounts Act. The Alternative Performance Measures that Vattenfall uses are described below, including their definitions and how they are calculated. The Alternative Performance Measures used are unchanged compared with earlier periods. Definition EBIT: Operating profit (Earnings Before Interest and Tax) EBITDA: Operating profit before depreciation, amortisation and impairment losses (Earnings Before Interest, Tax, Depreciation and Amortisation) Items affecting comparability: Capital gains and capital losses from shares and other non-current assets, impairment losses and reversed impairment losses and other material items that are of an infrequent nature. Also included here are, for trading activities, changes in the fair value of energy derivatives, which according to IFRS 9 cannot be recognised using hedge accounting and changes in the fair value of inventories. See Consolidated income statement for a specification of items affecting comparability. Underlying EBITDA: Underlying operating profit before depreciation, amortisation and impairment losses. This measure is intended to provide a better view on the operating result by excluding items affecting comparability that are of an infrequent nature, while also excluding non-cash depreciation and amortisation. Underlying operating profit: Operating profit (EBIT) excluding items affecting comparability. This measure is intended to provide a better view on the operating result by excluding items affecting comparability that are of an infrequent nature. FFO: Funds From Operations, see Consolidated statement of cash flow Free cash flow: Cash flow from operating activities less maintenance investments Interest-bearing liabilities See Consolidated balance sheet - Supplementary Information Net debt: See Consolidated balance sheet - Supplementary Information Adjusted net debt: See Consolidated balance sheet - Supplementary Information Capital employed: Total assets less financial assets, noninterest-bearing liabilities and certain other interest-bearing provisions not included in adjusted net debt. see Consolidated balance sheet - Supplementary Information Other definitions Definition Hybrid Capital: Perpetual subordinated securities, junior to all Vattenfall’s unsubordinated debt instruments. LTIF: Lost Time Injury Frequency (LTIF) is expressed in terms of the number of lost time work injuries (per 1 million hours worked), i.e., work-related accidents resulting in absence longer than one day, and accidents resulting in fatality. CALCULATION OF EBITDA, UNDERLYING EBITDA AND UNDERLYING EBIT Jan-Sep Jan-Sep Jul-Sep Jul-Sep Full year Last 12 Amounts in SEK million 2022 2021 2022 2021 2021 months Operating profit (EBIT) 36 707 52 521 12 192 22 926 60 271 44 457 Depreciation, amortisation and impairment losses - 12 316 - 13 044 - 4 194 - 4 367 - 15 519 - 14 791 Operating profit before depreciation, amortisation and impairment losses (EBITDA) 49 023 65 565 16 386 27 293 75 790 59 248 Items affecting comparability excl. impairment losses and reversed impairment losses - 11 572 - 30 431 - 5 566 - 18 144 - 27 206 - 8 347 Underlying operating profit before depreciation, amortisation and impairment losses 37 451 35 134 10 820 9 149 48 584 50 901 Operating profit (EBIT) 36 707 52 521 12 192 22 926 60 271 44 457 Items affecting comparability - 12 863 - 30 431 - 5 960 - 18 144 - 29 090 - 11 522 Underlying operating profit 23 844 22 090 6 232 4 782 31 181 32 935
  • 34. 34 VATTENFALL INTERIM REPORT JANUARY–SEPTEMBER 2022 The key ratios are presented as percentages (%) or times (x). KEY RATIOS BASED ON LAST 12-MONTH VALUES OCTOBER 2021 – SEPTEMBER 2022: Operating margin, % = 100 x EBIT 44 457 = 19.8 Net sales 224 354 Operating margin excl. items = 100 x Underlying EBIT 32 935 = 14.7 affecting comparability, % Net sales 224 354 Pre-tax profit margin, % = 100 x Profit before income taxes 31 789 = 14.2 Net sales 224 354 Pre-tax profit margin excl. items = 100 x Profit before income taxes excl. items affecting comparability 20 267 = 9.0 affecting comparability, % Net sales 224 354 Return on equity, % = 100 x Profit for the period attributable to owner of the Parent Company 22 276 = 14.8 Average equity for the period attributable to owner of the 150 124 Parent Company excl. the Reserve for cash flow hedges Return on capital employed, % = 100 x EBIT 44 457 = 17.3 Capital employed, average 256 816 Return on capital employed excl. = 100 x Underlying EBIT 32 935 = 12.8 items affecting comparability, % Capital employed, average 256 816 EBIT interest cover, (x) = EBIT + financial income 45 176 = 7.9 Financial expenses excl. discounting effects attributable to 5 735 provisions EBIT interest cover excl. Items = Underlying EBIT + financial income 33 654 = 5.9 affecting comparability, (x) Financial expenses excl. discounting effects attributable to 5 735 provisions FFO + financial expenses excl. FFO interest cover, (x) = discounting effects attributable to provisions 51 949 = 9.1 Financial expenses excl. discounting effects attributable to 5 735 provisions FFO + financial items net excl. discounting effects attributable FFO interest cover, net, (x) = to provisions and return from the Swedish Nuclear Waste Fund 51 230 = 10.2 Financial items net excl. discounting effects attributable to 5 016 provisions and return from the Swedish Nuclear Waste Fund
  • 35. 35 VATTENFALL INTERIM REPORT JANUARY–SEPTEMBER 2022 Cash flow from operating activities less maintenance investments + financial expenses excl. Discounting Cash flow interest cover after = effects attributable to provisions and interest components related to pension costs 108 006 = 20.8 maintenance investments, (x) Financial expenses excl. discounting effects attributable to 5 193 provisions and interest components related to pension costs FFO/gross debt, % = 100 x FFO 46 214 = 30.0 Interest-bearing liabilities 153 931 FFO/net debt, % = 100 x FFO 46 214 = -39.8 Net debt -116 008 FFO/adjusted net debt, % 1 = 100 x FFO 46 214 = -104.7 Adjusted net debt -44 123 FFO/adjusted net debt excl. margin calls, % = 100 x FFO 46 214 = 41.4 Adjusted net debt excl. margin calls 111 525 EBITDA/net financial = EBITDA 59 248 = 11.8 items, (x) Financial items net excl. discounting effects attributable to 5 016 provisions and return from the Swedish Nuclear Waste Fund EBITDA excl. items affecting = EBITDA excl. items affecting comparability 50 901 = 10.1 comparability/net financial Financial items net excl. discounting effects attributable to 5 016 items, (x) provisions and return from the Swedish Nuclear Waste Fund KEY RATIOS BASED ON THE BALANCE SHEET PER 30 SEPTEMBER 2022: Equity/total assets, % = 100 x Equity 204 324 = 18.5 Balance sheet total 1102 489 Gross debt/equity, % = 100 x Interest-bearing liabilities 153 931 = 75.3 Equity 204 324 Net debt/equity, % = 100 x Net debt -116 008 = -56.8 Equity 204 324 Gross debt/gross debt = 100 x Interest-bearing liabilities 153 931 = 43.0 equity, % Interest-bearing liabilities + equity 358 255 Net debt/net debt plus = 100 x Net debt -116 008 = -131.4 equity, % Net debt + equity 88 316 Net debt/EBITDA, (x) = Net debt -116 008 = -2.0 EBITDA 59 248 Adjusted net debt/ = Adjusted net debt -44 123 = -0.7 EBITDA, (x) EBITDA 59 248 1) The adjusted net debt decreased to a net asset mainly due to increased margin calls received. Excluding effects from received and paid margin calls FFO/adjusted net debt was at 41.4%.
  • 36. 36 VATTENFALL INTERIM REPORT JANUARY–SEPTEMBER 2022 The information was submitted for publication, through the agency of the contact persons set out above, at 08.00 CEST on 27 October 2022. This report has been prepared in both Swedish and English versions. In the event of discrepancies between the two versions, the Swedish version shall govern. Interim report signature Solna, 27 October 2022 Anna Borg President and CEO This interim report has not been reviewed by the company’s auditor. Financial calendar Year-end report 2022, 8 February 2023 Annual General Meeting, 26 April 2023 Interim report January-March, 27 April 2023 Interim report January-June, 20 July 2023 Interim report January-September, 26 October 2023 Contact information Vattenfall AB (publ) SE-169 92 Stockholm Corporate identity number 556036-2138 T +46-8-739 50 00 www.vattenfall.com www.vattenfall.se Anna Borg President and CEO T +46-8-739 50 09 Kerstin Ahlfont CFO T +46-8-739 64 28 Ruben van Bavel Acting Head of Group Control & Investor Relations T +31 650 126 296 Vattenfall’s press office T +46-8-739 50 10 press@vattenfall.com