Q3 2019: Interim report January-September
•
0 gefällt mir•272 views

Vattenfall's third quarter 2019: Interim report January-September

Empfohlen
Weitere ähnliche Inhalte
Was ist angesagt?
Was ist angesagt? (20)
Ähnlich wie Q3 2019: Interim report January-September
Ähnlich wie Q3 2019: Interim report January-September (11)
Mehr von Vattenfall
Mehr von Vattenfall (15)
Kürzlich hochgeladen
Kürzlich hochgeladen (20)
Q3 2019: Interim report January-September
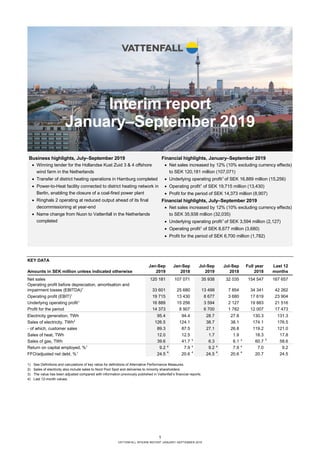
- 1. 1 VATTENFALL INTERIM REPORT JANUARY–SEPTEMBER 2019 Interim report January–September 2019 KEY DATA Jan-Sep Jan-Sep Jul-Sep Jul-Sep Full year Last 12 Amounts in SEK million unless indicated otherwise 2019 2018 2019 2018 2018 months Net sales 120 181 107 071 35 938 32 035 154 547 167 657 Operating profit before depreciation, amortisation and impairment losses (EBITDA)1 33 601 25 680 13 499 7 854 34 341 42 262 Operating profit (EBIT)1 19 715 13 430 8 677 3 680 17 619 23 904 Underlying operating profit1 16 889 15 256 3 594 2 127 19 883 21 516 Profit for the period 14 373 8 907 6 700 1 782 12 007 17 473 Electricity generation, TWh 95.4 94.4 28.7 27.8 130.3 131.3 Sales of electricity, TWh2 126.5 124.1 38.7 38.1 174.1 176.5 - of which, customer sales 89.3 87.5 27.1 26.8 119.2 121.0 Sales of heat, TWh 12.0 12.5 1.7 1.9 18.3 17.8 Sales of gas, TWh 39.6 41.7 3 6.3 6.1 3 60.7 3 58.6 Return on capital employed, %1 9.2 4 7.9 4 9.2 4 7.9 4 7.0 9.2 FFO/adjusted net debt, %1 24.5 4 20.6 4 24.5 4 20.6 4 20.7 24.5 1) See Definitions and calculations of key ratios for definitions of Alternative Performance Measures. 2) Sales of electricity also include sales to Nord Pool Spot and deliveries to minority shareholders. 3) The value has been adjusted compared with information previously published in Vattenfall’s financial reports. 4) Last 12-month values. Business highlights, July–September 2019 • Winning tender for the Hollandse Kust Zuid 3 & 4 offshore wind farm in the Netherlands • Transfer of district heating operations in Hamburg completed • Power-to-Heat facility connected to district heating network in Berlin, enabling the closure of a coal-fired power plant • Ringhals 2 operating at reduced output ahead of its final decommissioning at year-end • Name change from Nuon to Vattenfall in the Netherlands completed Financial highlights, January–September 2019 • Net sales increased by 12% (10% excluding currency effects) to SEK 120,181 million (107,071) • Underlying operating profit1 of SEK 16,889 million (15,256) • Operating profit1 of SEK 19,715 million (13,430) • Profit for the period of SEK 14,373 million (8,907) Financial highlights, July–September 2019 • Net sales increased by 12% (10% excluding currency effects) to SEK 35,938 million (32,035) • Underlying operating profit1 of SEK 3,594 million (2,127) • Operating profit1 of SEK 8,677 million (3,680) • Profit for the period of SEK 6,700 million (1,782)
- 2. 2 VATTENFALL INTERIM REPORT JANUARY–SEPTEMBER 2019 CEO’s comments Strategically and financially, Vattenfall is developing in the right direction. At the close of the third quarter we can report a clear improvement in our financial key ratios. We have also made important progress in a number of areas with the phase- out of coal, growth in renewables and implementation of new solutions to enable the shift to a fossil-free future. Profit for the third quarter grew SEK 4.9 billion to SEK 7.8 billion. For the first nine months of the year, profit for the period increased by SEK 5.5 billion to SEK 14.4 billion. The large increase is mainly attributable to two non-recurring items during the third quarter: a capital gain of SEK 3.1 billion from the divestment of the district heating operations in Hamburg, and the sale of production rights for German nuclear power for SEK 1.5 billion. The underlying operating result for the third quarter increased by SEK 1.5 billion to SEK 3.6 billion. We saw positive development in the underlying operations with important contributions from higher achieved prices and a growing wind power portfolio. Despite a challenging start to the year with the storm “Alfrida”, we have thus seen an earnings improvement for the nine-month period. The underlying operating profit increased by SEK 1.6 billion to SEK 16.9 billion. Ringhals 2 is planned to be closed at year-end and is therefore being gradually run at lower output since September. A generator replacement affected production at the start of the year, but on the whole both our nuclear and hydro power delivered favourable results with high availability. The price of electricity has decreased during the year, partly in pace with a return of the hydrological balance to more normal levels. However, price hedges contributed to higher achieved prices and an increase in the underlying operating profit for Power Generation by SEK 2.8 billion to SEK 11.3 billion for the nine- month period. Vattenfall’s sales are growing in most markets. However, a number of temporary factors had a negative earnings effect for Customers & Solutions during the nine-month period. This pertains mainly to growth initiatives, lower sales of gas due to warmer weather, and higher purchasing prices for electricity in Germany. The underlying operating profit for the operations decreased by SEK 0.6 billion to SEK 0.6 billion. Wind power is increasingly significant for Vattenfall’s earnings performance and makes up a growing share of the Group’s total earnings. For the first nine months of the year we saw a SEK 0.6 billion increase in the underlying operating profit for Wind, which totalled SEK 2.5 billion. More capacity and higher generation as a result of stronger winds made positive contributions. In offshore wind power, our winning tender for Hollandse Kust Zuid 3 & 4 (~750 MW) marked a momentous milestone at the start of the quarter. The transaction for the repurchase of the district heating operations in Hamburg was concluded on 2 September, resulting in a capital gain of SEK 3.1 billion. This was because the city decided to exercise its option to take over Vattenfall’s previous 74.9% stake. Hamburg continues to be an important city for Vattenfall, where among other things we are growing in decentralised energy solutions. It is also the location from which we run our continental wind and trading operations. Together with the City of Berlin we have conducted a feasibility study that shows that an exit from coal in Berlin by 2030 is feasible. The shift of Vattenfall’s district heating operations in the city is the decisive factor for this exit. As of 1 October, a coal-fired plant was shut down, and we have now connected Europe’s largest Power-to-Heat facility (120 MWth) to the district heating network. With this solution we will be able to generate heat from excess electricity generated by renewable energy sources. The heat operations reported a slight earnings improvement for the first nine months of the year. However, the underlying operating profit of SEK 0.3 billion remains at a low level owing to margin pressure for coal-fired power generation. This situation has been partly compensated by higher heat prices and better margins for our gas-fired power plants. Development in the Distribution business during the quarter was stable, but for the nine-month period we reported an operating profit of SEK 3.5 billion, which is SEK 1.1 billion lower than the same period in 2018, mainly owing to the storm “Alfrida”. In the distribution operations, hard work is being conducted to manage growth and a growing need for capacity. As an example, we are planning significant investments in the Stockholm region in the years ahead. It is therefore particularly discouraging to find that our revenue frames for 2020-2023 will mean reduced scope for investments whilst also hampering our ability to meet the energy transition in Sweden. HYBRIT, our partnership for fossil-free steel together with SSAB and LKAB, is developing positively. The timetable for a finished pilot plant has been pushed up by three years to 2025, and decisions have been made on investment and location of a hydrogen gas storage facility in Luleå, Sweden. In connection with the UN Climate Action Week in New York in September, HYBRIT was highlighted as one of the most ambitious initiatives for tackling climate change. In early October the name change of Nuon to Vattenfall was completed in the Netherlands, which is an important growth market for us. This change is a natural step in uniting the company’s vision under one and the same brand. Vattenfall is built upon a clear goal – to enable our customers to live a life free from fossil fuels within one generation. Magnus Hall President and CEO Power Generation and Wind contributed to marked improvements in results and delivery on financial targets
- 3. 3 VATTENFALL INTERIM REPORT JANUARY–SEPTEMBER 2019 Group overview Customer sales development Sales of electricity, excluding sales to Nord Pool Spot and deliveries to minority shareholders, increased by 1.8 TWh to 89.3 TWh (87.5), mainly owing to higher sales in Germany. Sales of gas decreased by 2.1 TWh to 39.6 TWh (41.7) as a result of warmer weather in the Netherlands and Germany. Sales of heat decreased by 0.5 TWh to 12.0 TWh (12.5). CUSTOMER SALES (TWh) Generation development Total electricity generation increased by 1.0 TWh to 95.4 TWh (94.4) during the period January–September 2019. Higher wind and fossil-based power generation (+1.9 TWh) was countered by lower hydro and nuclear power generation (-1.7 TWh). ELECTRICITY GENERATION (TWh) Price development Average Nordic spot prices were 31% lower, at EUR 34.7/MWh (50.5) during the third quarter of 2019 compared with the corresponding period in 2018, mainly owing to a strong hydrological balance and lower fuel prices. Spot prices in Germany were 30% lower at EUR 37.4/MWh (53.5), and prices in the Netherlands decreased by 35% to EUR 37.9/MWh (58.1). Prices in Germany and the Netherlands were mainly affected by lower fuel prices. Electricity futures prices for delivery in 2020 and 2021 were 5%–14% higher than in the third quarter of 2018, mainly owing to higher prices for CO2 emission allowances. Compared with the third quarter of 2018, the average spot price for gas was 58% lower, at EUR 10.2/MWh (24.6). The spot price for coal was 42% lower at USD 57.6/t (99.5). The futures price for gas was 21% lower at EUR 17.9/MWh (22.6), and the futures price for coal was 27% lower at USD 66.7/t (90.9). The price of CO2 emission allowances was 43% higher, at EUR 26.9/t (18.9). The higher price of CO2 emission allowances is partly attributable to the Market Stability Reserve (MSR), which took effect in January 2019 to manage the surplus of CO2 emission allowances in the market. AVERAGE INDICATIVE NORDIC HEDGE PRICES (SE, DK, FI)1 AS PER 30 SEPTEMBER 2019, EUR/MWh 2019 2020 2021 29 32 33 VATTENFALL’S ESTIMATED NORDIC HEDGE RATIO (SE, DK, FI) AS PER 30 SEPTEMBER 2019 (%) ACHIEVED NORDIC ELECTRICITY PRICES (SE, DK, FI)2 EUR/MWh SENSITIVITY ANALYSIS – CONTINENTAL PORTFOLIO (DE, NL, UK) +/-10% price impact on future profit before tax, SEK million3 Market- quoted 2020 2021 2022 Observed yearly volatility4 Electricity +/- 1,728 +/- 1,766 +/- 1,757 19%-26% Coal -/+ 185 -/+ 173 -/+ 166 21%-23% Gas -/+ 864 -/+ 818 -/+ 884 19%-25% CO2 -/+ 451 -/+ 464 -/+ 437 47%-52% 1) Vattenfall has stopped its price hedging activity on the Continent as a result of changed risk exposure following the divestment of the German lignite operations. 2) Achieved prices from the spot market and hedges. Includes Nordic hydro, nuclear and wind power generation 3) The denotation +/- entails that a higher price affects operating profit favourably, and -/+ vice versa 4) Observed yearly volatility for daily price movements for each commodity, based on forward contracts. Volatility normally decreases the further ahead in time the contracts pertain to. Jan-Sep 2019 Jan-Sep 2018 Jul-Sep 2019 Jul-Sep 2018 Full year 2018 Last 12 months 32 29 29 28 30 31 0 20 40 60 80 100 Electricity Gas Heat Jan-Sep 2018 Jan-Sep 2019 0 10 20 30 40 50 Fossil Nuclear Hydro Wind Biomass, waste Jan-Sep 2018 Jan-Sep 2019 69 55 38 0 20 40 60 80 2019 2020 2021
- 4. 4 VATTENFALL INTERIM REPORT JANUARY–SEPTEMBER 2019 Net sales Comment January–September: Consolidated net sales increased by SEK 13.1 billion (of which, positive currency effects of SEK 2.4 billion). The increase is mainly attributable to higher achieved prices, higher sales in the Nordic countries, Germany and the Netherlands, and higher generation in the Wind operating segment. Comment July–September: Consolidated net sales increased by SEK 3.9 billion (of which, positive currency effects of SEK 0.7 billion). The increase is mainly attributable to higher achieved prices, higher sales in Germany, and higher generation in the Wind operating segment. Earnings Comment January–September: The underlying operating profit increased by SEK 1.6 billion, which is explained by: • Higher earnings contribution from the Power Generation operating segment (SEK 2.8 billion), mainly owing to higher achieved prices. • Higher earnings contribution from the Wind operating segment (SEK 0.6 billion), owing to growth of the portfolio. • Lower earnings contribution from the Distribution operating segment (SEK -1.1 billion), mainly owing to costs related to the storm “Alfrida”, a slightly lower gross margin and higher depreciation. • Lower earnings contribution from the Customers & Solutions operating segment (SEK -0.6 billion) resulting from growth activities and lower sales of gas in the Netherlands. • Other items, net (SEK -0.1 billion). Items affecting comparability amounted to SEK 2.8 billion (-1.8), of which most pertained to the capital gain on the divestment of the district heating operations in Hamburg (SEK 3.1 billion) and the sale of nuclear production rights in Germany (SEK 1.5 billion). Provisions (SEK -0.5 billion) pertain mainly to a changed discount rate for Germany. Profit for the period was SEK 14.4 billion (8.9). Comment July–September: The underlying operating profit increased by SEK 1.5 billion. The Power Generation operating segment made a positive contribution (SEK 0.8 billion), mainly owing to higher achieved prices. The Distribution and Wind operating segments also made positive contributions (SEK 0.1 billion and SEK 0.4 billion, respectively). Items affecting comparability amounted to SEK 5.1 billion (1.6), which is mainly attributable to the divestment of the district heating operations in Hamburg (SEK 3.1 billion) and the sale of nuclear production rights in Germany (SEK 1.5 billion). Profit for the period was SEK 6.7 billion (1.8). Cash flow Comment January–September: Funds from operations (FFO) increased by SEK 7.4 billion, mainly owing to lower paid tax and a higher operating profit before depreciation, amortisation and impairment losses (EBITDA). Cash flow from changes in working capital amounted to SEK -11.7 billion. The net change in margin call (SEK -13.1 billion) was the main contributing factor. The net change in operating receivables and operating liabilities in Customers & Solutions and Heat made a positive contribution (SEK 3.2 billion), while changes related to CO2 emission allowances had a negative effect on cash flow (SEK - 1.9 billion). Comment July–September: Funds from operations (FFO) increased by SEK 4.3 billion, mainly owing to a higher operating profit before depreciation, amortisation and impairment losses (EBITDA) and lower paid tax. Cash flow from changes in working capital amounted to SEK 6.0 billion. The net change in operating receivables and operating liabilities resulting from seasonal effects in the Customers & Solutions and Heat operating segments had a positive effect on cash flow (SEK 4.5 billion). The decrease in inventories (SEK 0.7 billion) and changes related to CO2 emission allowances (SEK 0.8 billion) also had a positive effect, while net changes in margin calls made a negative contribution (SEK -2.1 billion). Important events after the balance sheet date • The Energy Markets Inspectorate issued its decision on the new revenue frames for the coming regulatory period (2020– 2023), with an allowed return (WACC) of 2.16% for Vattenfall’s electricity distribution operations. KEY FIGURES – GROUP OVERVIEW Jan-Sep Jan-Sep Jul-Sep Jul-Sep Full year Last 12 Amounts in SEK million 2019 2018 2019 2018 2018 months Net sales 120 181 107 071 35 938 32 035 154 547 167 657 Operating profit before depreciation, amortisation and impairment losses (EBITDA)1 33 601 25 680 13 499 7 854 34 341 42 262 Operating profit (EBIT)1 19 715 13 430 8 677 3 680 17 619 23 904 Underlying operating profit1 16 889 15 256 3 594 2 127 19 883 21 516 Items affecting comparability1 2 826 - 1 826 5 083 1 553 - 2 264 2 388 Profit for the period 14 373 8 907 6 700 1 782 12 007 17 473 Funds from operations (FFO)1 23 429 16 010 7 583 3 246 23 275 30 694 Cash flow from changes in operating assets and operating liabilities (working capital) - 11 700 19 279 6 026 15 570 17 779 - 13 200 Cash flow from operating activities 11 729 35 289 13 609 18 816 41 054 17 494 1) See Definitions and calculations of key ratios for definitions of Alternative Performance Measures.
- 5. 5 VATTENFALL INTERIM REPORT JANUARY–SEPTEMBER 2019 Capital structure Cash and cash equivalents, and short-term investments decreased by SEK 6.1 billion compared with the level at 31 December 2018. Committed credit facilities consist of a EUR 2.0 billion Revolving Credit Facility that expires on 10 December 2021. As per 30 September 2019, available liquid assets and/or committed credit facilities amounted to 30% of net sales. Vattenfall’s target is to maintain a level of no less than 10% of consolidated net sales, but at least the equivalent of the next 90 days’ maturities. Net debt increased by SEK 11.9 billion compared with the level at 31 December 2018. This is mainly attributable to an increase in interest-bearing liabilities (SEK 5.5 billion), which includes implementation of IFRS 16 Leases (SEK 4.6 billion), dividends (SEK 3.4 billion) and exchange rate effects (SEK 2.6 billion). Adjusted net debt increased by SEK 13.0 billion compared with the level at 31 December 2018. The increase is mainly related to the higher level of net debt and higher provisions (SEK 6.8 billion), partly countered by the effect of the transfer of Heat Hamburg (SEK 7.2 billion). NET DEBT ADJUSTED NET DEBT Strategic objectives Vattenfall’s goal is to offer all customers climate-smart solutions and enable a life free from fossil fuels within one generation. The strategy is built upon four strategic objectives. Vattenfall will be 1. Leading towards Sustainable Consumption (increase customer centricity, develop the brand and build a sizeable position in decentralised energy solutions) and 2. Leading towards Sustainable Production (grow in renewables and implement our CO2 roadmap). To achieve this, we must have 3. High Performing Operations (reduce costs and improve operational efficiency) and 4. Empowered and Engaged People (develop culture and competence). Strategic focus area Targets for 2020 Q3 2019 Full Year 2018 Leading towards Sustainable Consumption 1. Customer engagement, Net Promoter Score relative to peers1 (NPS relative): +2 -1 +1 Leading towards Sustainable Production 2. Aggregated commissioned new renewables capacity 2016-2020: ≥2,300 MW 3. Absolute CO2 emissions pro rata: ≤21 Mt 1,162 MW 12.9 Mt2 752 MW 22.0 Mt High Performing Operations 4. Return On Capital Employed (ROCE), last 12 months: ≥8% 9.2% 7.0% Empowered and Engaged People 5. Lost Time Injury Frequency (LTIF): ≤1.25 6. Employee Engagement Index3 : ≥70% 2.2 - 1.9 64% 1) The target is a positive NPS in absolute terms and +2 compared to Vattenfall’s peer competitors to be achieved by 2020. 2) Excluding the heat operations in Hamburg, which has been sold and where emissions amounted to 1.3 Mt during the period January-September. Consolidated values for the period January-September. Consolidated emissions are approximately 0.1 Mt higher on an annual basis than pro rata, corresponding to Vattenfall’s share of ownership. 3) Documentation for measurement of target achievement us derived from the results of an employee survey, which is conducted on an annual basis. 0 30 60 90 120 0 30 000 60 000 90 000 120 000 Q2 2018 Q3 2018 Q4 2018 Q1 2019 Q2 2019 Q3 2019 %MSEK Interest-bearing liabilities, MSEK Net debt, MSEK Gross debt/equity, % Net debt/equity, % 0 5 10 15 20 25 30 0 30 000 60 000 90 000 120 000 150 000 Q2 2018 Q3 2018 Q4 2018 Q1 2019 Q2 2019 Q3 2019 %MSEK Adjusted net debt, MSEK FFO/adjusted net debt, %
- 6. 6 VATTENFALL INTERIM REPORT JANUARY–SEPTEMBER 2019 Operating segments Jan-Sep Jan-Sep Jul-Sep Jul-Sep Full year Last 12 Amounts in SEK million 2019 2018 2019 2018 2018 months Underlying operating profit Customers & Solutions 594 1 159 86 - 54 1 269 704 Power Generation 11 252 8 475 2 833 1 988 9 371 12 148 - of which, trading 779 621 - 165 418 581 739 Wind 2 474 1 902 623 264 3 747 4 319 Heat 318 260 - 768 - 765 771 829 Distribution 3 454 4 530 1 190 1 096 6 250 5 174 - of which, Distribution Germany 851 651 350 199 985 1 185 - of which, Distribution Sweden 2 591 3 859 840 891 5 254 3 986 Other1 - 995 - 910 - 343 - 356 - 1 528 - 1 613 Eliminations - 208 - 160 - 27 - 46 3 - 45 Underlying operating profit 16 889 15 256 3 594 2 127 19 883 21 516 1) “Other” pertains mainly to all Staff functions, including Treasury and Shared Service Centres. Customers & Solutions Power Generation – Generation Power Generation – Markets Wind Heat Distribution
- 7. 7 VATTENFALL INTERIM REPORT JANUARY–SEPTEMBER 2019 Customers & Solutions The Customers & Solutions Business Area is responsible for sales of electricity, gas and energy services in all of Vattenfall’s markets. Positive sales development during the third quarter • Largest earnings contributions from Germany and the Netherlands • Completion of name change from Nuon to Vattenfall in the Netherlands • Agreement with Norwegian dairy company TINE on e- vehicle charging solutions Q1–Q3: Net sales increased as a result of higher sales in most of Vattenfall’s markets. Higher volumes and a larger customer base in Germany, positive price effects in the Nordic countries and currency effects made positive contributions. In the Netherlands, net sales increased as a result of positive price effects. This was partly countered by lower sales of gas as a result of warmer weather. The underlying operating profit decreased mainly due to costs for growth activities and the lower sales of gas, with an effect of approximately SEK 200 million each. Earnings were also negatively affected by approximately SEK 100 million in higher costs for electricity purchases in Germany, but this will be compensated by tariff increases. Compared with year-end 2018, the total customer base grew from 8.9 million to 9.4 million contracts. The increase is mainly attributable to a larger customer base in Germany and the acquisition of DELTA Energie in the Netherlands. Q3: Net sales increased mainly as a result of positive price effects and higher volumes in Germany. Positive price effects in the B2C market in the Netherlands also contributed. The underlying operating profit increased mainly as a result of higher sales in Germany. During the quarter, the name change of the Dutch subsidiary Nuon was completed. As of October, the Nuon brand has been changed to Vattenfall also in the B2C market. In Norway Vattenfall has entered into a five-year agreement with the dairy company TINE. Through the connection of 200 charging points Vattenfall InCharge will deliver fossil-free charging of electric vehicles for TINE’s employees, customers and visitors. KEY FIGURES – CUSTOMERS & SOLUTIONS Jan-Sep Jan-Sep Jul-Sep Jul-Sep Full year Last 12 Amounts in SEK million unless indicated otherwise 2019 2018 2019 2018 2018 months Net sales 64 086 57 790 17 998 16 146 81 318 87 614 External net sales 62 264 56 125 17 519 15 576 78 883 85 022 Underlying operating profit before depreciation, amortisation and impairment losses 1 842 2 177 528 308 2 663 2 328 Underlying operating profit 594 1 159 86 - 54 1 269 704 Sales of electricity, TWh 66.6 64.8 20.7 19.4 88.3 90.1 - of which, private customers 20.1 19.9 5.4 5.2 27.4 27.6 - of which, resellers 4.7 3.5 1.3 1.0 4.9 6.1 - of which, business customers 41.8 41.4 14.0 13.2 56.0 56.4 Sales of gas, TWh 36.2 38.1 5.5 5.1 55.5 53.6 Number of employees, full-time equivalents 3 169 3 048 3 169 3 048 2 962
- 8. 8 VATTENFALL INTERIM REPORT JANUARY–SEPTEMBER 2019 Power Generation Power Generation comprises the Generation and Markets Business Areas. The segment includes Vattenfall’s hydro and nuclear power operations, maintenance services business, and optimisation and trading operations including certain large business customers. Nuclear and Hydro availability at high levels • Nuclear power availability at 86.4% despite outage earlier during the year • Reduced output at Ringhals 2 reactor ahead of final decommissioning at year-end Q1–Q3: Net sales increased mainly owing to an improved hedge result, higher sales of electricity and gas (mainly in Germany), and positive currency effects. This was partly offset by lower spot prices in the Nordic countries. The underlying operating profit increased mainly as a result of hedges resulting in higher achieved prices. Nuclear power generation decreased by 0.7 TWh during the period January–September due to a generator replacement at Ringhals 2 earlier during the year. Combined availability for Vattenfall’s nuclear power plants was 86.4% (87.1%) during the period January–September. Hydro power generation decreased by 0.5 TWh during the period January–September, mainly due to lower Nordic reservoir levels during the first months of the year. At the end of the third quarter, reservoir levels were at 81% of capacity (67%), which is 4 percentage points above the normal level. Q3: Net sales increased mainly owing to an improved hedge result. Lower spot prices in the Nordic countries and lower internal sales of CO2 emission allowances had a countering effect. The improved hedge result was also the main contributing factor to the increase in the underlying operating profit. Lower spot prices and a lower realised earnings contribution from the trading operations had an offsetting impact. In September work was begun on reducing the output at the Ringhals 2 nuclear power reactor ahead of the planned, final decommissioning of the reactor on 30 December 2019. Thereafter the reactor and the plant will be emptied of nuclear fuel, which will be stored in the plant’s existing fuel pools for approximately one year. The fuel will then be transported to Clab, SKB’s interim storage facility for spent nuclear fuel in Oskarshamn. KEY FIGURES – POWER GENERATION Jan-Sep Jan-Sep Jul-Sep Jul-Sep Full year Last 12 Amounts in SEK million unless indicated otherwise 2019 2018 2019 2018 2018 months Net sales 74 699 67 475 21 603 21 924 99 970 107 194 External net sales 28 195 23 106 10 118 9 070 36 064 41 153 Underlying operating profit before depreciation, amortisation and impairment losses 14 057 11 035 3 779 2 867 12 830 15 852 Underlying operating profit 11 252 8 475 2 833 1 988 9 371 12 148 - of which, trading 779 621 - 165 418 581 739 Electricity generation, TWh 65.4 66.6 19.7 19.2 90.5 89.3 - of which, hydro power 25.9 26.4 7.4 7.1 35.5 35.0 - of which, nuclear power 39.5 40.2 12.3 12.1 55.0 54.3 Sales of electricity, TWh 20.8 21.0 5.8 6.9 28.7 28.5 - of which, resellers 17.6 18.0 4.8 5.2 24.6 24.2 - of which, business customers 3.2 3.0 1.0 1.7 4.1 4.3 Sales of gas, TWh 3.4 3.6 1 0.8 1.0 1 5.2 1 5.0 Number of employees, full-time equivalents 7 386 7 283 7 386 7 283 7 332 1) The value has been adjusted compared with information previously published in Vattenfall’s financial reports.
- 9. 9 VATTENFALL INTERIM REPORT JANUARY–SEPTEMBER 2019 Wind The Wind Business Area is responsible for development, construction and operation of Vattenfall’s wind farms as well as large-scale and decentralised solar power and batteries. Stronger winds and continued capacity growth • Positive earnings contribution form new wind farms and more favourable wind conditions • Winning tender for the Hollandse Kust Zuid (HKZ) 3 & 4 offshore wind farm in the Netherlands • Awards for two of Vattenfall’s wind farms Q1–Q3: Q1–Q3: Net sales and the underlying operating profit increased during the first nine months of the year, mainly owing to new capacity and higher production due to stronger winds. Two wind farms were commissioned during the last 12 months: Slufterdam (29 MW) and Horns Rev 3 (373 MW of a total of 407 MW). Electricity generation increased as a result of new capacity and stronger winds. Q3: Net sales and the underlying operating profit increased compared with the third quarter of 2018 owing to new capacity and higher production from existing assets due to stronger winds. Vattenfall won the tender for the Hollandse Kust Zuid (HKZ) 3 & 4 offshore wind farm in the Netherlands. Vattenfall already has the permit to build the first stage, HKZ 1 & 2, and potential synergies exist in maintenance and logistics, for example. Together these projects will have an installed capacity of approximately 1.5 GW, which corresponds to the annual electricity consumption of up to 3 million Dutch homes. In August the Sandbank offshore wind farm in Germany received an award from AGOW (Arbeitsgemeinschaft Offshore Wind) for being the most efficient wind farm in Germany in 2018. Additionally, Vattenfall’s Aberdeen Bay offshore wind farm in Scotland was the recipient of the Renewables Award at the P&J Energy Voice Gold Awards. The distinction highlighted the positive effect the wind farm has had on the City of Aberdeen. In Wieringermeer, the Netherlands, 11 turbines were installed and the first electricity was delivered in September. The wind farm will have a total capacity of 185 MW and is planned to be completed in 2020. KEY FIGURES – WIND Jan-Sep Jan-Sep Jul-Sep Jul-Sep Full year Last 12 Amounts in SEK million unless indicated otherwise 2019 2018 2019 2018 2018 months Net sales 9 502 7 839 3 084 2 270 11 852 13 515 External net sales 4 679 3 589 1 667 958 5 726 6 816 Underlying operating profit before depreciation, amortisation and impairment losses 6 500 5 283 2 041 1 400 8 328 9 545 Underlying operating profit 2 474 1 902 623 264 3 747 4 319 Electricity generation - wind power TWh 6.7 5.3 2.2 1.5 7.8 9.2 Sales of electricity, TWh 1.0 0.9 0.3 0.2 1.1 1.2 Number of employees, full-time equivalents 981 868 981 868 894
- 10. 10 VATTENFALL INTERIM REPORT JANUARY–SEPTEMBER 2019 Heat The Heat Business Area comprises Vattenfall’s heat business (district heating and decentral solutions) and gas- and coal-fired condensing plants. Continued strong customer growth and roadmap for coal phase-out in Berlin • Feasibility study conducted by Vattenfall and the City of Berlin shows that a coal phase-out in Berlin is feasible by 2030 • Power-to-Heat facility connected to the district heating network in Berlin, enabling the closure of a coal-fired power plant • Completion of the transfer of the district heating business in Hamburg Q1–Q3: Net sales and the underlying operating profit increased mainly as a result of positive price effects in heat sales. Higher operating expenses mainly owing to higher maintenance costs in the Berlin heat business had an offsetting impact on underlying operating profit. Sales of heat decreased as a result of warmer weather. Compared with year-end 2018, the number of customers increased by 1.4% to 2.2 million customers. Q3: Net sales decreased mainly due to lower electricity generation from Vattenfall’s condensing power plants. Positive price effects from heat sales had an offsetting impact. Together with higher spreads for the gas-fired power generation, this partly compensated for weaker performance in coal-fired power generation. The underlying operating profit was unchanged compared with the same period a year ago. The transfer of the district heating business in Hamburg to the City of Hamburg was completed on 2 September. The city purchased Vattenfall’s share (74.9%) in the district heating company for EUR 625 million, generating a capital gain of SEK 3.1 billion. This is reported under “Other” (see page 16) and thereby does not affect earnings for the Heat operating segment. A feasibility study conducted together with the City of Berlin has shown that a coal exit in Berlin is feasible by 2030 at the latest. The study shows that by replacing hard coal, yearly CO2 emissions can be reduced by more than 2 million tonnes. This means that the coal phase-out in Vattenfall’s district heating operations in the city would be the largest single contribution to Berlin’s path to climate neutrality by 2050. In September Europe’s largest Power-to-Heat facility was connected to the district heating network in Berlin, making it possible to take the coal-fired Reuter C unit out of operation on 1 October 2019. The new plant, with a capacity of 120 MWth, will produce and store heat from excess electricity generated by renewable energy sources. The investment amounted to just under EUR 100 million and also includes surrounding infrastructure and gas-fired peak boilers with a total capacity of 120 MWth. Vattenfall sees a potential to expand its Power-to- Heat capacity by an additional 300 MW by 2030. In Norderstedt, Germany, Vattenfall and the real estate company Manke GmbH & Co. KG signed an agreement for decentralised solutions. Heat and power production from a micro combined heat and power plant will be complemented with a boiler and solar panels. Vattenfall will also install separate meter systems and e-vehicle charging solutions. KEY FIGURES – HEAT Jan-Sep Jan-Sep Jul-Sep Jul-Sep Full year Last 12 Amounts in SEK million unless indicated otherwise 2019 2018 2019 2018 2018 months Net sales 23 245 23 029 5 680 6 905 33 970 34 186 External net sales 11 759 11 101 2 601 2 576 15 828 16 486 Underlying operating profit before depreciation, amortisation and impairment losses 3 129 3 002 243 182 4 448 4 575 Underlying operating profit 318 260 - 768 - 765 771 829 Electricity generation - TWh 23.3 22.5 6.8 7.1 32.0 32.8 - of which, fossil-based power 23.0 22.2 6.7 7.0 31.6 32.4 - of which, biomass, waste 0.3 0.3 0.1 0.1 0.4 0.4 Sales of electricity business customers, TWh 0.9 0.8 0.3 0.3 1.1 1.2 Sales of heat, TWh 12.0 12.5 1.7 1.9 18.3 17.8 Number of employees, full-time equivalents 3 321 3 823 3 321 3 823 3 822
- 11. 11 VATTENFALL INTERIM REPORT JANUARY–SEPTEMBER 2019 Distribution The Distribution Business Area comprises Vattenfall’s electricity distribution operations in Sweden, Germany (Berlin) and the UK. Decision on new revenue frames • Energy Markets Inspectorate announced its decision on the revenue frames for the next regulatory period • SEK 1.8 billion to be invested to upgrade the electricity network and increase capacity in the Stockholm region Q1–Q3: Net sales increased during the first nine months of the year. Lower distributed volume in Sweden was compensated by a higher contribution from Germany. The underlying operating profit decreased mainly due to costs related to the storm “Alfrida” and higher depreciation following investments. An improvement in earnings in Germany had an offsetting effect, mainly owing to lower costs after a reduction of fees to the Transmission System Operators (TSO). Q3: Net sales increased during the third quarter mainly owing to a higher contribution from Germany. The underlying operating profit increased as a result of a higher gross margin in Germany. This was largely a result of the reduction of fees to the TSOs. After the balance sheet day, the Swedish Energy Markets Inspectorate (Ei) announced its decision on the revenue frames for Vattenfall Eldistribution for the next regulatory period 2020– 2023. Under the decision, the allowed return (WACC) has been set at 2.16%, which is considerably lower than for the 2016– 2019 regulatory period. This reduces the scope for investments in a situation where major investments are needed in the electricity network to be able to contribute to the forthcoming energy shift. The Stockholm region is experiencing continued growth with major development of housing, companies and industrial areas. This is giving rise to a greater need for capacity in the electricity network – a system that is already strained. To ensure secure power supply, Vattenfall has begun extensive upgrading work to strengthen the electricity network in a number of municipalities. In total, investments of SEK 1.8 billion are planned for the coming five years. The electricity network is being upgraded through the refurbishment of transformer stations, new construction and upgrading of existing power lines, and an increase in the voltage in the electricity network to 130 kV in order to increase distribution capacity. Electrification of the transport sector is continuing also at sea. A collaboration has been initiated in Stockholm with Echandia Marine (Green City Ferries) in electrified commuter ferry traffic. A business model has been drawn up under which Vattenfall will be responsible for ownership and management of the electrical operations. KEY FIGURES – DISTRIBUTION Jan-Sep Jan-Sep Jul-Sep Jul-Sep Full year Last 12 Amounts in SEK million unless indicated otherwise 2019 2018 2019 2018 2018 months Net sales 16 604 16 285 5 057 4 864 22 374 22 693 External net sales 13 185 12 990 3 980 3 808 17 845 18 040 Underlying operating profit before depreciation, amortisation and impairment losses 5 848 6 752 1 985 1 837 9 292 8 388 Underlying operating profit 3 454 4 530 1 190 1 096 6 250 5 174 Number of employees, full-time equivalents 2 232 2 194 2 232 2 194 2 190
- 12. 12 VATTENFALL INTERIM REPORT JANUARY–SEPTEMBER 2019 Other Other pertains mainly to all Staff functions, including Treasury and Shared Service Centres. Net sales consist primarily of revenues attributable to Vattenfall’s service organisations such as Shared Services, IT and Vattenfall Insurance. KEY FIGURES – OTHER Jan-Sep Jan-Sep Jul-Sep Jul-Sep Full year Last 12 Amounts in SEK million unless indicated otherwise 2019 2018 2019 2018 2018 months Net sales 4 096 3 791 1 326 1 286 5 255 5 560 External net sales 99 160 53 47 201 140 Underlying operating profit before depreciation, amortisation and impairment losses - 393 - 583 - 133 - 247 - 1 095 - 905 Underlying operating profit - 995 - 910 - 343 - 356 - 1 528 - 1 613 Number of employees, full-time equivalents 2 697 2 735 2 697 2 735 2 710
- 13. 13 VATTENFALL INTERIM REPORT JANUARY–SEPTEMBER 2019 Consolidated income statement Jan-Sep Jan-Sep Jul-Sep Jul-Sep Full year Last 12 Amounts in SEK million 2019 2018 2019 2018 2018 months Net sales 120 181 107 0716 35 938 32 0356 154 5476 167 657 Cost of purchases - 62 792 - 54 8766 - 17 930 - 15 3606 - 82 9196 - 90 835 Other external expenses - 14 147 - 13 165 - 4 442 - 4 412 - 19 375 - 20 357 Personnel expenses - 14 983 - 14 238 - 4 725 - 4 353 - 19 157 - 19 902 Other operating income and expenses, net 5 089 580 4 647 - 23 925 5 434 Participations in the results of associated companies 253 308 11 - 33 320 265 Operating profit before depreciation, amortisation and impairment losses (EBITDA) 33 601 25 680 13 499 7 854 34 341 42 262 Depreciation, amortisation and impairments - 13 886 - 12 250 - 4 822 - 4 174 - 16 722 - 18 358 Operating profit (EBIT)1 19 715 13 430 8 677 3 680 17 619 23 904 Financial income2,5 3 361 2 513 860 - 64 2 887 3 735 Financial expenses3,4,5 - 4 927 - 4 982 - 1 739 - 1 435 - 6 503 - 6 448 Profit before income taxes 18 149 10 961 7 798 2 181 14 003 21 191 Income taxes expense - 3 776 - 2 054 - 1 098 - 399 - 1 996 - 3 718 Profit for the period 14 373 8 907 6 700 1 782 12 007 17 473 Attributable to owner of the Parent Company 13 022 7 736 6 3757 1 668 10 157 15 443 Attributable to non-controlling interests 1 351 1 171 3257 114 1 850 2 030 Supplementary information Underlying operating profit before depreciation, amortisation and impairment losses 30 775 27 506 8 416 6 301 36 469 39 738 Underlying operating profit 16 889 15 256 3 594 2 127 19 883 21 516 Financial items, net excl. discounting effects attributable to provisions and return from the Swedish Nuclear Waste Fund - 2 755 - 3 001 - 1 035 - 757 - 3 407 - 3 161 1) Including items affecting comparability 2 826 - 1 826 5 083 1 553 - 2 264 2 388 - of which, capital gains 3 489 660 3 091 23 1 067 3 896 - of which, capital losses - 18 - 83 - 3 - 13 - 111 - 46 - of which, impairment losses — — — — - 136 - 136 - of which, provisions - 530 - 757 - 4 - 2 - 1 649 - 1 422 - of which, unrealised changes in the fair value of energy derivatives 101 - 852 583 1 465 - 156 797 - of which, unrealised changes in the fair value of inventories - 681 - 14 228 210 61 - 606 - of which, restructuring costs - 129 - 291 13 - 29 - 554 - 392 - of which, other non-recurring items affecting comparability 594 - 489 1 175 - 101 - 786 297 2) Including return from the Swedish Nuclear Waste Fund 2 909 2 222 760 - 182 2 030 2 717 3) Including interest components related to pension costs - 664 - 632 - 219 - 213 - 844 - 876 4) Including discounting effects attributable to provisions - 1 720 - 1 690 - 604 - 560 - 2 239 - 2 269 5) Items affecting comparability recognised as financial income and expenses, net - 1 2 040 - 3 — 2 040 - 1 6) Due to changed presentation of transactions related to Renewable Obligation Certificates, Net sales and Cost of purchases for the comparative periods have been adjusted, with no effect on EBITDA. 7) The value has been adjusted compared with information previously published in Vattenfall’s financial reports.
- 14. 14 VATTENFALL INTERIM REPORT JANUARY–SEPTEMBER 2019 Consolidated statement of comprehensive income Jan-Sep Jan-Sep Jul-Sep Jul-Sep Full year Last 12 Amounts in SEK million 2019 2018 2019 2018 2018 months Profit for the period 14 373 8 907 6 700 1 782 12 007 17 473 Other comprehensive income Items that will be reclassified to profit or loss when specific conditions are met Cash flow hedges - changes in fair value 1 039 8 404 735 7 680 7 776 411 Cash flow hedges - dissolved against income statement - 3 374 - 2 456 - 990 - 1 482 - 6 066 - 6 984 Cash flow hedges - transferred to cost of hedged item - 26 6 - 1 - 5 3 - 29 Hedging of net investments in foreign operations - 1 957 - 2 459 - 521 667 - 2 177 - 1 675 Translation differences, divested companies - 76 2 - 76 — 2 - 76 Translation differences 4 593 4 835 1 467 - 1 478 4 193 3 951 Income taxes related to items that will be reclassified 1 256 - 1 492 174 - 1 916 - 237 2 511 Total items that will be reclassified to profit or loss when specific conditions are met 1 455 6 840 788 3 466 3 494 - 1 891 Items that will not be reclassified to profit or loss Remeasurement pertaining to defined benefit obligations - 7 878 - 1 - 3 773 - 1 - 415 - 8 292 Income taxes related to items that will not be reclassified 2 157 - 14 1 029 1 - 5 2 166 Total items that will not be reclassified to profit or loss - 5 721 - 15 - 2 744 — - 420 - 6 126 Total other comprehensive income, net after income taxes - 4 266 6 825 - 1 956 3 466 3 074 - 8 017 Total comprehensive income for the period 10 107 15 732 4 744 5 248 15 081 9 456 Attributable to owner of the Parent Company 8 289 14 000 3 567 5 273 12 821 7 110 Attributable to non-controlling interests 1 818 1 732 1 177 - 25 2 260 2 346
- 15. 15 VATTENFALL INTERIM REPORT JANUARY–SEPTEMBER 2019 Operating segments, Vattenfall Group Jan-Sep Jan-Sep Jul-Sep Jul-Sep Full year Last 12 Amounts in SEK million 2019 2018 2019 2018 2018 months External net sales Customers & Solutions 62 264 56 125 17 519 15 576 78 883 85 022 Power Generation 28 195 23 106 10 118 9 070 36 064 41 153 Wind 4 679 3 589 2 1 667 958 2 5 726 2 6 816 Heat 11 759 11 101 2 601 2 576 15 828 16 486 Distribution 13 185 12 990 3 980 3 808 17 845 18 040 - of which, Distribution Germany 4 899 4 587 1 607 1 449 6 265 6 577 - of which, Distribution Sweden 8 203 8 328 2 347 2 335 11 462 11 337 Other1 99 160 53 47 201 140 Total 120 181 107 071 2 35 938 32 035 2 154 547 2 167 657 Internal net sales Customers & Solutions 1 822 1 665 479 570 2 435 2 592 Power Generation 46 504 44 369 11 485 12 854 63 906 66 041 Wind 4 823 4 250 2 1 417 1 312 2 6 126 2 6 699 Heat 11 486 11 928 3 079 4 329 18 142 17 700 Distribution 3 419 3 295 1 077 1 056 4 529 4 653 - of which, Distribution Germany 3 079 2 960 970 958 4 053 4 172 - of which, Distribution Sweden 361 343 114 100 493 511 Other1 3 997 3 631 1 273 1 239 5 054 5 420 Eliminations - 72 051 - 69 138 2 - 18 810 - 21 360 2 - 100 192 2 - 103 105 Total — — — — — — Total net sales Customers & Solutions 64 086 57 790 17 998 16 146 81 318 87 614 Power Generation 74 699 67 475 21 603 21 924 99 970 107 194 Wind 9 502 7 839 3 084 2 270 11 852 13 515 Heat 23 245 23 029 5 680 6 905 33 970 34 186 Distribution 16 604 16 285 5 057 4 864 22 374 22 693 - of which, Distribution Germany 7 978 7 547 2 577 2 407 10 318 10 749 - of which, Distribution Sweden 8 564 8 671 2 461 2 435 11 955 11 848 Other1 4 096 3 791 1 326 1 286 5 255 5 560 Eliminations - 72 051 - 69 138 2 - 18 810 - 21 360 2 - 100 192 2 - 103 105 Total 120 181 107 071 2 35 938 32 035 2 154 547 2 167 657
- 16. 16 VATTENFALL INTERIM REPORT JANUARY–SEPTEMBER 2019 Jan-Sep Jan-Sep Jul-Sep Jul-Sep Full year Last 12 Amounts in SEK million 2019 2018 2019 2018 2018 months Operating profit before depreciation, amortisation and impairment losses (EBITDA) Customers & Solutions 1 817 2 136 525 293 2 650 2 331 Power Generation 13 422 8 747 5 751 4 439 10 170 14 845 Wind 6 497 5 276 2 041 1 391 8 277 9 498 Heat 3 119 2 924 253 113 4 071 4 266 Distribution 5 839 6 743 1 983 1 835 9 260 8 356 - of which, Distribution Germany 1 613 1 354 611 438 1 923 2 182 - of which, Distribution Sweden 4 190 5 350 1 363 1 386 7 299 6 139 Other1 3 115 14 2 973 - 171 - 90 3 011 Eliminations - 208 - 160 - 27 - 46 3 - 45 Total 33 601 25 680 13 499 7 854 34 341 42 262 Underlying operating profit before depreciation, amortisation and impairment losses Customers & Solutions 1 842 2 177 528 308 2 663 2 328 Power Generation 14 057 11 035 3 779 2 867 12 830 15 852 Wind 6 500 5 283 2 041 1 400 8 328 9 545 Heat 3 129 3 002 243 182 4 448 4 575 Distribution 5 848 6 752 1 985 1 837 9 292 8 388 - of which, Distribution Germany 1 623 1 363 613 441 1 957 2 217 - of which, Distribution Sweden 4 189 5 349 1 363 1 385 7 297 6 137 Other1 - 393 - 583 - 133 - 247 - 1 095 - 905 Eliminations - 208 - 160 - 27 - 46 3 - 45 Total 30 775 27 506 8 416 6 301 36 469 39 738 Jan-Sep Jan-Sep Jul-Sep Jul-Sep Full year Last 12 Amounts in SEK million 2019 2018 2019 2018 2018 months Operating profit (EBIT) Customers & Solutions 570 1 117 83 - 69 1 139 592 Power Generation 10 617 6 187 4 805 3 560 6 711 11 141 Wind 2 471 1 894 623 255 3 681 4 258 Heat 308 182 - 758 - 834 393 519 Distribution 3 446 4 522 1 188 1 095 6 218 5 142 - of which, Distribution Germany 841 641 348 197 950 1 150 - of which, Distribution Sweden 2 593 3 860 840 892 5 257 3 990 Other1 2 511 - 312 2 763 - 281 - 526 2 297 Eliminations - 208 - 160 - 27 - 46 3 - 45 Operating profit (EBIT) 19 715 13 430 8 677 3 680 17 619 23 904 Operating profit (EBIT) 19 715 13 430 8 677 3 680 17 619 23 904 Financial income and expenses - 1 566 - 2 469 - 879 - 1 499 - 3 616 - 2 713 Profit before tax 18 149 10 961 7 798 2 181 14 003 21 191 Underlying operating profit Customers & Solutions 594 1 159 86 - 54 1 269 704 Power Generation 11 252 8 475 2 833 1 988 9 371 12 148 Wind 2 474 1 902 623 264 3 747 4 319 Heat 318 260 - 768 - 765 771 829 Distribution 3 454 4 530 1 190 1 096 6 250 5 174 - of which, Distribution Germany 851 651 350 199 985 1 185 - of which, Distribution Sweden 2 591 3 859 840 891 5 254 3 986 Other1 - 995 - 910 - 343 - 356 - 1 528 - 1 613 Eliminations - 208 - 160 - 27 - 46 3 - 45 Underlying operating profit 16 889 15 256 3 594 2 127 19 883 21 516 1) “Other” pertains mainly to all Staff functions, including Treasury, Shared Service Centres and material capital gains and -losses. 2) Due to changed presentation of transactions related to Renewable Obligation Certificates, Net sales and Cost of purchases for the comparative periods have been adjusted, with no effect on EBITDA.
- 17. 17 VATTENFALL INTERIM REPORT JANUARY–SEPTEMBER 2019 Consolidated balance sheet 30 Sep 30 Sep 31 Dec Amounts in SEK million 2019 2018 2018 Assets Non-current assets Intangible assets: non-current 19 033 18 514 18 082 Property, plant and equipment 252 030 238 719 238 801 Participations in associated companies and joint arrangements 5 216 5 204 5 429 Other shares and participations 348 222 331 Share in the Swedish Nuclear Waste Fund 45 829 41 871 42 038 Derivative assets 12 140 17 798 13 951 Prepaid expenses 58 28 28 Deferred tax assets 13 371 11 940 11 719 Contract assets 36 193 44 Other non-current receivables 6 061 3 592 5 538 Total non-current assets 354 122 338 081 335 961 Current assets Inventories 13 095 13 626 13 647 Intangible assets: current 164 274 710 Trade receivables and other receivables 21 116 20 676 26 003 Contract assets 157 — 170 Advance payments paid 2 836 4 176 2 926 Derivative assets 13 628 37 292 23 955 Prepaid expenses and accrued income 5 460 6 003 8 427 Current tax assets 1 883 2 543 2 425 Short-term investments 21 156 21 466 22 977 Cash and cash equivalents 12 773 19 720 17 094 Assets held for sale — — 8 313 Total current assets 92 268 125 776 126 647 Total assets 446 390 463 857 462 608 Equity and liabilities Equity Attributable to owner of the Parent Company 94 385 89 085 88 096 Attributable to non-controlling interests 15 076 15 128 15 501 Total equity 109 461 104 213 103 597 Non-current liabilities Hybrid Capital 20 622 19 865 19 832 Other interest-bearing liabilities 55 094 47 262 43 981 Pension provisions 48 321 43 208 39 686 Other interest-bearing provisions 95 112 89 924 93 222 Derivative liabilities 10 596 19 583 14 042 Deferred tax liabilities 14 406 16 483 15 119 Contract liabilities 7 322 6 694 6 883 Other noninterest-bearing liabilities 2 252 2 392 2 305 Total non-current liabilities 253 725 245 411 235 070 Current liabilities Trade payables and other liabilities 25 335 24 582 29 482 Contract liabilities 1 069 1 189 1 052 Advance payments received 2 905 15 923 15 293 Derivative liabilities 18 560 41 233 27 245 Accrued expenses and deferred income 11 581 10 146 16 485 Current tax liabilities 1 809 62 850 Other interest-bearing liabilities 18 105 17 055 24 462 Interest-bearing provisions 3 840 4 043 3 734 Liabilities associated with assets held for sale — — 5 338 Total current liabilities 83 204 114 233 123 941 Total equity and liabilities 446 390 463 857 462 608
- 18. 18 VATTENFALL INTERIM REPORT JANUARY–SEPTEMBER 2019 SUPPLEMENTARY INFORMATION 30 Sep 30 Sep 31 Dec Amounts in SEK million 2019 2018 2018 Calculation of capital employed Intangible assets: current and non-current 19 197 18 788 18 792 Property, plant and equipment 252 030 238 719 238 801 Participations in associated companies and joint arrangements 5 216 5 204 5 429 Deferred and current tax assets 15 254 14 483 14 144 Non-current noninterest-bearing receivables 3 688 2 520 3 657 Contract assets 193 193 214 Inventories 13 095 13 626 13 647 Trade receivables and other receivables 21 116 20 676 26 003 Prepaid expenses and accrued income 5 460 6 003 8 427 Unavailable liquidity 5 687 7 154 5 596 Other 514 414 624 Total assets excl. financial assets 341 450 327 780 335 334 Deferred and current tax liabilities - 16 215 - 16 545 - 15 969 Other noninterest-bearing liabilities - 2 252 - 2 392 - 2 305 Contract liabilities - 8 391 - 7 883 - 7 935 Trade payable and other liabilities - 25 335 - 24 582 - 29 482 Accrued expenses and deferred income - 11 581 - 10 146 - 16 485 Other - 302 — — Total noninterest-bearing liabilities - 64 076 - 61 548 - 72 176 Other interest-bearing provisions not related to adjusted net debt1 - 11 984 - 11 487 - 11 589 Capital employed2 265 390 254 745 251 569 Capital employed, average 260 068 245 025 250 283 Calculation of net debt Hybrid Capital - 20 622 - 19 865 - 19 832 Bond issues, commercial paper and liabilities to credit institutions - 48 606 - 47 792 - 50 303 Present value of liabilities pertaining to acquisitions of Group companies - 28 - 51 - 51 Liabilities to associated companies - 770 - 510 - 504 Liabilities to owners of non-controlling interests - 10 723 - 10 603 - 10 406 Other liabilities - 13 072 - 5 361 - 7 179 Total interest-bearing liabilities - 93 821 - 84 182 - 88 275 Cash and cash equivalents 12 773 19 720 17 094 Short-term investments 21 156 21 466 22 977 Loans to owners of non-controlling interests in foreign Group companies 244 612 476 Net debt2 - 59 648 - 42 384 - 47 728 Calculation of adjusted gross debt and net debt Total interest-bearing liabilities - 93 821 - 84 182 - 88 275 50% of Hybrid Capital3 10 311 9 933 9 916 Present value of pension obligations - 48 321 - 43 208 - 39 686 Provisions for gas and wind operations and other environment-related provisions - 8 267 - 7 082 - 7 656 Provisions for nuclear power (net)4 - 29 519 - 31 052 - 31 920 Margin calls received 5 279 2 901 3 370 Liabilities to owners of non-controlling interests due to consortium agreements 10 723 9 385 9 195 Adjustment related to assets/liabilities held for sale — — - 1 743 Adjusted gross debt - 153 615 - 143 305 - 146 799 Reported cash and cash equivalents and short-term investments 33 929 41 186 40 071 Unavailable liquidity - 5 687 - 7 154 - 5 596 Adjusted cash and cash equivalents and short-term investments 28 242 34 032 34 475 Adjusted net debt2 - 125 373 - 109 273 - 112 324 1) Includes personnel-related provisions for non-pension purposes, provisions for tax and legal disputes and certain other provisions. 2) See Definitions and calculations of key ratios for definitions of Alternative Performance Measures. 3) 50% of Hybrid Capital is treated as equity by the rating agencies, which thereby reduces adjusted net debt. 4) The calculation is based on Vattenfall’s share of ownership in the respective nuclear power plants, less Vattenfall’s share in the Swedish Nuclear Waste Fund and liabilities to associated companies. Vattenfall has the following ownership interests in the respective plants: Forsmark 66%, Ringhals 70.4%, Brokdorf 20%, Brunsbüttel 66.7%, Krümmel 50% and Stade 33.3%. (According to a special agreement, Vattenfall is responsible for 100% of the provisions for Ringhals.)
- 19. 19 VATTENFALL INTERIM REPORT JANUARY–SEPTEMBER 2019 Consolidated statement of cash flows Jan-Sep Jan-Sep Jul-Sep Jul-Sep Full year Last 12 Amounts in SEK million 2019 2018 2019 2018 2018 months Operating activities Operating profit before depreciation, amortisation and impairment losses (EBITDA) 33 601 25 680 13 499 7 854 34 341 42 262 Tax paid - 1 006 - 4 103 - 552 - 1 420 - 3 698 - 601 Capital gains/losses, net - 3 472 - 578 - 3 088 - 10 - 956 - 3 850 Interest received 173 185 18 30 343 331 Interest paid - 2 717 - 2 799 - 331 - 326 - 3 046 - 2 964 Other, incl. non-cash items - 3 150 - 2 375 - 1 963 - 2 882 - 3 709 - 4 484 Funds from operations (FFO) 23 429 16 010 7 583 3 246 23 275 30 694 Changes in inventories 23 1 759 678 1 435 1 549 - 187 Changes in operating receivables 1 865 7 348 4 204 4 958 - 790 - 6 273 Changes in operating liabilities - 490 - 3 060 3 224 - 1 699 8 128 10 698 Other changes - 13 098 13 232 - 2 080 10 876 8 892 - 17 438 Cash flow from changes in operating assets and operating liabilities - 11 700 19 279 6 026 15 570 17 779 - 13 200 Cash flow from operating activities 11 729 35 289 13 609 18 816 41 054 17 494 Investing activities Acquisitions in Group companies - 752 - 31 20 - 13 - 31 - 752 Investments in associated companies and other shares and participations 237 337 99 20 254 154 Other investments in non-current assets - 16 524 - 13 183 - 4 705 - 4 043 - 22 136 - 25 477 Total investments - 17 039 - 12 877 - 4 586 - 4 036 - 21 913 - 26 075 Divestments 7 299 959 6 715 70 1 569 7 909 Cash and cash equivalents in acquired companies 147 5 — 5 5 147 Cash and cash equivalents in divested companies - 3 626 - 43 - 3 626 — - 43 - 3 626 Cash flow from investing activities - 13 219 - 11 956 - 1 497 - 3 961 - 20 382 - 21 645 Cash flow before financing activities - 1 490 23 333 12 112 14 855 20 672 - 4 151 Financing activities Changes in short-term investments 2 472 - 2 856 - 3 636 - 1 943 - 4 523 805 Changes in loans to owners of non-controlling interests in foreign Group companies 249 428 12 11 562 383 Loans raised1 9 249 2 625 - 3 257 - 6 505 8 720 15 344 Amortisation of debt pertaining to acquisitions of Group companies - 23 — — — — - 23 Amortisation of other debt - 14 072 - 8 940 - 6 772 - 2 048 - 9 562 - 14 694 Effect of early termination of swaps related to financing activities 258 68 37 — - 122 68 Dividends paid to owners - 3 448 - 3 249 - 822 - 222 - 3 299 - 3 498 Contribution/repaid contribution from owners of non-controlling interests - 672 - 602 - 4 - 47 - 1 260 - 1 330 Cash flow from financing activities - 5 987 - 12 526 - 14 442 - 10 754 - 9 484 - 2 945 Cash flow for the period - 7 477 10 807 - 2 330 4 101 11 188 - 7 096 Jan-Sep Jan-Sep Jul-Sep Jul-Sep Full year Last 12 Amounts in SEK million 2019 2018 2019 2018 2018 months Cash and cash equivalents Cash and cash equivalents at start of period 17 094 8 805 11 676 15 662 8 805 19 720 Cash and cash equivalents included in assets held for sale 2 992 — 3 347 — - 2 992 — Cash flow for the period - 7 477 10 807 - 2 330 4 101 11 188 - 7 096 Translation differences 164 108 80 - 43 93 149 Cash and cash equivalents at end of period 12 773 19 720 12 773 19 720 17 094 12 773
- 20. 20 VATTENFALL INTERIM REPORT JANUARY–SEPTEMBER 2019 SUPPLEMENTARY INFORMATION Jan-Sep Jan-Sep Jul-Sep Jul-Sep Full year Last 12 Amounts in SEK million 2019 2018 2019 2018 2018 months Cash flow before financing activities -1,490 23 333 12 112 14 855 20 672 - 4 151 Financing activities Effects from terminating swaps related to financing activities 258 68 37 — - 122 68 Dividends paid to owners - 3 448 - 3 249 - 822 - 222 - 3 299 - 3 498 Contribution from owners of non-controlling interests - 672 - 602 - 4 - 47 - 1 260 - 1 330 Cash flow after dividend - 5 352 19 550 11 323 14 586 15 991 - 8 911 Analysis of change in net debt Net debt at start of period - 47 728 - 59 260 - 72 455 - 57 753 - 59 260 - 42 384 Change accounting principles - 4 609 — — — — - 4 609 Cash flow after dividend - 5 352 19 550 11 323 14 586 15 991 - 8 911 Changes as a result of valuation at fair value - 872 507 - 580 234 387 - 992 Changes in interest-bearing liabilities for leasing - 534 — - 99 3 — — - 534 Interest-bearing liabilities/short-term investments acquired/divested - 2 — — — — - 2 Cash and cash equivalents included in assets held for sale 2 992 — 3 347 — - 2 992 — Interest-bearing liabilities associated with assets held for sale - 793 — 5 — 781 - 12 Translation differences on net debt - 2 750 - 3 181 - 1 189 3 549 - 2 635 - 2 204 Net debt at end of period - 59 648 - 42 384 - 59 648 - 42 384 - 47 728 - 59 648 Cash flow from operating activities 11 729 35 289 13 609 18 816 41 054 17 494 Maintenance/replacement investments - 8 985 - 8 480 - 2 669 - 2 843 - 13 479 - 13 984 Free cash flow2 2 744 26 809 10 940 15 973 27 575 3 510 1) Short-term borrowings in which the duration is three months or shorter are reported net. 2) See Definitions and calculations of key ratios for definitions of Alternative Performance Measures. 3) The value has been adjusted compared with information previously published in Vattenfall´s financial reports.
- 21. 21 VATTENFALL INTERIM REPORT JANUARY–SEPTEMBER 2019 INVESTMENTS Jan-Sep Jan-Sep Jul-Sep Jul-Sep Full year Last 12 Amounts in SEK million 2019 2018 2019 2018 2018 months Electricity generation Hydro power 568 689 211 255 1 109 988 Nuclear power 1 630 1 611 441 578 2 389 2 408 Coal power 62 132 32 65 305 235 Gas 167 223 155 9 259 203 Wind power and solar PV 5 529 5 856 1 454 3 234 7 902 7 575 Biomass, waste 91 54 43 35 112 149 Total electricity generation 8 047 8 565 2 336 4 176 12 076 11 558 CHP/heat Fossil-based power 1 475 1 750 408 769 3 028 2 753 Biomass, waste 59 92 22 38 148 115 Other 1 288 920 467 378 1 776 2 144 Total CHP/heat 2 822 2 762 897 1 185 4 952 5 012 Electricity networks Electricity networks 4 132 3 808 1 490 1 356 6 449 6 773 Total electricity networks 4 132 3 808 1 490 1 356 6 449 6 773 Purchases of shares, shareholder contributions 515 - 306 - 119 - 7 - 223 598 Other 955 778 269 334 1 267 1 444 Total investments 16 471 15 607 4 873 7 044 24 521 25 385 Accrued investments, unpaid invoices (-)/ release of accrued investments (+) 568 - 2 730 - 287 - 3 008 - 2 608 690 Total investments with cash flow effect 17 039 12 877 4 586 4 036 21 913 26 075
- 22. 22 VATTENFALL INTERIM REPORT JANUARY–SEPTEMBER 2019 Consolidated statement of changes in equity 30 Sep 2019 30 Sep 2018 31 Dec 2018 Amounts in SEK million Attributable to owner of the Parent Company Attributable to non- controlling interests Total equity Attributable to owner of the Parent Company Attributable to non- controlling interests Total equity Attributable to owner of the Parent Company Attributable to non- controlling interests Total equity Balance brought forward 88 096 15 501 103 597 77 085 15 247 92 332 77 085 15 247 92 332 Profit for the period 13 022 1 351 14 373 7 736 1 171 8 907 10 157 1 850 12 007 Cash flow hedges - changes in fair value 1 039 — 1 039 8 404 — 8 404 7 776 — 7 776 Cash flow hedges - dissolved against income statement - 3 368 - 6 - 3 374 - 2 464 8 - 2 456 - 6 074 8 - 6 066 Cash flow hedges - transferred to cost of hedged item - 26 — - 26 6 — 6 3 — 3 Hedging of net investments in foreign operations - 1 957 — - 1 957 - 2 459 — - 2 459 - 2 177 — - 2 177 Translation differences, divested companies - 76 — - 76 2 — 2 2 — 2 Translation differences 4 121 472 4 593 4 279 556 4 835 3 707 486 4 193 Remeasurement pertaining to defined benefit obligations - 7 878 — - 7 878 — - 1 - 1 - 310 - 105 - 415 Income taxes related to other comprehensive income 3 412 1 3 413 - 1 504 - 2 - 1 506 - 263 21 - 242 Total other comprehensive income for the period - 4 733 467 - 4 266 6 264 561 6 825 2 664 410 3 074 Total comprehensive income for the period 8 289 1 818 10 107 14 000 1 732 15 732 12 821 2 260 15 081 Dividends paid to owners - 2 000 - 1 711 - 3 711 - 2 000 - 1 249 - 3 249 - 2 000 - 1 299 - 3 299 Group contributions from(+)/to(-) owners of non-controlling interests — — — — — — — 743 743 Contribution to/from minority interest — - 672 - 672 — - 602 - 602 — - 1 260 - 1 260 Other changes in ownership — 140 140 — — — — — — Other changes — — — — — — 190 - 190 — Total transactions with equity holders - 2 000 - 2 243 - 4 243 - 2 000 - 1 851 - 3 851 - 1 810 - 2 006 - 3 816 Balance carried forward 94 385 15 076 109 461 89 085 15 128 104 213 88 096 15 501 103 597 - Of which, Reserve for hedges - 1 069 31 - 1 038 3 375 35 3 410 450 35 485
- 23. 23 VATTENFALL INTERIM REPORT JANUARY–SEPTEMBER 2019 Key ratios, Vattenfall Group Jan-Sep Jan-Sep Jul-Sep Jul-Sep Full year Last 12 In % unless otherwise stated. (x) means times1 2019 2018 2019 2018 2018 months Operating margin 16.4 12.54 24.1 11.54 11.44 14.3 Operating margin2 14.1 14.24 10.0 6.64 12.94 12.8 Pre-tax profit margin 15.1 10.24 21.7 6.84 9.14 12.6 Pre-tax profit margin2 12.8 10.04 7.6 2.04 9.24 11.2 Return on equity 16.83 12.43 16.83,5 12.43 11.9 16.8 Return on capital employed 9.23 7.93 9.23 7.93 7.0 9.2 Return on capital employed2 8.33 9.23 8.33 9.23 7.9 8.3 EBIT interest cover, (x) 6.03 3.43 6.03 3.43 4.3 6.0 EBIT interest cover, (x)2 5.43 3.93 5.43 3.93 4.9 5.4 FFO interest cover, (x) 8.33 4.73 8.33 4.73 6.5 8.3 FFO interest cover, net, (x) 10.73 5.83 10.73 5.83 7.8 10.7 Cash flow interest cover after maintenance investments, (x) 2.13 6.03 2.13 6.03 9.1 2.1 FFO/gross debt 32.73 26.83 32.73 26.83 26.4 32.7 FFO/net debt 51.53 53.23 51.53 53.23 48.8 51.5 FFO/adjusted net debt 24.53 20.63 24.53 20.63 20.7 24.5 EBITDA/net financial items, (x) 12.2 8.6 13.0 10.4 10.1 13.4 EBITDA/net financial items, (x)2 11.2 9.2 8.1 8.3 10.7 12.6 Equity/Total assets 24.5 22.5 24.5 22.5 22.4 24.5 Gross debt/equity 85.7 80.8 85.7 80.8 85.2 85.7 Net debt/equity 54.5 40.7 54.5 40.7 46.1 54.5 Gross debt/gross debt plus equity 46.2 44.7 46.2 44.7 46.0 46.2 Net debt/net debt plus equity 35.3 28.9 35.3 28.9 31.5 35.3 Net debt/EBITDA, (x) 1.43 1.23 1.43 1.23 1.4 1.4 Adjusted net debt/EBITDA, (x) 3.03 3.13 3.03 3.13 3.3 3.0 1) See Definitions and calculations of key ratios for definitions of Alternative Performance Measures. 2) Based on Underlying operating profit. 3) Last 12-month values. 4) Due to changed presentation of transactions related to Renewable Obligation Certificates, Net sales and Cost of purchases for the comparative periods have been adjusted, with no effect on EBITDA. 5) The value has been adjusted compared with information previously published in Vattenfall’s financial reports.
- 24. 24 VATTENFALL INTERIM REPORT JANUARY–SEPTEMBER 2019 Quarterly information, Vattenfall Group Q3 Q2 Q1 Q4 Q3 Q2 Q1 Amounts in SEK million 2019 2019 2019 2018 2018 2018 2018 Income statement Net sales 35 938 34 691 49 552 47 476 1 32 035 1 31 176 1 43 860 1 Operating profit before depreciation, amortisation and impairment losses (EBITDA) 13 499 7 515 12 587 8 662 7 854 6 888 10 938 Underlying Operating profit before depreciation, amortisation and impairment losses 8 416 8 268 14 092 8 964 6 301 7 883 13 322 Operating profit (EBIT) 8 677 2 869 8 168 4 189 3 680 2 775 6 975 Underlying operating profit 3 594 3 622 9 673 4 627 2 127 3 770 9 359 Profit before income taxes 7 798 2 490 7 861 3 042 2 181 3 500 5 279 Profit for the period 6 700 1 253 6 420 3 100 1 782 2 967 4 158 - of which, attributable to owner of the Parent Company 6 375 935 2 5 713 2 2 421 1 668 2 377 3 691 - of which, attributable to non-controlling interests 325 318 2 707 2 679 114 590 467 Balance sheet Non-current assets 354 122 349 931 343 569 335 961 338 105 333 706 323 689 Short-term investments 21 156 17 330 14 555 22 977 21 466 19 787 18 078 Cash and cash equivalents 12 773 11 676 12 233 17 094 19 720 15 662 14 414 Other current assets 58 339 75 095 84 164 86 576 84 566 76 135 70 918 Total assets 446 390 454 032 454 521 462 608 463 857 445 290 427 099 Equity 109 461 104 815 108 613 103 597 104 213 99 194 97 815 - of which, attributable to owner of the Parent Company 94 385 90 128 2 92 680 2 88 096 89 085 83 812 82 587 - of which, attributable to non-controlling interests 15 076 14 687 2 15 933 2 15 501 15 128 15 382 15 228 Hybrid Capital 20 622 20 272 20 096 19 832 19 865 20 033 19 615 Other interest-bearing liabilities 73 199 81 441 79 513 68 443 64 317 73 799 77 882 Pension provisions 48 321 44 560 40 037 39 686 43 208 43 704 43 276 Other interest-bearing provisions 98 952 98 983 98 076 96 956 93 967 94 615 91 300 Contract liabilities 8 391 8 163 7 819 7 935 7 883 7 814 7 684 Deferred tax liabilities 14 406 14 297 14 725 15 119 16 483 14 568 14 979 Other noninterest-bearing liabilities 73 038 81 501 85 642 111 040 113 921 91 563 74 548 Total equity and liabilities 446 390 454 032 454 521 462 608 463 857 445 290 427 099 Capital employed 265 390 270 533 270 536 251 569 254 745 262 393 259 921 Net debt - 59 648 - 72 455 - 72 539 - 47 728 - 42 384 - 57 754 - 64 353 Cash flow Funds from operations (FFO) 7 583 6 057 9 789 7 265 3 246 4 006 8 758 Cash flow from changes in operating assets and operating liabilities 6 026 3 028 - 20 754 - 1 501 15 570 11 209 - 7 499 Cash flow from operating activities 13 609 9 085 - 10 965 5 764 18 816 15 215 1 259 Cash flow from investing activities - 1 497 - 5 680 - 6 041 - 8 425 - 3 961 - 4 790 - 3 206 Cash flow before financing activities 12 112 3 405 - 17 006 - 2 661 14 855 10 425 - 1 947 Changes in short-term investments - 3 636 - 2 610 8 718 - 1 667 - 1 943 - 1 438 525 Loans raised/Amortisation of debt, net, etc. - 9 984 1 214 3 759 4 758 - 8 589 - 4 835 7 002 Dividends paid to owners - 822 - 2 627 — - 50 - 222 - 2 949 - 77 Cash flow from financing activities - 14 442 - 4 023 12 477 3 041 - 10 754 - 9 222 7 450 Cash flow for the period - 2 330 - 618 - 4 529 380 4 101 1 203 5 503 Free cash flow 10 940 6 725 - 14 921 766 15 973 12 002 - 1 165 1) Due to changed presentation of transactions related to Renewable Obligation Certificates, Net sales and Cost of purchases for the comparative periods have been adjusted, with no effect on EBITDA. 2) The value has been adjusted compared with information previously published in Vattenfall’s financial reports.
- 25. 25 VATTENFALL INTERIM REPORT JANUARY–SEPTEMBER 2019 Q3 Q2 Q1 Q4 Q3 Q2 Q1 In % unless otherwise stated. (x) means times1 2019 2019 2019 2018 2018 2018 2018 Key ratios Return on equity 16.8 12.04 13.84 11.9 12.4 11.5 11.2 Return on capital employed2 9.2 7.1 7.1 7.0 7.9 7.1 7.8 Return on capital employed2, 3 8.3 7.5 7.6 7.9 9.2 9.2 9.8 EBIT interest cover, (x)2 6.0 5.1 5.1 4.3 3.4 3.0 3.3 EBIT interest cover, (x)2, 3 5.4 5.4 5.4 4.9 3.9 3.9 4.0 FFO/gross debt2 32.7 25.9 24.4 26.4 26.8 25.9 27.8 FFO/net debt2 51.5 36.4 33.5 48.8 53.2 42.1 42.1 FFO/adjusted net debt 24.5 19.2 18.1 20.7 20.6 19.4 20.7 Equity/assets ratio 24.5 23.1 23.9 22.4 22.5 22.3 22.9 Gross debt/equity 85.7 97.0 91.7 85.2 80.8 94.6 99.7 Net debt/equity 54.5 69.1 66.8 46.1 40.7 58.2 65.8 Net debt/net debt plus equity 35.3 40.9 40.0 31.5 28.9 36.8 39.7 Net debt/EBITDA, (x)2 1.4 2.0 2.0 1.4 1.2 1.7 1.8 Adjusted net debt/EBITDA, (x)2 3.0 3.7 3.7 3.3 3.1 3.7 3.7 1) See Definitions and calculations of key ratios for definitions of Alternative Performance Measures. 2) Last 12-month values. 3) Based on Underlying operating profit. 4) The value has been adjusted compared with information previously published in Vattenfall’s financial reports.
- 26. 26 VATTENFALL INTERIM REPORT JANUARY–SEPTEMBER 2019 NOTE 1 | Accounting policies, risks and uncertainties Accounting policies The consolidated accounts for 2019 have been prepared, as for the 2018 year-end accounts, in accordance with International Financial Reporting Standards (IFRS) as endorsed by the EU, and the Swedish Annual Accounts Act. This interim report for the Group has been prepared in accordance with IAS 34 – “Interim Financial Reporting”, and the Swedish Annual Accounts Act. The accounting policies and calculation methods applied in this interim report are the same as those described in Vattenfall’s 2018 Annual and Sustainability Report in Note 3 to the consolidated accounts, Accounting policies. As described, IFRS 16 “Leases” will affect the Vattenfall Group’s financial statements. Other amended IFRSs endorsed by the EU for application in the 2019 financial year have no significant effect on Vattenfall’s financial statements. Impact of IFRS 16 on the Vattenfall's Group’s financial statements Implementation of IFRS 16 entails an increase of the Group's property, plant and equipment and interest-bearing liabilities by SEK 4.6 billion as per 1 January 2019. IFRS 16 has no effect on equity. Vattenfall has transitioned to the new leasing standard by applying the modified retrospective approach, and therefore the 2018 financial statements were not restated. The implementation of IFRS 16 resulted in a higher EBITDA by SEK 559 million and in a higher interest expense by SEK 77 million the first nine months 2019, compared with previous years accounting under IAS 17 where all cost for operational lease contracts were accounted for in operating profit. Lease liabilities as per 1 January 2019 amounted to SEK 5.2 billion. The difference between the operating lease commitment as per 31 December 2018 according to IAS 17 and lease liabilities as per 1 January 2019 according to IFRS 16 is shown below: Operating lease commitment as per 31 December 2018 5,830 Recognition exemption for short-term leases and leases of low-value assets -202 Effect of discounting operating lease commitment -1,019 Lease liabilities as a result of IFRS 16 implementation 4,609 Finance lease liabilities recognised as per 31 December 2018 601 Lease liabilities as per 1 January 2019 5,210 Risks and uncertainties For a description of risks, uncertainties and risk management, please refer to Vattenfall’s 2018 Annual and Sustainability Report, pages 62-69. Apart from the information provided under “Important events” in this report and under “Important events” in previously published interim reports in 2019 , no other material changes have taken place since publication of Vattenfall’s 2018 Annual and Sustainability Report. Other Significant related-party transactions are described in Note 44 to the consolidated accounts in Vattenfall’s 2018 Annual and Sustainability Report. No material changes have taken place in relations or transactions with related parties compared with the description in Vattenfall’s 2018 Annual and Sustainability Report. NOTE 2 | Exchange rates KEY EXCHANGE RATES APPLIED IN THE ACCOUNTS OF THE VATTENFALL GROUP Jan-Sep Jan-Sep Jul-Sep Jul-Sep Full year 2019 2018 2019 2018 2018 Average rate EUR 10.5446 10.2392 10.6655 10.4099 10.2591 DKK 1.4127 1.3745 1.4292 1.3966 1.3765 GBP 11.9572 11.5766 11.9022 11.6867 11.5785 USD 9.3655 8.5853 9.5523 8.9318 8.6988 30 Sep 30 Sep 31 Dec 2019 2018 2018 Balance sheet date rate EUR 10.6958 10.3090 10.2548 DKK 1.4326 1.3826 1.3733 GBP 12.0757 11.6184 11.4639 USD 9.8226 8.9055 8.9562
- 27. 27 VATTENFALL INTERIM REPORT JANUARY–SEPTEMBER 2019 NOTE 3 | Financial instruments by measurement category and related effects on income For assets and liabilities with a remaining maturity less than three months (e.g., cash and bank balances, trade receivables and other receivables and trade payables and other payables), fair value is considered to be equal to the carrying amount. For other shares and participations the fair value is approximated by using cost. The carrying amounts of financial assets do not differ significantly from their fair values. The difference between carrying amounts and fair values for financial liabilities amounts to SEK 7,158 million (31 December 2018: 5,204). Financial instruments that are measured at fair value on the balance sheet are described below according to the fair value hierarchy (levels), which in IFRS 13 is defined as: Level 1: Quoted prices (unadjusted) in active markets for identical assets or liabilities. Level 2: Inputs other than quoted prices included in Level 1 that are observable for the asset or liability, either directly (that is, as prices) or indirectly (that is, derived from prices). In Level 2 Vattenfall reports mainly commodity derivatives, currency-forward contracts and interest rate swaps. Level 3: Inputs for the asset or liability that are not based on observable market data. FINANCIAL ASSETS AND LIABILITIES THAT ARE MEASURED AT FAIR VALUE ON THE BALANCE SHEET AT 30 SEPTEMBER 2019 Amounts in SEK million Level 1 Level 2 Level 3 Total Assets Share in the Swedish Nuclear Waste Fund 45 829 — — 45 829 Derivative assets — 25 386 383 25 769 Short-term investments, cash equivalents and other shares and participations 15 855 8 133 — 23 988 Total assets 61 684 33 519 383 95 586 Liabilities Derivative liabilities — 29 133 23 29 156 Total liabilities — 29 133 23 29 156 FINANCIAL ASSETS AND LIABILITIES THAT ARE MEASURED AT FAIR VALUE ON THE BALANCE SHEET AT 31 DECEMBER 2018 Amounts in SEK million Level 1 Level 2 Level 3 Total Assets Share in the Swedish Nuclear Waste Fund 42 038 — — 42 038 Derivative assets — 37 905 1 37 906 Short-term investments, cash equivalents and other shares and participations 15 471 13 361 — 28 832 Total assets 57 509 51 266 1 108 776 Liabilities Derivative liabilities — 41 191 96 41 287 Total liabilities — 41 191 96 41 287
- 28. 28 VATTENFALL INTERIM REPORT JANUARY–SEPTEMBER 2019 NOTE 4 | Acquired and divested operations Acquired operations End of February 2019, Vattenfall finalized the acquisition of the Dutch electricity and gas sales company DELTA Energie. DELTA Energie supplies green electricity and gas to households and small and medium- sized companies, mainly in the Dutch province Zeeland. The company has 120 employees and 170,000 customers. The purchase price allocation is not finalized yet. The surplus value mainly relates to customer relationships. Divested operations On 2nd of September 2019, Vattenfall finalized the divestment of the district heating in Hamburg to the City of Hamburg. The transaction was based on the decision taken by the City of Hamburg in October 2018 to exercise its option to acquire Vattenfalls shareholding of 74,9% in the company. The consideration received amounts to EUR 634 million.
- 29. 29 VATTENFALL INTERIM REPORT JANUARY–SEPTEMBER 2019 The Parent Company Vattenfall AB Accounting policies The Parent Company Vattenfall AB’s accounts are prepared in accordance with the Swedish Annual Accounts Act and recommendation RFR 2 – Accounting for Legal Entities, issued by the Swedish Financial Reporting Board. The accounting policies used in this interim report are the same as those described in Vattenfall’s 2018 Annual and Sustainability Report, Note 3 to the Parent Company accounts, Accounting policies. New accounting policies applicable from 1 January 2019 has had no significant effect on the Parent Company’s financial statements. The Parent Company report leases in accordance with the exemption rule for IFRS 16 provided in RFR 2, which entails no change compared with the previous year. January – September 2019 A condensed income statement and balance sheet for the Parent Company are presented below. • Net sales amounted to SEK 36,470 million (29,350). • Profit before appropriations and income taxes was SEK 17,834 million (940). • Higher prices on electricity have had a positive effect on earnings. Earnings are also positively impacted by unrealized changes in fair value of energy derivatives. Dividend received from subsidiaries amounts to SEK 8,219 million (3,670). Lower financial expenses due to favorable exchange rate effects have also had a positive effect on earnings. • The balance sheet total was SEK 269,520 million (31 December 2018: 278,819). • Investments during the period amounted to SEK 862 million (582), • Cash and cash equivalents, and short-term investments amounted to SEK 29,944 million (31 December 2018: 39,798). • Dividend paid to the owner of SEK 2,000 million (2,000) Presentation of Parent Company income statements See Note 1 to the consolidated accounts, Accounting policies, risks and uncertainties. Risks and uncertainties See Note 1 to the consolidated accounts, Accounting policies, risks and uncertainties. Other Significant related-party transactions are described in Note 44 to the consolidated accounts, Related party disclosures, in Vattenfall’s 2018 Annual and Sustainability Report. No material changes have taken place in relations or transactions with related parties compared with the description in Vattenfall’s 2018 Annual and Sustainability Report.
- 30. 30 VATTENFALL INTERIM REPORT JANUARY–SEPTEMBER 2019 Parent Company income statement Jan-Sep Jan-Sep Full year Last 12 Amounts in SEK million 2019 2018 2018 months Net sales 36 470 29 350 42 450 49 570 Cost of purchases - 20 285 - 24 422 - 34 751 - 30 614 Other external expenses - 2 508 - 2 408 - 3 745 - 3 845 Personnel expenses - 1 533 - 1 541 - 2 053 - 2 045 Other operating incomes and expenses, net 142 25 71 188 Operating profit before depreciation, amortisation and impairment losses (EBITDA) 12 286 1 004 1 972 13 254 Depreciation, amortisation and impairments - 382 - 374 - 501 - 509 Operating profit (EBIT) 11 904 630 1 471 12 745 Result from participations in subsidiaries 8 219 3 670 3 389 7 938 Other financial income 1 209 1 135 1 403 1 477 Other financial expenses - 3 498 - 4 495 - 4 863 - 3 866 Profit before appropriations and income taxes 17 834 940 1 400 18 294 Appropriations 2 074 1 098 919 1 895 Profit before income taxes 19 908 2 038 2 319 20 189 Income taxes - 2 531 282 135 - 2 678 Profit for the period 17 377 2 320 2 454 17 511
- 31. 31 VATTENFALL INTERIM REPORT JANUARY–SEPTEMBER 2019 Parent Company balance sheet 30 Sep 30 Sep 31 Dec Amounts in SEK million 2019 2018 2018 Assets Non-current assets Intangible assets: non-current 201 194 193 Property, plant and equipment 4 915 4 400 4 563 Shares and participations 149 897 149 995 149 779 Deferred tax assets 967 2 086 1 921 Other non-current receivables 69 834 54 457 63 366 Total non-current assets 225 814 211 132 219 822 Current assets Inventories 387 259 269 Intangible assets: current 119 244 337 Current receivables 13 256 21 566 17 949 Current tax assets — 1 151 644 Short-term investments 20 307 20 601 22 129 Cash and cash equivalents 9 637 16 728 17 669 Total current assets 43 706 60 549 58 997 Total assets 269 520 271 681 278 819 Equity, provisions and liabilities Equity Restricted equity Share capital (131,700,000 shares with a share quota value of SEK 50) 6 585 6 585 6 585 Revaluation reserve 37 989 37 989 37 989 Other reserves 1 350 1 335 1 341 Non-restricted equity Retained earnings 46 608 46 169 46 163 Profit for the period 17 377 2 320 2 454 Total equity 109 909 94 398 94 532 Untaxed reserves 9 680 11 187 11 753 Provisions 5 242 5 262 5 256 Non-current liabilities Hybrid capital 20 625 19 871 19 837 Other interest-bearing liabilities 43 565 44 878 39 171 Other noninterest-bearing liabilities 11 165 9 922 11 196 Total non-current liabilities 75 355 74 671 70 204 Current liabilities Other interest-bearing liabilities 59 684 76 965 86 207 Current tax liabilities 663 — — Other noninterest-bearing liabilities 8 987 9 198 10 867 Total current liabilities 69 334 86 163 97 074 Total equity, provisions and liabilities 269 520 271 681 278 819
- 32. 32 VATTENFALL INTERIM REPORT JANUARY–SEPTEMBER 2019 Definitions and calculations of key ratios Alternative Performance Measures In order to ensure a fair presentation of the Group’s operations, the Vattenfall Group uses a number of Alternative Performance Measures that are not defined in IFRS or in the Swedish Annual Accounts Act. The Alternative Performance Measures that Vattenfall uses are described below, including their definitions and how they are calculated. The Alternative Performance Measures used are unchanged compared with earlier periods. Definition EBIT: Operating profit (Earnings Before Interest and Tax) EBITDA: Operating profit before depreciation, amortisation and impairment losses (Earnings Before Interest, Tax, Depreciation and Amortisation) Items affecting comparability: Capital gains and capital losses from shares and other non-current assets, impairment losses and reversed impairment losses and other material items that are of an infrequent nature. Also included here are, for trading activities, unrealised changes in the fair value of energy derivatives, which according to IFRS 9 cannot be recognised using hedge accounting and unrealised changes in the fair value of inventories. See Consolidated income statement for a specification of items affecting comparability. Underlying EBITDA: Underlying operating profit before depreciation, amortisation and impairment losses. This measure is intended to provide a better view on the operating result by excluding items affecting comparability that are of an infrequent nature, while also excluding non-cash depreciation and amortisation. Underlying operating profit: Operating profit (EBIT) excluding items affecting comparability. This measure is intended to provide a better view on the operating result by excluding items affecting comparability that are of an infrequent nature. FFO: Funds From Operations, see Consolidated statement of cash flow Free cash flow: Cash flow from operating activities less maintenance investments Interest-bearing liabilities See Consolidated balance sheet - Supplementary Information Net debt: See Consolidated balance sheet - Supplementary Information Adjusted net debt: See Consolidated balance sheet - Supplementary Information Capital employed: Total assets less financial assets, noninterest-bearing liabilities and certain other interest-bearing provisions not included in adjusted net debt. see Consolidated balance sheet - Supplementary Information Other definitions Definition Hybrid Capital: Perpetual subordinated securities, junior to all Vattenfall’s unsubordinated debt instruments. LTIF: Lost Time Injury Frequency (LTIF) is expressed in terms of the number of lost time work injuries (per 1 million hours worked), i.e., work-related accidents resulting in absence longer than one day, and accidents resulting in fatality. CALCULATION OF EBITDA, UNDERLYING EBITDA AND UNDERLYING EBIT Jan-Sep Jan-Sep Jul-Sep Jul-Sep Full year Last 12 Amounts in SEK million 2019 2018 2019 2018 2018 months Operating profit (EBIT) 19 715 13 430 8 677 3 680 17 619 23 904 Depreciation, amortisation and impairment losses - 13 886 - 12 250 - 4 822 - 4 174 - 16 722 - 18 358 Operating profit before depreciation, amortisation and impairment losses (EBITDA) 33 601 25 680 13 499 7 854 34 341 42 262 Items affecting comparability excl. impairment losses and reversed impairment losses - 2 826 1 826 - 5 083 - 1 553 2 128 - 2 524 Underlying operating profit before depreciation, amortisation and impairment losses 30 775 27 506 8 416 6 301 36 469 39 738 Operating profit (EBIT) 19 715 13 430 8 677 3 680 17 619 23 904 Items affecting comparability - 2 826 1 826 - 5 083 - 1 553 2 264 - 2 388 Underlying operating profit 16 889 15 256 3 594 2 127 19 883 21 516
- 33. 33 VATTENFALL INTERIM REPORT JANUARY–SEPTEMBER 2019 The key ratios are presented as percentages (%) or times (x). KEY RATIOS BASED ON LAST 12-MONTH VALUES OCTOBER 2018 – SEPTEMBER 2019: Operating margin, % = 100 x EBIT 23 904 = 14.3 Net sales 167 657 Operating margin excl. items = 100 x Underlying EBIT 21 516 = 12.8 affecting comparability, % Net sales 167 657 Pre-tax profit margin, % = 100 x Profit before income taxes 21 191 = 12.6 Net sales 167 657 Pre-tax profit margin excl. items = 100 x Profit before income taxes excl. items affecting comparability 18 804 = 11.2 affecting comparability, % Net sales 167 657 Return on equity, % = 100 x Profit for the period attributable to owner of the Parent Company 15 443 = 16.8 Average equity for the period attributable to owner of the 92 134 Parent Company excl. the Reserve for cash flow hedges Return on capital employed, % = 100 x EBIT 23 904 = 9.2 Capital employed, average 260 068 Return on capital employed excl. = 100 x Underlying EBIT 21 516 = 8.3 items affecting comparability, % Capital employed, average 260 068 EBIT + financial income excl. return from the Swedish Nuclear EBIT interest cover, (x) = Waste Fund 24 922 = 6.0 Financial expenses excl. discounting effects attributable to 4 179 provisions Underlying EBIT + financial income excl. Return EBIT interest cover excl. Items = from the Swedish Nuclear Waste Fund 22 534 = 5.4 affecting comparability, (x) Financial expenses excl. discounting effects attributable to 4 179 provisions FFO + financial expenses excl. FFO interest cover, (x) = discounting effects attributable to provisions 34 873 = 8.3 Financial expenses excl. discounting effects attributable to 4 179 provisions FFO + financial items net excl. discounting effects attributable FFO interest cover, net, (x) = to provisions and return from the Swedish Nuclear Waste Fund 33 855 = 10.7 Financial items net excl. discounting effects attributable to 3 161 provisions and return from the Swedish Nuclear Waste Fund
- 34. 34 VATTENFALL INTERIM REPORT JANUARY–SEPTEMBER 2019 Cash flow from operating activities less maintenance investments + financial expenses excl. Discounting Cash flow interest cover after = effects attributable to provisions and interest components related to pension costs 6 813 = 2.1maintenance investments, (x) Financial expenses excl. discounting effects attributable to 3 303 provisions and interest components related to pension costs FFO/gross debt, % = 100 x FFO 30 694 = 32.7 Interest-bearing liabilities 93 821 FFO/net debt, % = 100 x FFO 30 694 = 51.5 Net debt 59 648 FFO/adjusted net debt, % = 100 x FFO 30 694 = 24.5 Adjusted net debt 125 373 EBITDA/net financial = EBITDA 42 262 = 13.4 items, (x) Financial items net excl. discounting effects attributable to 3 161 provisions and return from the Swedish Nuclear Waste Fund EBITDA excl. items affecting = EBITDA excl. items affecting comparability 39 738 = 12.6 comparability/net financial Financial items net excl. discounting effects attributable to 3 161 items, (x) provisions and return from the Swedish Nuclear Waste Fund KEY RATIOS BASED ON THE BALANCE SHEET PER 30 SEPTEMBER 2019: Equity/total assets, % = 100 x Equity 109 461 = 24.5 Balance sheet total 446 390 Gross debt/equity, % = 100 x Interest-bearing liabilities 93 821 = 85.7 Equity 109 461 Net debt/equity, % = 100 x Net debt 59 648 = 54.5 Equity 109 461 Gross debt/gross debt = 100 x Interest-bearing liabilities 93 821 = 46.2 equity, % Interest-bearing liabilities + equity 203 282 Net debt/net debt plus = 100 x Net debt 59 648 = 35.3 equity, % Net debt + equity 169 109 Net debt/EBITDA, (x) = Net debt 59 648 = 1.4 EBITDA 42 262 Adjusted net debt/ = Adjusted net debt 125 373 = 3.0 EBITDA, (x) EBITDA 42 262
- 35. 35 VATTENFALL INTERIM REPORT JANUARY–SEPTEMBER 2019 This is information is such that Vattenfall AB is obliged to make public in accordance with the EU Market Abuse Regulation. The information was submitted for publication, through the agency of the contact persons set out above, at 08.00 CET on 29 October 2019. This report has been prepared in both Swedish and English versions. In the event of discrepancies between the two versions, the Swedish version shall govern. Interim report signature Solna, 29 October 2019 Magnus Hall President and CEO This interim report has not been reviewed by the company’s auditor. Financial calendar Year-end report 2019, 5 February 2020 Annual General Meeting, 28 April 2020 Interim report January-March, 29 April 2020 Interim report January-June, 21 July 2020 Interim report January-September, 27 October 2020 Contact information Vattenfall AB (publ) SE-169 92 Stockholm Corporate identity number 556036-2138 T +46-8-739 50 00 www.vattenfall.com www.vattenfall.se Magnus Hall President and CEO T +46-8-739 50 09 Anna Borg CFO T +46-8-739 64 28 Johan Sahlqvist Head of Investor Relations T +46-8-739 72 51 Vattenfall’s press office T +46-8-739 50 10 press@vattenfall.com