SlideShare ist ein Scribd-Unternehmen logo
1 von 38
Downloaden Sie, um offline zu lesen
1
VATTENFALL INTERIM REPORT JANUARY–JUNE 2022
Interim report
January–June 2022
KEY DATA
Jan-Jun Jan-Jun Apr-Jun Apr-Jun Full year Last 12
Amounts in SEK million unless indicated otherwise 2022 2021 2022 2021 2021 months
Net sales 107 749 80 465 48 170 34 554 180 119 207 403
Operating profit before depreciation, amortisation and
impairment losses (EBITDA)1
32 635 38 271 15 386 20 531 75 790 70 154
Operating profit (EBIT)1
24 513 29 595 11 730 16 210 60 271 55 189
Underlying EBIT1
17 610 17 308 8 107 5 256 31 181 31 483
Profit for the period 10 295 23 635 4 231 13 212 48 013 34 673
Electricity generation, TWh 55.5 58.8 24.6 26.0 111.4 108.1
Sales of electricity, TWh2
83.3 85.4 38.7 40.0 168.9 166.8
- of which, customer sales 56.8 60.2 26.0 27.9 120.5 117.1
Sales of heat, TWh 8.2 9.2 2.4 2.7 15.6 14.6
Sales of gas, TWh 28.3 34.4 8.2 10.8 57.1 51.0
Return on capital employed, %1
19.3 3
14.5 3
19.3 3
14.5 3
22.2 19.3
FFO/adjusted net debt, %1
103.0 3
38.1 3
103.0 3
38.1 3
171.2 103.0
1) See Definitions and calculations of key ratios for definitions of Alternative Performance Measures.
2) Sales of electricity also include sales to Nord Pool Spot and deliveries to minority shareholders.
3) Last 12-month values.
Business highlights, April–June 2022
• Continued high, volatile electricity prices and record-high
differences between price areas in the Nordics
• Vattenfall's largest onshore wind farm Blakliden Fäbodberget
inaugurated, and construction permit for offshore wind power
at Swedish Kriegers Flak issued
• Strategic review of Berlin district heating business
• Feasibility study to investigate construction of small modular
reactors near Ringhals
• Sale of gas-fired Magnum power plant in the Netherlands
• Inauguration together with LKAB and SSAB of HYBRIT's pilot
plant for storing fossil-free hydrogen
• New initiative with Preem to phase out fossil fuels using
offshore wind power and hydrogen
• New partnership with St1 for developing sustainable aviation
fuel.
Financial highlights, January–June 2022
• Net sales increased by 34% (31% excluding currency effects)
to SEK 107,749 million (80,465)
• Underlying operating profit1
of SEK 17,610 million (17,308)
• Operating profit1
of SEK 24,513 million (29,595)
• Profit for the period of SEK 10,295 million (23,635)
Financial highlights, April–June 2022
• Net sales increased by 39% (36% excluding currency effects)
to SEK 48,170 million (34,554)
• Underlying operating profit1
of SEK 8,107 million (5,256)
• Operating profit1
of SEK 11,730 million (16,210)
• Profit for the period of SEK 4,231 million (13,212)
Cover image: Vittjärv hydro power station, Lule River, Sweden
2
VATTENFALL INTERIM REPORT JANUARY–JUNE 2020
CEO’s comment
Vattenfall's underlying results for the first half of the year
remained unchanged from last year. A strong performance by
our wind business and an expanding customer base were
offset by the continued negative effects from price area
differences in the Nordics. In Europe there is a lot of focus on
securing gas for the upcoming winter. Therefore, the pace in
the energy transition needs to remain high. This is the only way
we can reduce fossil fuel dependency in Europe.
Turbulent electricity markets as gas sets prices
Turbulence in the electricity market increased in the second quarter.
At present, the big question is what the natural gas supply will look
like in Europe this winter with rationing becoming an increasingly
likely scenario. The uncertainty has sent electricity prices to new
record levels even as we are in the middle of the summer when
prices are usually lower. In continental Europe, prices have on
average been 3 to 4 times higher than the corresponding period in
2021. In Sweden, average prices have nearly tripled compared to
last year, but price differentials between the country’s southern and
northern regions remain big. In southern Sweden, prices are clearly
linked to continental Europe and the price of gas, while prices in the
northern areas, on average, have been comparable to 2021.
Stable underlying results dampened by price area differences
Profit for the period fell by SEK 13.3 billion to SEK 10.3 billion, which
is mainly attributable to the compensation received in 2021 for the
early decommissioning of German nuclear power. Underlying
operating profit was largely unchanged at SEK 17.6 billion for the
half-year but rose by SEK 2.9 billion to SEK 8.1 billion for the
quarter.
Our sales business is performing well. Customers choose Vattenfall
because we can manage the market uncertainty and continue to
offer contracts for electricity, heating, and gas. Our wind business is
also developing well, with new capacity from Kriegers Flak in
Denmark contributing positively. Price area differences continued
however to have a negative impact on our Nordic power portfolio.
Investing in the energy system of the future
In May, we received the construction permit for the offshore wind
farm Kriegers Flak in Sweden. And after quarter-end, we secured a
CfD contract for the first phase of the Norfolk Zone wind power
project in the UK which, when commissioned, will be the world's
largest wind power zone.
In order to ensure the energy transition in the long run, we will need
all types of fossil-free energy sources. Small modular reactors
(SMRs) have the potential to eventually add base load power and
flexibility to the energy system. That is why we have initiated a
feasibility study to evaluate the potential to build SMRs adjacent to
Ringhals nuclear power plant.
In Berlin, we have initiated a strategic review of our heat business.
The energy transition offers a multitude of opportunities, and we
need to prioritise on both project- and portfolio level.
Partnerships for industry transition
A central part of Vattenfall’s strategy is to contribute also to the
transition of other sectors. In two projects — with Preem and St1,
respectively — we are looking at opportunities to use hydrogen from
future wind farms to produce, e.g., fuels for aviation and shipping. In
early June, we inaugurated HYBRIT’s pilot plant for storing fossil-
free hydrogen together with our partners LKAB and SSAB. Efficient
and dynamic storage is an important piece of the puzzle if hydrogen
is to play an important role in reducing industry emissions.
Following a turbulent first six months, it is likely that we are facing a
tough winter here in Europe. At Vattenfall, we will use our
experience and expertise to contribute to stabilising the situation for
our customers and continue the energy transition.
Anna Borg
President and CEO
Profit for the period
First half of 2022
10.3
SEK billion
(23.6)
Underlying operating profit
First half of 2022
17.6
SEK billion
(17.3)
FFO/adjusted net debt
Last 12 months
103.0%
(38.1)
Return on capital employed
Last 12 months
19.3%
(14.5)
Gas market is in focus and emphasises
the importance of the energy transition
3
VATTENFALL INTERIM REPORT JANUARY–JUNE 2022
Group overview
Vattenfall generates electricity and heat from a portfolio of
energy sources, such as hydro and nuclear power, wind
power, and fossil fuels. We sell electricity, gas, and heat to
private customers and businesses primarily in northern
Europe. Vattenfall continuously hedges its future electricity
generation through sales in the forward and futures markets.
Market development
Electricity markets continue to be characterised by major
fluctuations triggered by developments on the Continent.
Sharply rising gas prices have resulted in record-high
electricity prices and the Nordic system price has largely
been decoupled with the hydrological development. High
average electricity prices for the first half of 2022 contributed
positively to Vattenfall’s results. But major differences
between the system price in the Nordics and the price in
respective price areas had a negative impact and resulted in
a lower achieved price after price hedges.
ELECTRICITY SPOT PRICES, EUR/MWh
The average spot price in the Nordic countries increased as a
result of higher electricity prices on the Continent, which is
primarily attributable to high prices for fuel and emissions
allowances.
Jan-Jun Apr-Jun
2022 2021 Change 2022 2021 Change
Nordics 115.6 42.0 175% 121.10 41.90 189%
Germany 185.8 55.0 238% 187.0 60.3 210%
Netherlands 201.5 56.4 257% 195.6 62.1 215%
NORDIC HYDROLOGY
Hydrological balance is a measure of the estimated energy
volume stored in the form of snow, and water reservoirs and
ground water in relation to a normal situation. Historically,
Nordic electricity prices have had a negative correlation with
the hydrological balance, since the available hydro power
capacity normally regulated what energy sources would be
used in the system. Electricity prices in the northern parts of
the Nordic countries remain linked to the hydrological balance,
while the correlation with system price and the price
development in the southern regions has decreased,
especially in the past year.
By the end of the second quarter 2022, the hydrological
balance for the Nordics was below normal levels primarily as a
result of the low reservoir levels in southern Norway.
NORDIC HYDROLOGICAL BALANCE (TWh)
However, the fill rate of Vattenfall’s water reservoirs
increased to 79% (71%), which is 19 percentage points
above normal levels. This is attributable to increased inflows
from precipitation and snowmelt, which in turn had a negative
effect on the spot price for electricity in Sweden's northern
price areas.
NORDIC PRICE AREA DIFFERENCES
The electricity market in the Nordic countries is divided into
separate price areas. Sweden has four price areas and
Vattenfall’s hydro power assets’ are mainly located in SE1
and SE2 while the nuclear power assets are located in SE3.
Vattenfall also has wind power assets in SE4. In recent years,
the differences in electricity prices between the areas have
grown wider as a result of bottlenecks in the transmission
grid, which prevents the electricity from reaching southern
regions. Moreover, new transmission connections to the
Continent have contributed further to higher prices in
southern Sweden. The Nordic system price (SYS) is a
reference price for all price areas and is calculated by the
power exchange Nord Pool.
SPOT PRICES PER PRICE AREA AND SYSTEM PRICE
(EUR/MWh)
1 Difference between SE1 and SE2 is invisible due to high correlation
The price area differentials have remained at a high level
during the first six months of 2022. In southern Sweden, the
prices increased significantly compared to last year (see
above), while the average price for northern Sweden was
relatively stable
-30
-20
-10
0
10
20
30
40
2021 2022
0
20
40
60
80
100
120
140
160
180
2019 2020 2021 2022
EUR/MWh
SE1¹ SE2¹ SE3 SE4 SYS
4
VATTENFALL INTERIM REPORT JANUARY–JUNE 2022
INDICATIVE NORDIC HEDGE PRICES AND FINANCIAL
HEDGE RATIO (SE, DK, FI) AS PER 30 JUNE 2022
Vattenfall’s price hedging strategy is focused on the Nordic
power generation assets as the dominant risk exposure is
coupled to Nordic nuclear and hydro power baseload
generation. Vattenfall hedges most volumes for the beginning
of the time horizon, with declining volumes towards the outer
years.
2022 2023 2024
EUR/MWh 25 30 34
Hedge ratio (%) 66 61 38
At the end of the first half of 2022, the price hedge ratio for
2022 stood at 66%, which is 6 percentage points lower than
the end of the first quarter of 2022. During that same time, the
price hedge level decreased to 25 EUR/MWh. The lower
hedge ratio and hedge level are attributable to Vattenfall
having adjusted its hedging strategy as a result of the major
price area differentials in Sweden.
ACHIEVED NORDIC ELECTRICITY PRICES (SE, DK,
FI)1
The achieved price is the average price that Vattenfall
received for its electricity production during the period and is
impacted by the hedge ratio and hedge price (see above), the
spot price and effects from price area differentials.
Jan-Jun Apr-Jun
Full
year
2022 2021 2022 2021 2021
EUR/MWh 18 30 15 27 31
Vattenfall's achieved price in the Nordics has decreased
significantly primarily because of major price area
differentials.
FUEL PRICES
The prices of gas, coal, and CO2 emission allowances affect
mainly Vattenfall’s heat business on the Continent. Gas
prices also affect activities within the business segment
Customers & Solutions, which is responsible for customer
sales of gas.
Jan-Jun Apr-Jun
2022 2021 Change 2022 2021 Change
Gas
(EUR/MWh)
99.1 21.7 357% 99.0 24.7 301%
Coal (USD/t) 284.5 78.6 262% 338.1 89.6 277%
CO2 (EUR/t) 83.1 43.7 90% 83.3 49.9 67%
1
Achieved prices from the spot market and hedges. Includes Nordic
hydro, nuclear and wind power generation
The price of gas and coal has increased sharply in the first
half-year 2022 as a result of the war in Ukraine. At the end of
the second quarter, Russia reduced its flow of gas to
Germany, which contributed further to higher gas prices. In
addition to high gas prices, the price of coal has been
affected by high demand in Europe, a ban on imported
Russian coal, and limited supply from Asia. The price of CO2
emission allowances rose primarily as a result of the
increased use of coal as fuel.
PRICE MARGINS
The clean spark spread is the margin between the electricity
price and the cost of gas and emissions allowances used for
its generation. The clean dark spread represents the same
relationship for coal-fired electricity generation. These
spreads affect Vattenfall’s heat business in Germany and the
Netherlands where the fossil-fired combined heat-and-power
(CHP) plants and condensing plants are located. Vattenfall
hedges these spreads in part.
CLEAN SPARK SPREAD AND CLEAN DARK SPREAD
Despite higher electricity prices, the clean spark spreads
have been negative during the first half of 2022 as a result of
higher gas prices. This has had a negative impact on
electricity generation at Vattenfall's gas-fired condensing
power plants. The clean dark spreads have been volatile for
the first half of the year and are closely linked to the electricity
price development on the Continent.
-75
-55
-35
-15
5
25
45
65
85
105
2021 2022
Clean Spark Spread NL
Clean Dark Spread DE
Clean Spark Spread DE
5
VATTENFALL INTERIM REPORT JANUARY–JUNE 2022
Generation development
Combined electricity generation declined by 3.3 TWh to 55.5
TWh (58.8) for the first half of 2022. Production from fossil-
based power declined (–2.2 TWh) as a result of lower clean
spark spreads. Generation from hydro power declined (-2.2
TWh), which was primarily related to the first quarter of 2022.
Generation from wind power increased (1.1 TWh) as a result
of new capacity, mainly related to the offshore wind farm
Kriegers Flak, as well as slightly higher generation from
existing plants.
ELECTRICITY GENERATION (TWh)
AVAILABILITY
Availability is the percentage of planned production time for
an asset with no unforeseen technical issues or maintenance-
related outages.
Jan-Jun
2022 2021
Nuclear 90.2% 91.1%
Wind - offshore 95.4% 96.1%
Wind – onshore 95.8% 96.2%
The availability of Vattenfall's nuclear power and wind power
were stable for the first half of 2022 compared to the
corresponding period of 2021.
INSTALLED WIND CAPACITY
New installed wind power capacity in the past 12 months
mainly pertains to Blakliden Fäbodberget (353 MW), Moerdijk
(20 MW of 27 MW), and Haringvliet (4 MW of 22 MW). The
comparison is affected by the partial divestments of Princess
Ariane (Wieringermeer Extension,114 MW), and divestment
of onshore wind farms in Denmark (90 MW).
30 Jun
2022
30 Jun
2021
Onshore wind 1,614 1,442
Offshore wind 2,602 2,602
Total 4,216 4,044
Sales development
Electricity sales, excluding sales to Nord Pool Spot and
deliveries to minority owners, declined by 3.4 TWh to 56.8
TWh (60.2), primarily as a result of lower volumes in the
business segment in France and in Germany. Gas sales
declined by 6.1 TWh to 28.3 TWh (34.4) as a result of warmer
weather in the Netherlands and Germany. Heat sales
declined by 1.0 TWh to 8.2 TWh (9.2) as a result of warmer
weather.
Jan-Jun Apr-Jun
2022 2021Change 2022 2021Change
Sales of
electricity to
customers , TWh
56.8 60.2 -6% 26.0 27.9 -7%
Sales of gas,
TWh
28.3 34.4 -18% 8.2 10.8 -24%
Sales of heat,
TWh
8.2 9.2 -11% 2.4 2.7 -11%
TEMPERATURE EFFECTS
Temperature impacts sales volume in the operating segments
Customers & Solutions and Heat. Lower temperatures usually
mean higher demand for heating (including gas) and
electricity. In the Nordic countries, this mainly affects sales of
electricity and heat. In Germany and the Netherlands, gas
remains the primary source of heat, which means that low
temperatures increase demand for gas in addition to
increased sales of heat.
TEMPERATURE DEVIATION FROM NORMAL LEVELS (ºC)
Jan-Jun Apr-Jun
2022 2021 2022 2021
Nordics 0.9 -0.3 0.1 0.0
Netherlands 1.2 -0.5 0.6 -1.0
Germany 1.2 -0.6 0.9 -1.0
In the first half of 2022, the temperatures in Vattenfall's
markets were higher than normal, which affected sales
negatively.
0
10
20
30
Fossil Nuclear Hydro Wind Biomass,
waste
Jan-Jun 2022 Jan-Jun 2021
6
VATTENFALL INTERIM REPORT JANUARY–JUNE 2022
Net sales
Comment January–June: Consolidated net sales increased by
SEK 27.3 billion (including positive currency effects of SEK 2.6
billion). The increase is mainly attributable to higher electricity
prices in the Netherlands, the Nordics and Germany.
Comment April–June: Consolidated net sales increased by
SEK 13.6 billion (including positive currency effects of SEK 1.3
billion). The increase is mainly attributable to higher electricity
prices in the Netherlands, the Nordics and Germany.
Earnings
Comment January–June: Underlying operating profit increased
by SEK 0.3 billion, which is explained by:
• Higher earnings contribution from the Wind operating
segment (SEK +4.7 billion) mainly owing to higher
electricity prices on the Continent as well as new capacity
• Lower earnings contribution from the Power Generation
operating segment (SEK –1.7 billion), owing to lower
achieved prices in the Nordics, decrease in nuclear power
generation, and lower realised earnings contribution from
the trading operations.
• Lower earnings contribution from the Heat operating
segment (SEK –2.9 billion) attributable mainly to higher
prices for gas, which led to lower clean spark spreads.
• Other items, net (SEK 0.2 billion).
Items affecting comparability amounted to SEK 6.9 billion
(12.3), of which most pertains to changes in market value for
energy derivatives and inventories (SEK 8.4 billion) and reversed
impairment charges (SEK 0.9 billion). Higher provisions related to
nuclear power in Sweden (SEK -2,4 billion) had a countering
effect. Profit for the period totalled SEK 10.3 billion (23.6) and
was affected by – in addition to items affecting comparability –
lower net financial items as a result of lower return from the
Swedish Nuclear Waste Fund and lower tax cost due to lower
profit before tax. The profit for the period in 2021 was affected by
compensation for the early closure of nuclear power in Germany.
Comment April–June: Underlying operating profit increased by
SEK 2.9 billion, mainly owing to positive contributions from the
Power Generation (SEK 1.5 billion) and Wind (SEK 1.5 billion)
operating segments.
Items affecting comparability amounted to SEK 3.6 billion (11.0),
of which most is attributable to changes in market value for
energy derivatives and inventories (SEK 5.2 billion) and reversed
impairment charges (SEK 0.9 billion). This was offset in part by
increased provisions for nuclear power in Sweden (SEK -2.4
billion).
Profit for the period totalled SEK 4.2 billion (13.2), and, apart
from the underlying operating profit, were affected by lower net
financial items as a result of lower return from the Swedish
Nuclear Waste Fund. The profit for the period in 2021 was
affected by compensation for the early closure of nuclear power
in Germany.
Cash flow
Comment January–June: Funds from operations (FFO)
declined by SEK 1.1 billion mainly as a result of lower operating
profit before depreciation, amortisation and impairment losses
(EBITDA). Cash flow from changes in operating capital
amounted to SEK -1.7 billion. The largest contributing factor was
related to the net change in margin calls (SEK –3.9). The change
related to CO2 emission allowances (SEK +0.7 billion) had a
countering effect
Comment April–June: Funds from operations (FFO) increased
by SEK 4.5 billion, primarily as a result of higher underlying
operating profit before depreciation, amortisation and impairment
losses (EBITDA) and lower paid tax. Cash flow from changes in
operating capital amounted to SEK 9.8 billion, which was mainly
attributable to the net change in margin calls (SEK +13.8
billion). The increase in inventories contributed negatively (SEK
5.1 billion).
Important events after the balance sheet
date
• On 7 July 2022, Vattenfall was awarded a 15-year state
subsidy through the UK support scheme “Contracts for
Difference” (CfD) for the offshore wind farm Norfolk Boreas.
KEY FIGURES – GROUP OVERVIEW
Jan-Jun Jan-Jun Apr-Jun Apr-Jun Full year Last 12
Amounts in SEK million 2022 2021 2022 2021 2021 months
Net sales 107 749 80 465 48 170 34 554 180 119 207 403
Operating profit before depreciation, amortisation and
impairment losses (EBITDA)1
32 635 38 271 15 386 20 531 75 790 70 154
Operating profit (EBIT)1
24 513 29 595 11 730 16 210 60 271 55 189
Underlying operating profit1
17 610 17 308 8 107 5 256 31 181 31 483
Items affecting comparability1
6 903 12 287 3 623 10 954 29 090 23 706
Profit for the period 10 295 23 635 4 231 13 212 48 013 34 673
Funds from operations (FFO)1
20 293 21 425 11 911 7 439 46 096 44 964
Cash flow from changes in operating assets and operating
liabilities (working capital) - 1 664 14 871 9 776 16 526 55 736 39 201
Cash flow from operating activities 18 629 36 296 21 687 23 965 101 832 84 165
1) See Definitions and calculations of key ratios for definitions of Alternative Performance Measures.
7
VATTENFALL INTERIM REPORT JANUARY–JUNE 2022
Capital structure
Cash and cash equivalents, and short-term investments decreased by SEK 18.3 billion compared with the level at 31 December
2021. Committed credit facilities consist of a EUR 2.0 billion Revolving Credit Facility that expires in November 2024 and five other
committed credit facilities totalling EUR 4.0 billion, which expire in 2023. As of 30 June 2022 available liquid assets and/or
committed credit facilities amounted to 103.7% of net sales. Vattenfall’s target is to maintain a level of no less than 10% of
consolidated net sales, but at least the equivalent of the next 90 days’ maturities
Net debt increased by SEK 15.4 billion to a net asset of SEK 29.3 billion and adjusted net debt increased by SEK 17.0 billion to
SEK 43.9 billion compared to 31 December 2021. Dividends paid increased net debt by SEK 23.4 billion, which was offset in part
by a positive cash flow after investments (SEK 8.9 billion). The adjusted net debt was also affected by higher provisions for nuclear
power (SEK 13.2 billion, net) and lower pension provisions (SEK 12.5 billion).
NET DEBT
-30
0
30
60
90
-60,000
-30,000
0
30,000
60,000
90,000
120,000
Q1
2019
Q2
2021
Q3
2021
Q4
2021
Q1
2022
Q2
2022
%
MSEK
Interest-bearing liabilities, MSEK
Net debt, MSEK
Gross debt/equity, %
Net debt/equity, %
ADJUSTED NET DEBT
0
50
100
150
200
0
30,000
60,000
90,000
120,000
150,000
Q1
2020
Q2
2021
Q3
2021
Q4
2021
Q1
2022
Q2
2022
%
MSEK
Adjusted net debt, MSEK
FFO/adjusted net debt, %
Strategic focus areas and targets for 2025
Strategic focus area Targets for 2025 Q2 2022 Outcome 2021
Driving decarbonisation with
our customers & partners
1. Customer engagement, absolute Net
Promoter Score (NPS)1
: +18 - +10
Securing a fossil-free energy
supply
2. CO2 emissions intensity2
: ≤86 gCO2e/kWh 82 82
Delivering high-performing
operations
3. Funds from operations (FFO)/adjusted net
debt3
: 22%-27%
4. Return On Capital Employed (ROCE)4
, last
12 months: ≥8%
103.0%
19.3%
171.2%
22.2%
Empowering our people 5. Lost Time Injury Frequency (LTIF)5
: ≤1.0
6. Employee engagement index 6
: ≥75%
1.3
-
1.7
75%
1) Absolute NPS is weighted 80% from Customers & Solutions and 20% from Heat, which corresponds to our customer composition. Reported on an annual basis
2) Includes CO2 and other greenhouse gases such as N2O and SF6. as well as indirect emissions from electricity and heat use (scope 2) Consolidated value where
CO2 is primarily related to the operating segment Heat. The target for 2025 is to be on track to achieving the 1.5° C target by 2030, according to SBT
3) Rolling 12-months values. Received margin calls had a significant impact on the outcome for both the first half year 2022 and for the full year 2021
4) Rolling 12-months values. Compensation for closure of nuclear power in Germany, changes in market value of energy derivatives and inventories and capital
gains from the sale of Stromnetz Berlin's had significant impact on the outcome for both the first half year 2022 and the full year 2021
5) Rolling 12-month values. LTIF (Lost Time Injury Frequency) is expressed in terms of the number of lost time work injuries per 1 million hours worked. The metric
pertains only to Vattenfall employees
6) Documentation for measurement of target achievement is derived from the results of an employee survey, which is conducted on an annual basis
8
VATTENFALL INTERIM REPORT JANUARY–JUNE 2022
Operating segments
Jan-Jun Jan-Jun Apr-Jun Apr-Jun Full year Last 12
Amounts in SEK million 2022 2021 2022 2021 2021 months
Underlying EBIT
Customers & Solutions 3 350 1 892 1 383 675 2 349 3 807
Power Generation 8 560 10 281 5 449 3 960 19 334 17 613
- of which, realised trading result 2 388 2 767 2 345 768 3 633 3 254
Wind 6 729 2 079 1 829 312 7 866 12 516
Heat - 1 400 1 543 - 495 173 - 343 - 3 286
Distribution 1 286 2 453 182 658 3 152 1 985
- of which, Distribution Germany1
— 666 — 331 666 —
- of which, Distribution Sweden 1 305 1 796 194 340 2 516 2 025
Other2
- 776 - 786 - 173 - 418 - 1 189 - 1 179
Eliminations - 139 - 154 - 68 - 104 12 27
Underlying operating profit 17 610 17 308 8 107 5 256 31 181 31 483
1) Stromnetz Berlin sold Q3 2021.
2) “Other” pertains mainly to all Staff functions, including Treasury and Shared Service Centres.
9
VATTENFALL INTERIM REPORT JANUARY–JUNE 2022
Customers & Solutions
The Customers & Solutions Business Area is responsible for
sales of electricity, gas and energy services across all of
Vattenfall’s markets.
Strong earnings development as more customers
choose Vattenfall
• Earnings positively affected by growing customer base and
lower churn
• New biogas offering for German private customers
• New partnership for charging infrastructure for electric cars
Q1–Q2: Net sales increased by 65%. Underlying operating profit
increased by 77%, mainly owing to a growing customer base in
Germany and lower churn in all of Vattenfall’s markets.
Compared to year-end 2021, Vattenfall’s total customer base
increased by 3% to 10.7 million contracts. Sales of electricity
decreased by 3% compared to the corresponding period in 2021
mainly due to lower sold volumes to electricity grid operators in
France as well as lower volumes in the retail market in the
Nordics and the Netherlands. Sales of gas decreased by 18%,
mainly due to warmer weather and lower consumption in the
Netherlands and Germany.
Q2: Net sales increased by 77%. Underlying operating profit
increased by 105%, mainly owing to a growing customer base in
Germany. This was partly countered by lower sales of gas due
to warmer weather in the Netherlands and Germany in
combination with lower sales of gas in the B2B segment in the
Netherlands.
In April, Vattenfall launched a new biogas offering for German
private customers. The gas mix contains 15% biogas and allows
customers to reduce their carbon footprint. Biogas availability
remains limited in Europe and Vattenfall will therefore, initially,
be able to offer this product to approximately 30,000 customers.
The expansion of charging infrastructure for electric cars
continues. In Germany, Vattenfall will install and operate
charging points at all parking lots operated by Q-Park. In
Sweden, Vattenfall’s partnership with the MAX hamburger chain
will be expanded with the installation of new, faster charging
points at a number of restaurants. Vattenfall will also install
charging points at the facility of Volvo Construction Equipment in
Eskilstuna.
KEY FIGURES – CUSTOMERS & SOLUTIONS
Jan-Jun Jan-Jun Apr-Jun Apr-Jun Full year Last 12
Amounts in SEK million unless indicated otherwise 2022 2021 2022 2021 2021 months
Net sales 79 418 48 044 36 791 20 793 106 560 137 934
External net sales 75 829 46 526 34 974 20 070 102 300 131 603
Underlying EBITDA 3 809 2 338 1 617 906 3 230 4 701
Underlying EBIT 3 350 1 892 1 383 675 2 349 3 807
Sales of electricity, TWh 47.5 48.7 22.0 22.2 96.1 94.9
- of which, private customers 14.7 14.1 6.0 5.7 26.8 27.4
- of which, resellers 9.7 3.5 7.3 1.8 7.9 14.1
- of which, business customers 23.1 31.1 8.7 14.7 61.4 53.4
Sales of gas, TWh 27.8 33.9 8.1 10.6 56.0 49.9
Number of employees, full-time equivalents 3 259 3 014 3 259 3 014 3 213
10
VATTENFALL INTERIM REPORT JANUARY–JUNE 2022
Power Generation
Power Generation comprises the Generation and Markets
Business Areas. The segment includes Vattenfall’s hydro and
nuclear power operations, maintenance services business, and
optimisation and trading operations including certain large
business customers. The result from hedging the Group’s net
exposure in electricity and fuel is reported in this segment.
Earnings in the first half year negatively affected by
lower achieved prices in the Nordic countries
• Feasibility study initiated for construction of small modular
reactors at Ringhals
• New agreement for delivery of nuclear fuel to the Forsmark
and Ringhals nuclear reactors
• Expanded partnership with Air Liquide for delivery of
renewable electricity from Vattenfall’s wind farm Hollandse
Kust Zuid
Q1–Q2: Net sales increased by 83%. Underlying operating profit
decreased by 17%. The decrease was mainly attributable to
lower achieved prices in the Nordic countries that were affected
by major price differences between electricity price areas in
Sweden as well as lower generation from hydro power (-2.1
TWh) and a lower realised trading result. Higher contribution
from pumped hydro storage operations in Germany had an
offsetting impact. The average electricity price rose compared to
the first half year 2021 but the achieved price decreased due to
higher price differences between electricity price areas in
Sweden.
Q2: Net sales increased by 95%. Underlying operating profit
increased by 38% mainly owing to higher realised trading result
and higher contribution from pumped hydro storage in Germany.
Lower achieved prices in the Nordic countries due to major price
differences between electricity price areas in Sweden as well as
lower generation from hydro power -0.4 TWh) had an offsetting
impact.
In order to meet the next decades’ increased power demand in
Sweden, Vattenfall is launching a feasibility study for the
construction of at least two small modular reactors (SMR) with a
capacity of 300-450 MW adjacent to the Ringhals nuclear power
plant. Work on the study will start immediately and is scheduled
to be completed by late 2023, early 2024. A future investment
decision would be conditional upon that the study concludes that
construction would be profitable and that all other conditions are
met, not least in respect of new nuclear power regulations.
Vattenfall has entered into agreements with Westinghouse and
Framatome for the long-term delivery of nuclear fuel to the
Forsmark and Ringhals reactors. These agreements are in line
with Vattenfall’s strategy to remain independent of individual
suppliers and countries.
Vattenfall has made preparations to increase output at nuclear
power reactor Forsmark 1 by just over 100 MW; half will be
ready in the autumn and the other half in 2023. Electricity
generation can be increased by the equivalent of the annual
electricity consumption of over 100,000 Swedish households
without any major technical measures. Applications to increase
power have been filed with the relevant authorities.
Vattenfall and Air Liquide are expanding their partnership
through a 15-year corporate power purchase agreement.
Starting in 2025, Vattenfall will be supplying about 500 GWh of
renewable electricity to Air Liquide from its offshore wind farm
Hollandse Kust Zuid. Air Liquide's plants in the Benelux region,
which produce gas for industry and healthcare, will be supplied
with renewable electricity throughout the agreement. This
corporate power purchase agreement is in addition to the 100
GWh agreement already concluded in 2021.
KEY FIGURES – POWER GENERATION
Jan-Jun Jan-Jun Apr-Jun Apr-Jun Full year Last 12
Amounts in SEK million unless indicated otherwise 2022 2021 2022 2021 2021 months
Net sales 89 264 48 726 39 848 20 445 126 318 166 856
External net sales 13 275 14 668 6 340 6 890 40 312 38 919
Underlying EBITDA 10 971 12 411 6 664 5 027 23 714 22 274
Underlying EBIT 8 560 10 281 5 449 3 960 19 334 17 613
- of which, realised trading result 2 388 2 767 2 345 768 3 633 3 254
Electricity generation, TWh 40.6 42.8 19.1 19.7 81.2 79.0
- of which, hydro power 19.1 21.2 9.4 9.8 40.8 38.7
- of which, nuclear power 21.5 21.6 9.7 9.9 40.4 40.3
Sales of electricity, TWh 8.2 10.5 3.5 5.2 22.2 19.9
- of which, resellers 7.3 10.0 3.1 4.9 17.5 14.8
- of which, business customers 0.9 0.5 0.4 0.3 4.7 5.1
Sales of gas, TWh 0.5 0.5 0.1 0.2 1.1 1.1
Number of employees, full-time equivalents 7 291 7 338 7 291 7 338 7 260
11
VATTENFALL INTERIM REPORT JANUARY–JUNE 2022
Wind
The Wind Business Area is responsible for the development,
construction and operation of Vattenfall’s wind farms as well as
large-scale and decentralised solar power and batteries.
Higher electricity prices and new capacity contributed to
earnings improvement
• Inauguration of Vattenfall's largest onshore wind farm
Blakliden Fäbodberget
• Construction permit for offshore wind power at Swedish
Kriegers Flak
• Acquisition of two offshore wind power projects off the coast
of Gothenburg with a total capacity of 2.8 GW
Q1–Q2: Net sales increased by 84% compared to 2021.
Underlying operating profit increased by 224% driven by higher
electricity prices on the Continent and new capacity, especially
Kriegers Flak offshore wind farm in Denmark. Electricity
generation increased by 21% driven by Kriegers Flak and
somewhat higher generation from existing assets.
Q2: Net sales increased by 76%. Underlying operating profit
increased by 487% as a result of higher electricity prices,
especially on the Continent, and new capacity, particularly
Kriegers Flak. Electricity generation increased by 9% driven by
higher generation from the offshore wind farms Sandbank and
DanTysk in Germany and new capacity from Kriegers Flak.
In May, the Swedish government issued a construction permit
for an offshore wind farm at Swedish Kriegers Flak. Vattenfall’s
application pertains to the building of 40 to 50 wind turbines with
a total capacity of 640 MW, or the annual electricity
consumption of nearly half a million Swedish households. The
next step in the process is to obtain additional permits and to
ensure the electricity grid connection on land. A potential
investment decision by Vattenfall could be taken in 2025.
Also in May, Vattenfall’s largest onshore wind farm Blakliden
Fäbodberget in Lycksele and Åsele was inaugurated. The wind
farm is co-owned with Vestas and AIP Management and has a
total capacity of 353 MW, corresponding to the electricity
consumption of 220,000 Swedish households.
Vattenfall has acquired the majority share in two offshore wind
power projects from the wind power company Zephyr
Renewable. The projects -“Vidar” and “Poseidon” - are located
off the coast of Gothenburg in Sweden and are expected to
have a capacity of 2.8 GW, corresponding to the annual
electricity consumption of more than two million Swedish
households. The wind farms will primarily consist of floating
wind turbines, which are expected to reduce the wind farms’
environmental impact while also enabling electricity production
in locations even further away from shore. Vattenfall's ownership
interest is 85%.
Vattenfall has been awarded GBP 9.3 million in innovation
funding from the UK government. The funds are earmarked for
the development of the world’s first hydrogen-generating
offshore wind turbines where the electrolyser is placed directly
on existing in-service wind turbines. The work will commence
immediately with the goal of first production already in 2025.
Vattenfall is committed to promoting a circular economy and
reducing the environmental impact throughout a product’s entire
life cycle. At the offshore wind farm Hollandse Kust Zuid which
is currently under construction, a new type of recyclable wind
turbine blades will be installed on some of the wind turbines.
The availability of this type of blades remains limited, but
Vattenfall has set a target for all wind-turbine blades to be
recyclable in 2030.
KEY FIGURES – WIND
Jan-Jun Jan-Jun Apr-Jun Apr-Jun Full year Last 12
Amounts in SEK million unless indicated otherwise 2022 2021 2022 2021 2021 months
Net sales 12 966 7 056 5 011 2 844 20 872 26 782
External net sales 2 057 2 619 289 824 7 791 7 229
Underlying EBITDA 9 679 4 768 3 322 1 709 13 451 18 362
Underlying EBIT 6 729 2 079 1 829 312 7 866 12 516
Electricity generation - wind power TWh 6.3 5.2 2.3 2.2 11.2 12.3
Sales of electricity, TWh 0.6 0.5 0.2 0.2 1.0 1.1
Number of employees, full-time equivalents 1 416 1 197 1 416 1 197 1 279
Blakliden Fäbodberget onshore wind farm, Sweden
12
VATTENFALL INTERIM REPORT JANUARY–JUNE 2022
Heat
The Heat Business Area comprises Vattenfall’s heat business
(district heating and decentral solutions) and gas-fired
condensing plants
Lower clean spark spreads affected results negatively
• Strategic review of Berlin heating activities
• Takeover of municipally owned heating company
Warmtebedrijf Rotterdam in the Netherlands (pending
authority approval)
• Sale of gas-fired Magnum power plant in the Netherlands
Q1–Q2: Net sales increased by 93%. The underlying operating
profit decreased by 191% compared with the first half of 2021,
mainly owing to higher gas prices which led to lower clean spark
spreads primarily affecting heat operations. This was partly
offset by higher heat prices following newly re-negotiated
contracts and post-hoc price adjustments for the fuel price
development. The hedging of spreads also had an offsetting
effect, which is reported under the Power Generation operating
segment. Electricity generation decreased as a result of the
lower spreads and sales of heat decreased due to higher
temperatures. Compared with year-end 2021, the number of
customers increased by 1.8% to the equivalent of 2.0 million
households1
.
Q2: Net sales increased by 76%. The underlying operating profit
decreased by 386% compared with the second quarter 2021.
Lower electricity generation following deteriorated clean spark
spreads owing to higher gas prices had a negative effect. Heat
sales decreased due to higher temperatures. Higher heat prices
had an offsetting impact as they undergo subsequent
adjustment for the increasing fuel prices.
Vattenfall has initiated a strategic review of its Berlin heat
business to assess Vattenfall’s continuing ownership.
Irrespective of the findings, Germany will remain a key market
for Vattenfall with close to 4.6 million customers in addition to
the heating business as well as extensive involvement in wind
and solar power, pumped storage and trading.
As agreed with the municipal government, Vattenfall will take
over the municipally owned heating company Warmtebedrijf
Rotterdam. The takeover covers the business in its entirety and
ensures that, following a period of uncertainty, customers will
continue to receive reliable heat deliveries at affordable prices.
Approval for the takeover is still pending before the
Netherlands Authority for Consumers and Markets and the
European Commission.
Vattenfall has agreed with RWE on the sale of the gas-fired
power plant Magnum in the Netherlands. RWE will take over
the plant as of 30 September 2022. The purchase price of EUR
500 million allows Vattenfall to invest further in the energy
transition, for example in fossil-free energy projects such as
offshore wind power and district heating and cooling. Previous
impairment losses have been reversed by an amount of SEK
0.9 billion as an effect of the transaction.
In Berlin, Vattenfall has entered into a new agreement for the
supply of district heating. Five residential properties in north-
east Berlin will be supplied via a local district heating network
with heat that is 55% produced with renewable fuel. Moreover,
the German Chancellery will be connected to Vattenfall's
district heating network. The agreement will run for ten years,
and the first delivery of heat is planned for 2024.
KEY FIGURES – HEAT
Jan-Jun Jan-Jun Apr-Jun Apr-Jun Full year Last 12
Amounts in SEK million unless indicated otherwise 2022 2021 2022 2021 2021 months
Net sales 27 964 14 470 10 373 5 887 34 759 48 253
External net sales 10 185 7 403 4 000 2 897 14 655 17 437
Underlying EBITDA 116 3 006 268 909 2 590 - 300
Underlying EBIT - 1 400 1 543 - 495 173 - 343 - 3 286
Electricity generation - TWh 8.6 10.8 3.2 4.1 19.0 16.8
- of which, fossil-based power 8.5 10.7 3.2 4.0 18.6 16.4
- of which, biomass, waste 0.1 0.1 — 0.1 0.3 0.3
Sales of electricity business customers, TWh 0.5 0.5 0.3 0.3 1.2 1.2
Sales of heat, TWh 8.2 9.2 2.4 2.7 15.6 14.6
Number of employees, full-time equivalents 3 141 3 182 3 141 3 182 3 126
1) Including decentralised energy solutions that have previously been reported separately
13
VATTENFALL INTERIM REPORT JANUARY–JUNE 2022
Distribution
The Distribution Business Area comprises Vattenfall’s electricity
distribution operations in Sweden and the UK.
Earnings comparison affected by sale of Stromnetz
Berlin in 2021
• Administrative Court of Appeal issues ruling on 2020–2023
revenue frames for electricity grid companies
• 100,000 new smart electricity meters have so far been
installed at Vattenfall’s customers
Q1–Q2: Net sales decreased by 43% compared with 2021 and
the underlying operating profit decreased by 48%. The sale of
Stromnetz Berlin on 1 July 2021 affected the net sales
comparison by SEK 5.3 billion and the underlying operating
profit negatively by SEK 0.7 billion. In addition, the underlying
operating profit was affected by a lower gross margin in the
Swedish operations, mainly owing to higher costs related to the
transmission network as well as an increase in network losses
caused by higher electricity prices.
Q2: Net sales decreased by 46%. Underlying operating profit
decreased by 72%. The sale of Stromnetz Berlin on 1 July
2021 affected the net sales comparison by SEK 2.5 billion and
the underlying operating profit negatively by SEK 0.3 billion. In
addition, the underlying operating profit was affected by a lower
gross margin in the Swedish operations, mainly owing to higher
costs for the transmission network as well as an increase in
network losses caused by higher electricity prices.
In June, the Swedish Administrative Court of Appeal issued a
ruling on the revenue frames for the electricity grid companies
for regulatory period 2020-2023. The ruling means that the
Swedish Energy Markets Inspectorate will need to decide on
new revenue frames for the regulatory period 2020-2023. It
also voids the application of previous court rulings, which
creates ambiguities for how the weighted average cost of
capital should be calculated. Vattenfall and other electricity grid
companies appealed the decision to the Supreme
Administrative Court after the end of the quarter.
In April, Vattenfall reached its first milestone with 100,000 new
smart electricity meters installed at our customers in Sweden.
The plan is for all of Vattenfall's nearly 900,000 electricity grid
customers to have the new meters by 2024. This is the second
roll-out of smart meters in Sweden. These meters will allow
customers to better manage electricity usage and enable the
use of new climate-smart services while producing a more
robust electricity grid where Vattenfall can detect and address
power outages faster.
One of the greatest challenges for the energy transition is the
long lead times for building electricity grids. Permitting
processes can take up to 10-12 years while the need is greater
than ever. In May, a final report by The Climate Law Inquiry
was issued on climate legislation, which contained several
positive proposals for the electricity grid. The technology-choice
issue, which is central for high-voltage projects, was clarified
with the enquiry committee’s recommending overhead lines as
the main alternative for power lines of 130 kV or higher.
Compensation payments for the period December-February,
which were introduced by the Swedish government and
prompted by the winter's high electricity prices, were disbursed
to customers in the spring. Most of Vattenfall's eligible
customers have received compensation while payments for the
extended compensation for March are being prepared.
Uninterrupted operation of broadband and digital
communications during extended power outages is becoming
ever more important. In the northernmost part of Sweden,
Vattenfall has inaugurated Sweden's first hydrogen-powered
fuel cell facility for broadband network reserve power in
collaboration with Ballard Power Systems and IT Norrbotten.
Vattenfall owns and is responsible for the plant’s functionality.
KEY FIGURES – DISTRIBUTION
Jan-Jun Jan-Jun Apr-Jun Apr-Jun Full year Last 12
Amounts in SEK million unless indicated otherwise 2022 2021 2022 2021 2021 months
Net sales 6 523 11 525 2 628 4 900 17 262 12 260
External net sales 6 181 9 198 2 434 3 843 14 643 11 626
Underlying EBITDA 2 541 3 973 813 1 340 5 913 4 481
Underlying EBIT 1 286 2 453 182 658 3 152 1 985
Number of employees, full-time equivalents 1 273 2 463 1 273 2 463 1 165
14
VATTENFALL INTERIM REPORT JANUARY–JUNE 2022
Other
Other pertains mainly to all Staff functions, including Treasury
and Shared Service Centres.
Net sales consist primarily of revenues attributable to
Vattenfall’s service organisations such as Shared Services, IT
and Vattenfall Insurance.
KEY FIGURES – OTHER
Jan-Jun Jan-Jun Apr-Jun Apr-Jun Full year Last 12
Amounts in SEK million unless indicated otherwise 2022 2021 2022 2021 2021 months
Net sales 4 009 3 029 2 243 1 656 6 169 7 149
External net sales 222 51 133 30 418 589
Underlying EBITDA - 348 - 358 44 - 210 - 326 - 316
Underlying EBIT - 776 - 786 - 173 - 418 - 1 189 - 1 179
Number of employees, full-time equivalents 2 927 2 763 2 927 2 763 2 792
15
VATTENFALL INTERIM REPORT JANUARY–JUNE 2022
Consolidated income statement
Jan-Jun Jan-Jun Apr-Jun Apr-Jun Full year Last 12
Amounts in SEK million 2022 2021 2022 2021 2021 months
Net sales 107 749 80 465 48 170 34 554 180 119 207 403
Cost of purchases - 55 742 - 34 116 - 21 595 - 12 602 - 87 474 - 109 100
Other external expenses - 9 406 - 9 940 - 6 291 - 6 917 - 18 450 - 17 916
Personnel expenses - 10 408 - 10 501 - 5 163 - 5 336 - 19 801 - 19 708
Other operating incomes and expenses, net 331 12 321 304 10 851 21 454 9 464
Participations in the results of associated companies 111 42 - 39 - 19 - 58 11
Operating profit before depreciation, amortisation and impairment
losses (EBITDA) 32 635 38 271 15 386 20 531 75 790 70 154
Depreciation, amortisation and impairments - 8 122 - 8 676 - 3 656 - 4 321 - 15 519 - 14 965
Operating profit (EBIT) 24 513 29 595 11 730 16 210 60 271 55 189
Financial income3
382 247 201 208 783 918
Financial expenses1,2,3
- 4 108 - 2 570 - 2 449 - 1 094 - 5 906 - 7 444
Return from the Swedish Nuclear Waste Fund - 5 884 2 763 - 3 013 1 454 4 225 - 4 422
Profit before income taxes 14 903 30 035 6 469 16 778 59 373 44 241
Income taxes - 4 608 - 6 400 - 2 238 - 3 566 - 11 360 - 9 568
Profit for the period 10 295 23 635 4 231 13 212 48 013 34 673
Attributable to owner of the Parent Company 10 260 22 877 4 478 13 002 46 828 34 211
Attributable to non-controlling interests 35 758 - 247 210 1 185 462
Supplementary information
Underlying EBITDA4
26 629 25 984 12 660 9 577 48 584 49 229
Underlying EBIT4
17 610 17 308 8 107 5 256 31 181 31 483
Financial items, net excl. discounting effects attributable
to provisions and return from the Swedish Nuclear Waste Fund - 2 728 - 1 304 - 1 748 - 381 - 3 090 - 4 514
1) Including interest components related to pension costs - 287 - 218 - 144 - 109 - 439 - 508
2) Including discounting effects attributable to provisions - 998 - 1 019 - 500 - 505 - 2 033 - 2 012
3) Items affecting comparability recognised as
financial income and expenses, net 4 - 6 4 — - 6 4
4) See note 4 for information on items affecting comparability
16
VATTENFALL INTERIM REPORT JANUARY–JUNE 2022
Consolidated statement of
comprehensive income
Jan-Jun Jan-Jun Apr-Jun Apr-Jun Full year Last 12
Amounts in SEK million 2022 2021 2022 2021 2021 months
Profit for the period 10 295 23 635 4 231 13 212 48 013 34 673
Other comprehensive income
Items that will be reclassified to profit or loss when specific conditions
are met
Cash flow hedges - changes in fair value 29 435 16 362 2 628 13 095 82 259 95 332
Cash flow hedges - dissolved against income statement - 38 567 - 3 022 - 19 545 - 1 960 - 31 553 - 67 098
Cash flow hedges - transferred to cost of hedged item 5 9 - 1 — 16 12
Hedging of net investments in foreign operations - 1 587 - 572 - 1 317 497 - 1 414 - 2 429
Translation differences, divested companies — 46 — — 697 651
Translation differences 7 626 1 332 6 278 - 1 327 3 218 9 512
Income taxes related to items that will be reclassified - 1 057 - 4 254 3 151 - 3 668 - 15 420 - 12 223
Total items that will be reclassified to profit or loss when specific
conditions are met - 4 145 9 901 - 8 806 6 637 37 803 23 757
Items that will not be reclassified to profit or loss
Remeasurement pertaining to defined benefit obligations 13 106 428 8 642 - 3 437 - 670 12 008
Income taxes related to items that will not be reclassified - 3 516 - 5 - 2 428 1 031 226 - 3 285
Total items that will not be reclassified to profit or loss 9 590 423 6 214 - 2 406 - 444 8 723
Total other comprehensive income, net after income taxes 5 445 10 324 - 2 592 4 231 37 359 32 480
Total comprehensive income for the period 15 740 33 959 1 639 17 443 85 372 67 153
Attributable to owner of the Parent Company 15 219 33 081 1 485 17 341 83 915 66 053
Attributable to non-controlling interests 521 878 154 102 1 457 1 100
17
VATTENFALL INTERIM REPORT JANUARY–JUNE 2022
Operating segments, Vattenfall Group
Jan-Jun Jan-Jun Apr-Jun Apr-Jun Full year Last 12
Amounts in SEK million 2022 2021 2022 2021 2021 months
External net sales
Customers & Solutions 75 829 46 526 34 974 20 070 102 300 131 603
Power Generation 13 275 14 668 6 340 6 890 40 312 38 919
Wind 2 057 2 619 289 824 7 791 7 229
Heat 10 185 7 403 4 000 2 897 14 655 17 437
Distribution 6 181 9 198 2 434 3 843 14 643 11 626
- of which, Distribution Germany — 3 203 — 1 559 3 203 —
- of which, Distribution Sweden 6 113 5 937 2 402 2 256 11 310 11 486
Other1
222 51 133 30 418 589
Total 107 749 80 465 48 170 34 554 180 119 207 403
Internal net sales
Customers & Solutions 3 589 1 518 1 817 723 4 260 6 331
Power Generation 75 989 34 058 33 508 13 555 86 006 127 937
Wind 10 909 4 437 4 722 2 020 13 081 19 553
Heat 17 779 7 067 6 373 2 990 20 104 30 816
Distribution 342 2 327 194 1 057 2 619 634
- of which, Distribution Germany — 2 061 — 894 2 061 —
- of which, Distribution Sweden 352 278 205 170 586 660
Other1
3 787 2 978 2 110 1 626 5 751 6 560
Eliminations - 112 395 - 52 385 - 48 724 - 21 971 - 131 821 - 191 831
Total — — — — — —
Total net sales
Customers & Solutions 79 418 48 044 36 791 20 793 106 560 137 934
Power Generation 89 264 48 726 39 848 20 445 126 318 166 856
Wind 12 966 7 056 5 011 2 844 20 872 26 782
Heat 27 964 14 470 10 373 5 887 34 759 48 253
Distribution 6 523 11 525 2 628 4 900 17 262 12 260
- of which, Distribution Germany — 5 264 — 2 453 5 264 —
- of which, Distribution Sweden 6 465 6 215 2 607 2 426 11 896 12 146
Other1
4 009 3 029 2 243 1 656 6 169 7 149
Eliminations - 112 395 - 52 385 - 48 724 - 21 971 - 131 821 - 191 831
Total 107 749 80 465 48 170 34 554 180 119 207 403
18
VATTENFALL INTERIM REPORT JANUARY–JUNE 2022
Jan-Jun Jan-Jun Apr-Jun Apr-Jun Full year Last 12
Amounts in SEK million 2022 2021 2022 2021 2021 months
Operating profit before depreciation, amortisation and impairment
losses (EBITDA)
Customers & Solutions 3 808 2 338 1 618 906 3 241 4 711
Power Generation 16 841 24 804 9 263 15 993 42 053 34 090
Wind 9 701 4 768 3 345 1 709 13 534 18 467
Heat 106 3 041 258 909 2 842 - 93
Distribution 2 551 3 972 813 1 340 5 911 4 490
- of which, Distribution Germany — 1 008 — 418 1 008 —
- of which, Distribution Sweden 2 537 2 945 807 921 4 873 4 465
Other1
- 233 - 498 157 - 222 8 197 8 462
Eliminations - 139 - 154 - 68 - 104 12 27
Total 32 635 38 271 15 386 20 531 75 790 70 154
Underlying EBITDA
Customers & Solutions 3 809 2 338 1 617 906 3 230 4 701
Power Generation 10 971 12 411 6 664 5 027 23 714 22 274
Wind 9 679 4 768 3 322 1 709 13 451 18 362
Heat 116 3 006 268 909 2 590 - 300
Distribution 2 541 3 973 813 1 340 5 913 4 481
- of which, Distribution Germany — 1 009 — 418 1 009 —
- of which, Distribution Sweden 2 528 2 946 808 921 4 874 4 456
Other1
- 348 - 358 44 - 210 - 326 - 316
Eliminations - 139 - 154 - 68 - 104 12 27
Total 26 629 25 984 12 660 9 577 48 584 49 229
Jan-Jun Jan-Jun Apr-Jun Apr-Jun Full year Last 12
Amounts in SEK million 2022 2021 2022 2021 2021 months
Operating profit (EBIT)
Customers & Solutions 3 349 1 892 1 383 675 2 446 3 903
Power Generation 14 429 22 674 8 050 14 925 39 502 31 257
Wind 6 750 2 079 1 852 312 7 919 12 590
Heat - 512 1 579 393 172 - 91 - 2 182
Distribution 1 296 2 452 182 658 3 150 1 994
- of which, Distribution Germany — 665 — 331 665 —
- of which, Distribution Sweden 1 315 1 796 193 340 2 515 2 034
Other1
- 660 - 927 - 62 - 428 7 333 7 600
Eliminations - 139 - 154 - 68 - 104 12 27
Operating profit (EBIT) 24 513 29 595 11 730 16 210 60 271 55 189
Financial income and expenses - 9 610 440 - 5 261 568 - 898 - 10 948
Profit before tax 14 903 30 035 6 469 16 778 59 373 44 241
Underlying EBIT
Customers & Solutions 3 350 1 892 1 383 675 2 349 3 807
Power Generation 8 560 10 281 5 449 3 960 19 334 17 613
Wind 6 729 2 079 1 829 312 7 866 12 516
Heat - 1 400 1 543 - 495 173 - 343 - 3 286
Distribution 1 286 2 453 182 658 3 152 1 985
- of which, Distribution Germany — 666 — 331 666 —
- of which, Distribution Sweden 1 305 1 796 194 340 2 516 2 025
Other1
- 776 - 786 - 173 - 418 - 1 189 - 1 179
Eliminations - 139 - 154 - 68 - 104 12 27
Underlying EBIT 17 610 17 308 8 107 5 256 31 181 31 483
1) “Other” pertains mainly to all Staff functions, including Treasury and Shared Service Centres.
19
VATTENFALL INTERIM REPORT JANUARY–JUNE 2022
Consolidated balance sheet
30 Jun 30 Jun 31 Dec
Amounts in SEK million 2022 2021 2021
Assets
Non-current assets
Intangible assets: non-current 17 975 16 629 17 070
Property, plant and equipment 262 981 241 617 252 828
Participations in associated companies and joint arrangements 6 585 4 685 6 110
Other shares and participations 320 301 313
Share in the Swedish Nuclear Waste Fund 47 063 51 003 52 772
Derivative assets 68 850 15 780 35 240
Deferred tax assets 7 542 10 338 8 905
Contract assets1
63 101 85
Other non-current receivables 6 091 6 534 6 118
Total non-current assets 417 470 346 988 379 441
Current assets
Inventories 46 824 19 572 41 539
Intangible assets: current 1 255 28 4 861
Trade receivables and other receivables 40 406 45 184 41 219
Contract assets1
241 439 290
Advance payments paid 10 615 1 111 8 362
Derivative assets 227 234 41 485 120 645
Prepaid expenses and accrued income 12 103 7 083 12 402
Current tax assets 1 338 791 2 717
Short-term investments 62 396 36 499 102 706
Cash and cash equivalents 90 177 20 463 68 176
Assets held for sale 5 108 21 795 —
Total current assets 497 697 194 450 402 917
Total assets 915 167 541 438 782 358
Equity and liabilities
Equity
Attributable to owner of the Parent Company 172 503 126 855 180 710
Attributable to non-controlling interests 16 432 13 005 16 472
Total equity 188 935 139 860 197 182
Non-current liabilities
Hybrid Capital 21 490 19 960 20 421
Other interest-bearing liabilities 54 453 50 917 50 839
Pension provisions 27 860 39 208 40 328
Other interest-bearing provisions 132 314 114 221 116 637
Derivative liabilities 74 096 12 120 30 307
Deferred tax liabilities 39 737 22 154 33 913
Contract liabilities1
7 695 6 902 7 422
Other noninterest-bearing liabilities 2 068 1 942 2 018
Total non-current liabilities 359 713 267 424 301 885
Current liabilities
Trade payables and other liabilities 36 143 32 402 39 241
Contract liabilities1
999 828 1 213
Advance payments received 71 837 24 751 62 790
Derivative liabilities 188 027 31 321 99 511
Accrued expenses and deferred income 14 856 10 548 18 460
Current tax liabilities 2 339 2 854 2 418
Other interest-bearing liabilities 47 960 18 857 55 148
Interest-bearing provisions 4 358 3 253 4 510
Liabilities associated with assets held for sale — 9 340 —
Total current liabilities 366 519 134 154 283 291
Total equity and liabilities 915 167 541 438 782 358
1) The presentation has been adjusted compared with information previously published in Vattenfall’s financial reports. See note 1.
20
VATTENFALL INTERIM REPORT JANUARY–JUNE 2022
SUPPLEMENTARY INFORMATION
30 Jun 30 Jun 31 Dec
Amounts in SEK million 2022 2021 2021
Calculation of capital employed
Intangible assets: current and non-current 19 230 16 657 21 931
Property, plant and equipment 262 981 241 617 252 828
Participations in associated companies and joint arrangements 6 585 4 685 6 110
Deferred and current tax assets 8 880 11 129 11 622
Non-current noninterest-bearing receivables 4 227 3 436 3 563
Contract assets 304 540 375
Inventories 46 824 19 572 41 539
Trade receivables and other receivables 40 406 45 184 41 219
Prepaid expenses and accrued income 12 103 7 083 12 402
Unavailable liquidity 1 870 4 252 3 446
Other 687 507 643
Total assets excl. financial assets 404 097 354 662 395 678
Deferred and current tax liabilities - 42 076 - 25 008 - 36 331
Other noninterest-bearing liabilities - 2 068 - 1 942 - 2 018
Contract liabilities - 8 694 - 7 730 - 8 635
Trade payable and other liabilities - 36 143 - 32 402 - 39 241
Accrued expenses and deferred income - 14 856 - 10 548 - 18 460
Other - 1 193 - 395 - 899
Total noninterest-bearing liabilities - 105 030 - 78 025 - 105 584
Other interest-bearing provisions not related to adjusted net debt1
- 14 216 - 9 818 - 9 213
Adjustment related to assets/liabilities held for sale 5 108 14 036 —
Capital employed2
289 959 280 855 280 881
Capital employed, average 285 407 273 748 271 674
Calculation of net debt
Hybrid Capital - 21 490 - 19 960 - 20 421
Bond issues and liabilities to credit institutions - 37 755 - 43 379 - 37 732
Short-term debt, commercial papers and repo - 44 036 - 4 535 - 46 189
Liabilities to associated companies - 1 066 - 984 - 1 452
Liabilities to owners of non-controlling interests - 9 945 - 11 014 - 10 747
Other liabilities - 9 611 - 9 862 - 9 867
Total interest-bearing liabilities - 123 903 - 89 734 - 126 408
Cash and cash equivalents 90 177 20 463 68 176
Short-term investments 62 396 36 499 102 706
Loans to owners of non-controlling interests in foreign Group companies 651 444 229
Net debt2
29 321 - 32 328 44 703
Calculation of adjusted gross debt and net debt
Total interest-bearing liabilities - 123 903 - 89 734 - 126 408
50% of Hybrid Capital3
10 745 9 980 10 211
Present value of pension obligations - 27 860 - 39 208 - 40 328
Provisions for gas and wind operations and other environment-related provisions - 12 451 - 11 165 - 11 687
Provisions for nuclear power (net)4
- 53 433 - 39 160 - 40 233
Margin calls received 2 581 2 923 3 340
Liabilities to owners of non-controlling interests due to consortium agreements 9 945 11 014 10 747
Adjustment related to assets/liabilities held for sale — - 1 863 —
Adjusted gross debt - 194 376 - 157 213 - 194 358
Reported cash and cash equivalents and short-term investments 152 573 56 962 170 882
Unavailable liquidity - 1 870 - 4 252 - 3 446
Adjusted cash and cash equivalents and short-term investments 150 703 52 710 167 436
Adjusted net debt2
- 43 673 - 104 503 - 26 922
1) Includes personnel-related provisions for non-pension purposes, provisions for tax and legal disputes and certain other provisions.
2) See Definitions and calculations of key ratios for definitions of Alternative Performance Measures.
3) 50% of Hybrid Capital is treated as equity by the rating agencies, which thereby reduces adjusted net debt.
4) The calculation is based on Vattenfall’s share of ownership in the respective nuclear power plants, less Vattenfall’s share in the Swedish Nuclear Waste Fund and
liabilities relating to funding of decommissioning obligations in Stade and Brokdorf. Vattenfall has the following ownership interests in the respective plants: Forsmark
66%, Ringhals 70.4%, SKB 55,8%, Brokdorf 20%, Brunsbüttel 66.7%, Krümmel 50% and Stade 33.3%. (According to a special agreement, Vattenfall is responsible for
100% of the provisions for Ringhals.)
21
VATTENFALL INTERIM REPORT JANUARY–JUNE 2022
Consolidated statement of cash flows
Jan-Jun Jan-Jun Apr-Jun Apr-Jun Full year Last 12
Amounts in SEK million 2022 2021 2022 2021 2021 months
Operating activities
Operating profit before depreciation, amortisation and impairment losses 32 635 38 271 15 386 20 531 75 790 70 154
Tax paid - 1 855 - 1 712 1 525 - 632 - 6 725 - 6 868
Capital gains/losses, net - 138 101 - 125 10 - 8 760 - 8 999
Interest received 565 176 536 116 523 912
Interest paid - 2 395 - 2 319 - 1 893 - 1 098 - 3 226 - 3 302
Other, incl. non-cash items - 8 519 - 13 092 - 3 518 - 11 488 - 11 506 - 6 933
Funds from operations (FFO) 20 293 21 425 11 911 7 439 46 096 44 964
Changes in inventories - 157 - 2 883 - 5 252 - 2 462 - 23 067 - 20 341
Changes in operating receivables 9 372 - 9 090 13 201 213 - 31 816 - 13 354
Changes in operating liabilities1
- 6 649 3 458 - 6 774 983 26 232 16 125
Margin calls1
- 3 871 23 553 13 835 18 137 88 995 61 571
Other changes - 359 - 167 - 5 234 - 345 - 4 608 - 4 800
Cash flow from changes in operating assets and operating liabilities - 1 664 14 871 9 776 16 526 55 736 39 201
Cash flow from operating activities 18 629 36 296 21 687 23 965 101 832 84 165
Investing activities
Acquisitions in Group companies1
- 173 - 3 - 173 — - 114 - 284
Investments in associated companies and other shares and participations - 29 83 — 86 - 278 - 390
Other investments in non-current assets - 9 570 - 10 781 - 4 657 - 5 391 - 25 157 - 23 946
Total investments - 9 772 - 10 701 - 4 830 - 5 305 - 25 549 - 24 620
Divestments1
253 - 24 212 40 19 579 19 856
Changes in short-term investments1
40 718 - 7 185 17 141 - 7 517 - 73 051 - 25 148
Cash flow from investing activities 31 199 - 17 910 12 523 - 12 782 - 79 021 - 29 912
Cash flow before financing activities 49 828 18 386 34 210 11 183 22 811 54 253
Financing activities
Changes in loans to owners of non-controlling interests in foreign Group
companies - 401 - 67 54 2 153 - 181
Loans raised2
46 468 5 866 864 519 51 150 91 752
Amortisation of other debt - 51 575 - 25 712 - 20 479 - 5 487 - 35 870 - 61 733
Divestment of shares in Group companies to owners of non-controlling
interests — — — — 4 025 4 025
Redemption of Hybrid Capital — - 2 837 — - 2 837 - 2 941 - 104
Issue of Hybrid Capital — 6 481 — 6 481 6 481 —
Dividends paid to owners - 23 981 - 5 124 - 23 981 - 5 124 - 5 190 - 24 047
Contribution to owners of non-controlling interests - 523 - 228 - 2 — - 601 - 896
Contribution from owners of non-controlling interests 635 11 399 — 1 786 2 410
Cash flow from financing activities - 29 377 - 21 610 - 43 145 - 6 446 18 993 11 226
Cash flow for the period 20 451 - 3 224 - 8 935 4 737 41 804 65 479
Jan-Jun Jan-Jun Apr-Jun Apr-Jun Full year Last 12
Amounts in SEK million 2022 2021 2022 2021 2021 months
Cash and cash equivalents
Cash and cash equivalents at start of period 68 176 26 074 97 719 18 170 26 074 20 463
Cash and cash equivalents included in assets held for sale — - 2 400 — - 2 400 — 2 400
Cash flow for the period 20 451 - 3 224 - 8 935 4 737 41 804 65 479
Translation differences 1 550 13 1 393 - 44 298 1 835
Cash and cash equivalents at end of period 90 177 20 463 90 177 20 463 68 176 90 177
1) The value has been adjusted compared with information previously published in Vattenfall’s financial reports. See note 1.
2) Short-term borrowings in which the duration is three months or shorter are reported net.
22
VATTENFALL INTERIM REPORT JANUARY–JUNE 2022
SUPPLEMENTARY INFORMATION
Jan-Jun Jan-Jun Apr-Jun Apr-Jun Full year Last 12
Amounts in SEK million 2022 2021 2022 2021 2021 months
Cash flow before financing activities 49 828 18 386 34 210 11 183 22 811 54 253
Change in margin calls from Treasury operations - 1 607 - 1 131 - 1 913 76 - 1 700 - 2 176
Changes in short-term investments - 40 718 7 186 - 17 141 7 518 73 051 25 147
Financing activities
Divestment of shares in Group companies to owners of non-controlling
interests — — — — 4 025 4 025
Dividends paid to owners - 23 981 - 5 124 - 23 981 - 5 124 - 5 190 - 24 047
Contribution to/from owners of non-controlling interests 112 - 217 397 — 1 185 1 514
Cash flow after dividend - 16 366 19 100 - 8 428 13 653 94 182 58 716
Analysis of change in net debt
Net debt at start of period 44 703 - 48 178 37 611 - 43 865 - 48 178 - 32 328
Cash flow after dividend - 16 366 19 100 - 8 428 13 653 94 182 58 716
Changes as a result of valuation at fair value 1 273 607 784 100 660 1 326
Changes in interest-bearing liabilities for leasing - 861 - 608 - 657 - 172 - 1 442 - 1 695
Interest-bearing liabilities/short-term investments acquired/divested — — — — - 13 - 13
Cash and cash equivalents included in assets held for sale — - 2 400 — - 2 400 — 2 400
Interest-bearing liabilities associated with assets held for sale — 106 — 106 — - 106
Translation differences on net debt 572 - 955 11 250 - 506 1 021
Net debt at end of period 29 321 - 32 328 29 321 - 32 328 44 703 29 321
Cash flow from operating activities 18 629 36 296 21 687 23 965 101 832 84 165
Maintenance investments - 4 117 - 3 689 - 1 661 - 1 412 - 11 012 - 11 440
Free cash flow1
14 512 32 607 20 026 22 553 90 820 72 725
1) See Definitions and calculations of key ratios for definitions of Alternative Performance Measures.
23
VATTENFALL INTERIM REPORT JANUARY–JUNE 2022
INVESTMENTS
Jan-Jun Jan-Jun Apr-Jun Apr-Jun Full year Last 12
Amounts in SEK million 2022 2021 2022 2021 2021 months
Electricity generation
Hydro power 249 312 141 174 795 732
Nuclear power 744 553 347 323 1 263 1 454
Gas 141 23 90 19 64 182
Wind power and solar PV 5 625 6 496 3 506 4 227 11 157 10 286
Biomass, waste 9 39 3 3 73 43
Total electricity generation 6 768 7 423 4 087 4 746 13 352 12 697
CHP/heat
Fossil-based power 257 263 70 199 1 053 1 047
Heat networks 507 575 332 392 1 511 1 443
Other 2 106 37 83 483 379
Total CHP/heat 766 944 439 674 3 047 2 869
Electricity networks
Electricity networks 2 003 2 886 1 239 1 605 5 758 4 875
Total electricity networks 2 003 2 886 1 239 1 605 5 758 4 875
Purchases of shares, shareholder contributions 202 - 80 173 - 86 400 682
Other 834 640 476 352 1 557 1 751
Total investments 10 573 11 813 6 414 7 291 24 114 22 874
Accrued investments, unpaid invoices (-)/release of accrued investments
(+) - 801 - 1 112 - 1 584 - 1 986 1 443 1 754
Cash and cash equivalents in acquired companies — — — — - 8 - 8
Total investments with cash flow effect 9 772 10 701 4 830 5 305 25 549 24 620
24
VATTENFALL INTERIM REPORT JANUARY–JUNE 2022
Consolidated statement of changes in equity
30 Jun 2022 30 Jun 2021 31 Dec 2021
Amounts in SEK million
Attributable
to owner of
the Parent
Company
Attributable
to non-
controlling
interests
Total
equity
Attributable
to owner of
the Parent
Company
Attributable
to non-
controlling
interests
Total
equity
Attributable
to owner of
the Parent
Company
Attributable
to non-
controlling
interests
Total
equity
Balance brought forward 180 710 16 472 197 182 97 724 13 468 111 192 97 724 13 468 111 192
Profit for the period 10 260 35 10 295 22 877 758 23 635 46 828 1 185 48 013
Cash flow hedges - changes in fair value 29 435 — 29 435 16 362 — 16 362 82 259 — 82 259
Cash flow hedges - dissolved against
income statement - 38 567 — - 38 567 - 3 038 16 - 3 022 - 31 569 16 - 31 553
Cash flow hedges - transferred to cost of
hedged item 5 — 5 9 — 9 16 — 16
Hedging of net investments in foreign
operations - 1 587 — - 1 587 - 572 — - 572 - 1 414 — - 1 414
Translation differences, divested companies — — — 46 — 46 697 — 697
Translation differences 7 140 486 7 626 1 225 107 1 332 2 983 235 3 218
Remeasurement pertaining to defined
benefit obligations 13 106 — 13 106 428 — 428 - 700 30 - 670
Income taxes related to other
comprehensive income - 4 573 — - 4 573 - 4 256 - 3 - 4 259 - 15 185 - 9 - 15 194
Total other comprehensive income for
the period 4 959 486 5 445 10 204 120 10 324 37 087 272 37 359
Total comprehensive income for the
period 15 219 521 15 740 33 081 878 33 959 83 915 1 457 85 372
Dividends paid to owners - 23 414 - 675 - 24 089 - 4 000 - 1 124 - 5 124 - 4 000 - 1 190 - 5 190
Group contributions from(+)/to(-) owners of
non-controlling interests — — — — — — — 51 51
Changes in ownership in Group companies
on divestments of shares to owners of non-
controlling interests — — — — — — 2 538 1 508 4 046
Contribution to/from owners of non-
controlling interests — 112 112 — - 217 - 217 — 1 185 1 185
Other changes in ownership — 2 2 — — — — — —
Other changes - 12 — - 12 50 — 50 533 - 7 526
Total transactions with equity holders - 23 426 - 561 - 23 987 - 3 950 - 1 341 - 5 291 - 929 1 547 618
Balance carried forward 172 503 16 432 188 935 126 855 13 005 139 860 180 710 16 472 197 182
- Of which, Reserve for hedges 26 458 8 26 466 10 934 8 10 942 36 968 8 36 976
25
VATTENFALL INTERIM REPORT JANUARY–JUNE 2022
Key ratios, Vattenfall Group
Jan-Jun Jan-Jun Apr-Jun Apr-Jun Full year Last 12
In % unless otherwise stated. (x) means times1
2022 2021 2022 2021 2021 months
Operating margin 22.8 36.8 24.4 46.9 33.5 26.6
Operating margin2
16.3 21.5 16.8 15.2 17.3 15.2
Pre-tax profit margin 13.8 37.3 13.4 48.6 33.0 21.3
Pre-tax profit margin2
7.4 22.1 5.9 16.9 16.8 9.9
Return on equity 23.53
30.33
23.53
30.33
36.9 23.5
Return on capital employed 19.33
14.53
19.33
14.53
22.2 19.3
Return on capital employed2
11.03
11.03
11.03
11.03
11.5 11.0
EBIT interest cover, (x) 10.33
12.13
10.33
12.13
15.8 10.3
EBIT interest cover, (x)2
6.03
9.33
6.03
9.33
8.3 6.0
FFO interest cover, (x) 9.33
13.13
9.33
13.13
12.9 9.3
FFO interest cover, net (x) 11.03
14.73
11.03
14.73
15.9 11.0
Cash flow interest cover after maintenance investments, (x) 15.83
33.53,4
15.83
33.53,4
27.44
15.8
FFO/gross debt 36.33
44.33
36.33
44.33
36.5 36.3
FFO/net debt - 153.43
123.13
- 153.43
123.13
- 103.1 - 153.4
FFO/adjusted net debt 103.03
38.13
103.03
38.13
171.2 103.0
EBITDA/net financial items, (x) 12.0 29.3 8.8 53.9 24.5 15.5
EBITDA/net financial items, (x)2
9.8 19.9 7.2 25.1 15.7 10.9
Equity/Total assets 20.6 25.8 20.6 25.8 25.2 20.6
Gross debt/equity 65.6 64.2 65.6 64.2 64.1 65.6
Net debt/equity - 15.5 23.1 - 15.5 23.1 - 22.7 - 15.5
Gross debt/gross debt plus equity 39.6 39.1 39.6 39.1 39.1 39.6
Net debt/net debt plus equity - 18.4 18.8 - 18.4 18.8 - 29.3 - 18.4
Net debt/EBITDA, (x) - 0.43
0.53
- 0.43
0.53
- 0.6 - 0.4
Adjusted net debt/EBITDA, (x) 0.63
1.83
0.63
1.83
0.4 0.6
1) See Definitions and calculations of key ratios for definitions of Alternative Performance Measures.
2) Based on Underlying operating profit.
3) Last 12-month values.
4) The value has been adjusted compared with information previously published in Vattenfall’s financial reports.
26
VATTENFALL INTERIM REPORT JANUARY–JUNE 2022
Quarterly information, Vattenfall Group
Q2 Q1 Q4 Q3 Q2 Q1
Amounts in SEK million 2022 2022 2021 2021 2021 2021
Income statement
Net sales 48 170 59 579 63 529 36 125 34 554 45 911
Operating profit before depreciation, amortisation and impairment losses
(EBITDA) 15 386 17 249 10 226 27 293 20 531 17 740
Underlying EBITDA 12 660 13 970 13 452 9 149 9 577 16 408
Operating profit (EBIT) 11 730 12 783 7 750 22 926 16 210 13 385
Underlying EBIT 8 107 9 504 9 092 4 782 5 256 12 053
Profit before income taxes 6 469 8 433 7 156 22 182 16 778 13 257
Profit for the period 4 231 6 064 6 101 18 277 13 212 10 423
- of which, attributable to owner of the Parent Company 4 478 5 782 5 774 18 178 13 002 9 875
- of which, attributable to non-controlling interests - 247 282 327 99 210 548
Balance sheet
Capital employed 289 959 276 749 280 881 255 184 280 855 271 110
Net debt 29 321 37 611 44 703 47 348 - 32 328 - 43 865
Cash flow
Funds from operations (FFO) 11 911 8 382 18 616 6 054 7 439 13 987
Cash flow from operating activities 9 776 - 3 058 4 312 1
61 223 1
23 965 1
12 331 1
Cash flow from investing activities 12 523 18 676 - 45 872 1
- 15 238 1
- 12 782 1
- 5 128 1
Cash flow from financing activities - 43 145 13 768 41 855 - 1 252 - 6 446 - 15 164
Cash flow for the period - 8 935 29 386 295 44 733 4 737 - 7 961
Free cash flow 20 026 - 5 514 516 1
57 696 1
22 553 1
10 054 1
1) The value has been adjusted compared with information previously published in Vattenfall’s financial reports.
Q2 Q1 Q4 Q3 Q2 Q1
In % unless otherwise stated. (x) means times1
2022 2022 2021 2021 2021 2021
Key ratios
Return on equity 23.5 31.0 36.9 40.2 30.3 10.0
Return on capital employed2
19.3 21.8 22.2 22.4 14.5 5.9
Return on capital employed2, 3
11.0 10.5 11.5 11.7 11.0 9.9
EBIT interest cover, (x)2
10.3 14.9 15.8 16.6 12.1 5.1
EBIT interest cover, (x)2, 3
6.0 7.3 8.3 8.7 9.3 8.6
FFO/gross debt2
36.3 28.8 36.5 46.0 44.3 40.0
FFO/net debt2
- 153.4 - 107.7 - 103.1 - 82.0 123.1 83.8
FFO/adjusted net debt2
103.0 120.5 171.2 182.7 38.1 32.8
Equity/Total assets 20.6 24.4 25.2 27.8 25.8 26.8
Gross debt/equity 65.6 66.7 64.1 44.2 64.2 72.0
Net debt/equity - 15.5 - 17.9 - 22.7 - 24.8 23.1 34.4
Net debt/net debt plus equity - 18.4 - 21.8 - 29.3 - 32.9 18.8 25.6
Net debt/EBITDA, (x)2
- 0.4 - 0.5 - 0.6 - 0.6 0.5 0.9
Adjusted net debt/EBITDA, (x)2
0.6 0.4 0.4 0.3 1.8 2.4
1) See Definitions and calculations of key ratios for definitions of Alternative Performance Measures.
2) Last 12-month values.
3) Based on Underlying operating profit.
27
VATTENFALL INTERIM REPORT JANUARY–JUNE 2022
NOTE 1 | Accounting policies, risks and uncertainties
Accounting policies
This interim report for the Group has been prepared in accordance with
IAS 34 – “Interim Financial Reporting”, and the Swedish Annual
Accounts Act. The accounting policies and calculation methods applied
in this interim report are the same as those described in Vattenfall’s 2021
Annual and Sustainability Report in Note 3 to the consolidated accounts,
Accounting policies. Amended IFRSs endorsed by the EU for application
in the 2022 financial year have no significant effect on Vattenfall’s
financial statements.
Risks and uncertainties
For a description of risks, uncertainties and risk management, please
refer to Vattenfall’s 2021 Annual and Sustainability Report, pages 62-71.
Vattenfall continues to face high credit exposures in Business Area
Markets. High market prices and volatility levels in the European
commodity markets seen already in the second half of 2021 continued
into first half of 2022. This was amplified further by the Russian invasion
of Ukraine at the end of February which especially impacted the gas
market where continued low gas storage levels in combination with the
EU proposal for minimum gas storage fills and Russia's announcement
to only accept Ruble as currency for energy purchases as of April 2022
has led to increased uncertainty.
A reduction, or stop, of gas deliveries from Russia to Europe will have a
negative effect on Vattenfall’s operations in Business Areas Heat,
Customers & Solutions as well as Markets. Countries with low capacity to
import Liquid Natural Gas (LNG), such as Germany, will be particularly
affected.
Furthermore, risks and uncertainties can arise from regulatory
interventions, but these cannot yet be specified.
The war in Ukraine
Vattenfall has assessed potential effects on its financial statements as
per the first half year 2022 due to Russia’s invasion of Ukraine. Vattenfall
has no operations and participations either in Ukraine or the countries
currently under sanctions, respectively. Implications on Vattenfall’s long-
term view are continuously evaluated. However, the war in Ukraine has
not materially changed Vattenfall’s long term outlook for Vattenfall’s
markets in a negative way. Hence, this is not regarded as a triggering
event for an impairment test in the second quarter. One of the main risks
for Vattenfall are defaults by customers and counterparties caused by the
continued high electricity and commodity prices. The development is
closely monitored and if necessary Expected Credit Losses are adjusted
in future periods.
The credit risk of counterparties is minimized to a large extent through
margin securities. Due to the strong increase in electricity prices,
counterparties had to provide margin securities to Vattenfall. Conversely,
if electricity prices were to fall significantly, Vattenfall would have to fund
a large outflow of cash for margin securities.
Presentation of financial statements
In the interim reports for 2022 the following amendments in the
presentations were made compared to Vattenfall’s 2021 Annual and
Sustainability Report:
• In the balance sheet contractual assets and liabilities are divided
into short- and long-term contractual assets and liabilities
respectively.
• In the cash flow statement acquisitions in group companies as well
as divestments are shown as the net of acquisition price and cash
in acquired companies and the net of sales price and cash in
divested companies respectively. In addition, changes in margin
calls from the treasury operations, which were previously included
in short term investments in cash flow from investments as well as
changes in operating liabilities, are included in Margin calls related
to derivatives.
Other
Significant related-party transactions are described in Note 44 to the
consolidated accounts in Vattenfall’s 2021 Annual and Sustainability
Report. No material changes have taken place in relations or
transactions with related parties since the publication.
NOTE 2 | Exchange rates
KEY EXCHANGE RATES APPLIED IN THE ACCOUNTS OF THE VATTENFALL GROUP
Jan-Jun Jan-Jun Apr-Jun Apr-Jun Full year
2022 2021 2022 2021 2021
Average rate
EUR 10.4590 10.1312 10.4670 10.1586 10.1469
DKK 1.4059 1.3622 1.4070 1.3660 1.3644
GBP 12.4055 11.6450 12.3329 11.8168 11.7820
USD 9.5913 8.4030 9.8041 8.4870 8.5687
30 Jun 30 Jun 31 Dec
2022 2021 2021
Balance sheet date rate
EUR 10.7300 10.1110 10.2503
DKK 1.4424 1.3597 1.3784
GBP 12.5029 11.7837 12.1987
USD 10.3302 8.5081 9.0502
28
VATTENFALL INTERIM REPORT JANUARY–JUNE 2022
NOTE 3 | Financial instruments by measurement category and related effects on income
For assets and liabilities with a remaining maturity less than three
months (e.g., cash and bank balances, trade receivables and other
receivables and trade payables and other payables), fair value is
considered to be equal to the carrying amount. For Other shares and
participations the fair value is approximated by using cost.
The carrying amounts of financial assets measured at amortised cost do
not differ significantly from their fair values. The difference between
carrying amounts and fair values for financial liabilities measured at
amortised cost amounts to SEK -1,365 million (31 December 2021:
8,509).
Financial instruments that are measured at fair value on the balance
sheet are described below according to the fair value hierarchy (levels),
which in IFRS 13 is defined as:
Level 1: Quoted prices (unadjusted) in active markets for identical assets
or liabilities.
Level 2: Inputs other than quoted prices included in Level 1 that are
observable for the asset or liability, either directly (that is, as prices) or
indirectly (that is, derived from prices). In Level 2 Vattenfall reports
mainly commodity derivatives, currency-forward contracts and interest
rate swaps.
Level 3: Inputs for the asset or liability that are not based on observable
market data (that is, unobservable inputs).
FINANCIAL ASSETS AND LIABILITIES THAT ARE MEASURED AT FAIR VALUE ON THE BALANCE SHEET AT 30 JUNE 2022
Amounts in SEK million Level 1 Level 2 Level 3 Total
Assets
Share in the Swedish Nuclear Waste Fund 47 063 — — 47 063
Derivative assets — 293 823 2 261 296 084
Short-term investments, cash equivalents and other shares and participations 65 744 6 213 — 71 957
Total assets 112 807 300 036 2 261 415 104
Liabilities
Derivative liabilities — 262 123 — 262 123
Total liabilities — 262 123 — 262 123
FINANCIAL ASSETS AND LIABILITIES THAT ARE MEASURED AT FAIR VALUE ON THE BALANCE SHEET AT 31 DECEMBER
2021
Amounts in SEK million Level 1 Level 2 Level 3 Total
Assets
Share in the Swedish Nuclear Waste Fund 52 772 — — 52 772
Derivative assets — 154 744 1 141 155 885
Short-term investments, cash equivalents and other shares and participations 116 013 11 404 — 127 417
Total assets 168 785 166 148 1 141 336 074
Liabilities
Derivative liabilities — 129 818 — 129 818
Total liabilities — 129 818 — 129 818
29
VATTENFALL INTERIM REPORT JANUARY–JUNE 2022
NOTE 4 | Items affecting comparability
Items affecting comparability include capital gains and capital losses from sale of shares and other non-current assets, impairment
losses and reversed impairment losses and other material items that are of an infrequent nature. Also included here are, for trading
activities, changes in the fair value of energy derivatives, which according to IFRS 9 cannot be recognised using hedge accounting
and changes in the fair value of inventories.
Jan-Jun Jan-Jun Apr-Jun Apr-Jun Full year Last 12
Amounts in SEK million 2022 2021 2022 2021 2021 months
Items affecting comparability 6 903 12 287 3 623 10 954 29 090 23 706
- of which, capital gains 204 41 187 - 7 8 960 9 123
- of which, capital losses - 66 - 142 - 63 - 3 - 199 - 123
- of which, impairment losses - 1 — - 1 — - 38 - 39
- of which, reversed impairment losses 898 — 898 — 1 922 2 820
- of which, provisions - 2 551 - 2 452 - 2 551 - 2 452 - 3 785 - 3 884
- of which, changes in the fair value of energy derivatives 5 210 2 745 400 2 267 8 715 11 180
- of which, changes in the fair value of inventories 3 209 156 4 750 318 1 313 4 366
- of which, other non-recurring items affecting comparability — 11 939 3 10 831 12 202 263
Items affecting comparability during the first half of 2022
amounted to SEK 6.9 billion, most of which pertains to changes
in market value for energy derivatives and inventories (SEK 8.4
billion) and provisions in nuclear operations (SEK -2.6 billion).
The reversed impairment losses relates to gas-fired condensing
plants in Business Area Heat.
Items affecting comparability during the first half of 2021
amounted to SEK 12.3 billion, most of which pertains to result
from sale of and compensation for Nuclear production rights in
Germany (SEK 12.5 billion), and changes in market value for
energy derivatives and inventories (SEK 2.9 billion). The
increase in provisions pertains to the nuclear operations (SEK -
2.5 billion). Capital gains and losses pertain mainly to smaller
divestments in Business Area Wind (SEK -0.1 billion).
30
VATTENFALL INTERIM REPORT JANUARY–JUNE 2022
NOTE 5 | Acquired and divested operations
Acquired operations
On 17th
of June 2022 Vattenfall acquired 85% of the shares in Zephyr
Vind AB. The total purchase price for the shares was SEK 173 million,
and the value of total net assets acquired is SEK 9 million.
31
VATTENFALL INTERIM REPORT JANUARY–JUNE 2022
The Parent Company Vattenfall AB
Accounting policies
The Parent Company Vattenfall AB’s accounts are prepared in
accordance with the Swedish Annual Accounts Act and recommendation
RFR 2 – Accounting for Legal Entities, issued by the Swedish Financial
Reporting Board. The accounting policies used in this interim report are
the same as those described in Vattenfall’s 2021 Annual and
Sustainability Report, Note 3 to the Parent Company accounts,
Accounting policies. New accounting policies applicable from 1 January
2022 has had no significant effect on the Parent Company’s financial
statements.
January – June 2022
A condensed income statement and balance sheet for the Parent
Company are presented below.
• Net sales amounted to SEK 17,656 million (20,286).
• Profit before appropriations and income taxes was SEK -35,149
million (1,979).
• The lower operating profit are mainly attributable to changes in
market value for energy derivatives. In addition, the Parent
Company is charged with increased commitments for future
decommissioning of Ringhals and Forsmark resulting from
increased provisions for those group companies and the negative
development of the share in the Swedish Nuclear Waste Fund.
• The improved net financial items refers to dividends from group
companies, mainly from Vattenfall GmbH.
• The balance sheet total was SEK 413,822 million (31 December
2021: 468,482).
• Cash and cash equivalents, and short-term investments amounted
to SEK 109,712 million (31 December 2021: 145,743).
• Dividend paid to the owner of SEK 23 414 million (4,000).
Risks and uncertainties
See Note 1 to the consolidated accounts, Accounting policies, risks and
uncertainties.
Other
The owners to the Swedish nuclear companies are required to provide
security to the Swedish state as a guarantee that sufficient funds exist to
cover the future costs of nuclear waste management. The security is
provided in the form of guarantee commitments from the owners of the
nuclear power companies and includes both financial and supplementary
security.The state has during the first six month during 2022 decided to
increase the levels of the security. The effect for Vattenfall AB will be an
increase of 14,7 billion SEK.
Significant related-party transactions are described in Note 44 to the
consolidated accounts, Related party disclosures, in Vattenfall’s 2021
Annual and Sustainability Report. No material changes have taken place
in relations or transactions with related parties compared with the
description in Vattenfall’s 2021 Annual and Sustainability Report.
32
VATTENFALL INTERIM REPORT JANUARY–JUNE 2022
Parent Company income statement
Jan-Jun Jan-Jun Full year Last 12
Amounts in SEK million 2022 2021 2021 months
Net sales 17 656 20 286 40 045 37 415
Cost of purchases related to production - 61 365 - 16 589 - 37 035 - 81 811
Other external expenses - 2 620 - 2 205 - 5 250 - 5 665
Personnel expenses - 1 827 - 1 151 - 2 247 - 2 923
Other operating incomes and expenses, net - 32 - 32 - 52 - 52
Operating profit before depreciation, amortisation and impairment losses (EBITDA) - 48 188 309 - 4 539 - 53 036
Depreciation, amortisation and impairments - 329 - 317 - 629 - 641
Operating profit (EBIT) - 48 517 - 8 - 5 168 - 53 677
Result from participations in subsidiaries 15 757 2 206 2 231 15 782
Result from participations in associated companies - 61 — 1 - 60
Other financial income 950 978 1 537 1 509
Other financial expenses - 3 278 - 1 197 - 2 820 - 4 901
Profit before appropriations and income taxes - 35 149 1 979 - 4 219 - 41 347
Appropriations 2 290 713 5 086 6 663
Profit before income taxes - 32 859 2 692 867 - 34 684
Income taxes 9 685 - 119 445 10 249
Profit for the period - 23 174 2 573 1 312 - 24 435
33
VATTENFALL INTERIM REPORT JANUARY–JUNE 2022
Parent Company balance sheet
30 Jun 30 Jun 31 Dec
Amounts in SEK million 2022 2021 2021
Assets
Non-current assets
Intangible assets: non-current 302 348 330
Property, plant and equipment 6 906 6 618 7 003
Shares and participations 166 963 161 477 166 802
Deferred tax assets 11 981 1 208 2 272
Other non-current receivables 71 151 68 545 71 123
Total non-current assets 257 303 238 196 247 530
Current assets
Inventories 284 335 342
Intangible assets: current 13 4 9
Current receivables group 6 237 9 948 59 366
Current receivables 39 185 7 217 13 791
Current tax assets 1 088 — 1 701
Short-term investments 61 582 35 652 101 877
Cash and cash equivalents 48 130 17 341 43 866
Total current assets 156 519 70 497 220 952
Total assets 413 822 308 693 468 482
Equity, provisions and liabilities
Equity
Restricted equity
Share capital (131,700,000 shares with a share quota value of SEK 50) 6 585 6 585 6 585
Revaluation reserve 37 989 37 989 37 989
Other reserves 1 363 1 349 1 370
Non-restricted equity
Retained earnings 42 816 66 209 64 911
Profit for the period - 23 174 2 573 1 312
Total equity 65 579 114 705 112 167
Untaxed reserves 4 878 12 628 7 168
Provisions 6 077 5 086 5 621
Non-current liabilities
Hybrid capital 21 490 19 960 20 421
Other interest-bearing liabilities group 222 10 1 573
Other interest-bearing liabilities 46 483 36 976 37 902
Other noninterest-bearing liabilities group 12 590 12 488 12 590
Other noninterest-bearing liabilities 8 585 275 279
Total non-current liabilities 89 370 69 709 72 765
Current liabilities
Other interest-bearing liabilities group 151 711 79 195 197 355
Other interest-bearing liabilities 49 365 18 638 54 960
Current tax liabilities — 183 —
Other noninterest-bearing liabilities group 1 249 2 629 4 521
Other noninterest-bearing liabilities 45 593 5 920 13 925
Total current liabilities 247 918 106 565 270 761
Total equity, provisions and liabilities 413 822 308 693 468 482
34
VATTENFALL INTERIM REPORT JANUARY–JUNE 2022
Definitions and calculations of key ratios
Alternative Performance Measures
In order to ensure a fair presentation of the Group’s operations, the
Vattenfall Group uses a number of Alternative Performance Measures
that are not defined in IFRS or in the Swedish Annual Accounts Act. The
Alternative Performance Measures that Vattenfall uses are described
below, including their definitions and how they are calculated. The
Alternative Performance Measures used are unchanged compared with
earlier periods.
Definition
EBIT: Operating profit (Earnings Before Interest and Tax)
EBITDA: Operating profit before depreciation, amortisation and impairment losses (Earnings Before Interest, Tax,
Depreciation and Amortisation)
Items affecting comparability: Capital gains and capital losses from shares and other non-current assets, impairment losses and reversed
impairment losses and other material items that are of an infrequent nature. Also included here are, for trading
activities, changes in the fair value of energy derivatives, which according to IFRS 9 cannot be recognised using
hedge accounting and changes in the fair value of inventories. See Consolidated income statement for a
specification of items affecting comparability.
Underlying EBITDA: Underlying operating profit before depreciation, amortisation and impairment losses. This measure is intended to
provide a better view on the operating result by excluding items affecting comparability that are of an infrequent
nature, while also excluding non-cash depreciation and amortisation.
Underlying operating profit: Operating profit (EBIT) excluding items affecting comparability. This measure is intended to provide a better view
on the operating result by excluding items affecting comparability that are of an infrequent nature.
FFO: Funds From Operations, see Consolidated statement of cash flow
Free cash flow: Cash flow from operating activities less maintenance investments
Interest-bearing liabilities See Consolidated balance sheet - Supplementary Information
Net debt: See Consolidated balance sheet - Supplementary Information
Adjusted net debt: See Consolidated balance sheet - Supplementary Information
Capital employed: Total assets less financial assets, noninterest-bearing liabilities and certain other interest-bearing provisions not
included in adjusted net debt. see Consolidated balance sheet - Supplementary Information
Other definitions Definition
Hybrid Capital: Perpetual subordinated securities, junior to all Vattenfall’s unsubordinated debt instruments.
LTIF: Lost Time Injury Frequency (LTIF) is expressed in terms of the number of lost time work injuries (per 1 million
hours worked), i.e., work-related accidents resulting in absence longer than one day, and accidents resulting in
fatality.
CALCULATION OF EBITDA, UNDERLYING EBITDA AND UNDERLYING EBIT
Jan-Jun Jan-Jun Apr-Jun Apr-Jun Full year Last 12
Amounts in SEK million 2022 2021 2022 2021 2021 months
Operating profit (EBIT) 24 513 29 595 11 730 16 210 60 271 55 189
Depreciation, amortisation and impairment losses - 8 122 - 8 676 - 3 656 - 4 321 - 15 519 - 14 965
Operating profit before depreciation, amortisation and impairment
losses (EBITDA) 32 635 38 271 15 386 20 531 75 790 70 154
Items affecting comparability excl. impairment losses and reversed
impairment losses - 6 006 - 12 287 - 2 726 - 10 954 - 27 206 - 20 925
Underlying operating profit before depreciation, amortisation and
impairment losses 26 629 25 984 12 660 9 577 48 584 49 229
Operating profit (EBIT) 24 513 29 595 11 730 16 210 60 271 55 189
Items affecting comparability - 6 903 - 12 287 - 3 623 - 10 954 - 29 090 - 23 706
Underlying operating profit 17 610 17 308 8 107 5 256 31 181 31 483
35
VATTENFALL INTERIM REPORT JANUARY–JUNE 2022
The key ratios are presented as percentages (%) or times (x).
KEY RATIOS BASED ON CONTINUING OPERATIONS AND LAST 12-MONTH VALUES JULY 2021 – JUNE 2022
Operating margin, % = 100 x
EBIT 55 189
= 26.6
Net sales 207 403
Operating margin excl. items
= 100 x
Underlying EBIT 31 483
= 15.2
affecting comparability, % Net sales 207 403
Pre-tax profit margin, % = 100 x
Profit before income taxes 44 241
= 21.3
Net sales 207 403
Pre-tax profit margin excl. items
= 100 x
Profit before income taxes excl. items affecting comparability 20 531
= 9.9
affecting comparability, % Net sales 207 403
Return on equity, % = 100 x
Profit for the period attributable to owner of the Parent Company 34 211
= 23.5
Average equity for the period attributable to owner of the 145 294
Parent Company excl. the Reserve for cash flow hedges
Return on capital employed, % = 100 x
EBIT 55 189
= 19.3
Capital employed, average 285 407
Return on capital employed excl.
= 100 x
Underlying EBIT 31 483
= 11.0
items affecting comparability, % Capital employed, average 285 407
EBIT interest cover, (x) =
EBIT + financial income 56 107
= 10.3
Financial expenses excl. discounting effects attributable to 5 432
provisions
EBIT interest cover excl. Items = Underlying EBIT + financial income 32 401 = 6.0
affecting comparability, (x) Financial expenses excl. discounting effects attributable to 5 432
provisions
FFO + financial expenses excl.
FFO interest cover, (x) =
discounting effects attributable to provisions 50 396
= 9.3
Financial expenses excl. discounting effects attributable to 5 432
provisions
FFO + financial items net excl. discounting effects attributable
FFO interest cover, net, (x) =
to provisions and return from the Swedish Nuclear Waste Fund 49 478
= 11.0
Financial items net excl. discounting effects attributable to 4 514
provisions and return from the Swedish Nuclear Waste Fund
36
VATTENFALL INTERIM REPORT JANUARY–JUNE 2022
Cash flow from operating activities less maintenance
investments + financial expenses excl. Discounting
Cash flow interest cover after
=
effects attributable to provisions and interest components
related to pension costs 77 649
= 15.8
maintenance investments, (x) Financial expenses excl. discounting effects attributable to 4 924
provisions and interest components related to pension costs
FFO/gross debt, % = 100 x
FFO 44 964
= 36.3
Interest-bearing liabilities 123 903
FFO/net debt, % = 100 x
FFO 44 964
= -153.4
Net debt -29 321
FFO/adjusted net debt, % = 100 x
FFO 44 964
= 103.0
Adjusted net debt 43 673
EBITDA/net financial
=
EBITDA 70 154
= 15.5
items, (x) Financial items net excl. discounting effects attributable to 4 514
provisions and return from the Swedish Nuclear Waste Fund
EBITDA excl. items affecting
=
EBITDA excl. items affecting comparability 49 229
= 10.9
comparability/net financial Financial items net excl. discounting effects attributable to 4 514
items, (x) provisions and return from the Swedish Nuclear Waste Fund
KEY RATIOS BASED ON THE BALANCE SHEET PER 30 JUNE 2022
Equity/total assets, % = 100 x
Equity 188 935
= 20.6
Balance sheet total 915 167
Gross debt/equity, % = 100 x
Interest-bearing liabilities 123 903
= 65.6
Equity 188 935
Net debt/equity, % = 100 x
Net debt -29 321
= -15.5
Equity 188 935
Gross debt/gross debt
= 100 x
Interest-bearing liabilities 123 903
= 39.6
equity, % Interest-bearing liabilities + equity 312 838
Net debt/net debt plus
= 100 x
Net debt -29 321
= -18.4
equity, % Net debt + equity 159 614
Net debt/EBITDA, (x) =
Net debt -29 321
= -0.4
EBITDA 70 154
Adjusted net debt/
=
Adjusted net debt 43 673
= 0.6
EBITDA, (x) EBITDA 70 154
37
VATTENFALL INTERIM REPORT JANUARY–JUNE 2022
This is information is such that Vattenfall AB is obliged to make public in accordance with the EU Market Abuse Regulation and the
Swedish Securities Markets Act. The information was submitted for publication, through the agency of the contact persons set out
above, at 08.00 CEST on 22 July 2022. This report has been prepared in both Swedish and English versions. In the event of
discrepancies between the two versions, the Swedish version shall govern.
Interim report signature
The Board of Directors and the President certify that this half-year interim
report presents a true and fair overview of the Vattenfall Group’s and the
Parent Company Vattenfall AB’s operations, financial position and results of
operations, and describes the significant risks and uncertainties facing the
Parent Company and the companies belonging to the Group.
Solna, 22 July 2022
Financial calendar
Interim report January-September, 27
October 2022
Year-end report 2022, 8 February 2023
Mats Granryd
Chairman of the Board
Viktoria Bergman
Håkan Erixon
Tomas Kåberger
Rolf Ohlsson
Fredrik Rystedt
Anna Borg
President and CEO
Ann Carlsson
Daniel Kristiansson
Robert Lönnqvist
Jeanette Regin
Contact information
Vattenfall AB (publ)
169 92 Stockholm
Corporate identity number 556036-2138
T +46 8-739 50 00
www.vattenfall.com
www.vattenfall.se
Anna Borg
President and CEO
T +46 8-739 50 09
Kerstin Ahlfont
CFO
T +46 8-739 64 28
Ruben van Bavel
Acting Head of Group Control & Investor
Relations
T +31 650 126 296
Vattenfall’s press office
T +46 8-739 50 10
press@vattenfall.com
Q2 2022: Interim report January-June

Weitere ähnliche Inhalte

Ähnlich wie Q2 2022: Interim report January-June

Vattenfall’s Q2 and half-year results 2018
Vattenfall’s Q2 and half-year results 2018Vattenfall’s Q2 and half-year results 2018
Vattenfall’s Q2 and half-year results 2018Vattenfall
 
Q2 2021: Interim report January-June
Q2 2021: Interim report January-JuneQ2 2021: Interim report January-June
Q2 2021: Interim report January-JuneVattenfall
 
Q1 2018: Interim report January-March
Q1 2018: Interim report January-MarchQ1 2018: Interim report January-March
Q1 2018: Interim report January-MarchVattenfall
 
Vattenfall's Q3 report 2018
Vattenfall's Q3 report 2018Vattenfall's Q3 report 2018
Vattenfall's Q3 report 2018Vattenfall
 
Q3: Interim report January–September 2021
Q3: Interim report January–September 2021Q3: Interim report January–September 2021
Q3: Interim report January–September 2021Vattenfall
 
Vattenfall Q1 report 2017
Vattenfall Q1 report 2017Vattenfall Q1 report 2017
Vattenfall Q1 report 2017Vattenfall
 
Q2 2020: Interim report January-June
Q2 2020: Interim report January-JuneQ2 2020: Interim report January-June
Q2 2020: Interim report January-JuneVattenfall
 
Q1 2019: Interim report January-March
Q1 2019: Interim report January-MarchQ1 2019: Interim report January-March
Q1 2019: Interim report January-MarchVattenfall
 
Vattenfall’s Q2 and half-year results 2017
Vattenfall’s Q2 and half-year results 2017Vattenfall’s Q2 and half-year results 2017
Vattenfall’s Q2 and half-year results 2017Vattenfall
 
Q1 2020: Interim report January-March
Q1 2020: Interim report January-MarchQ1 2020: Interim report January-March
Q1 2020: Interim report January-MarchVattenfall
 
Vattenfall Q2 report 2019
Vattenfall Q2 report 2019Vattenfall Q2 report 2019
Vattenfall Q2 report 2019Vattenfall
 
Q3 2019: Interim report January-September
Q3 2019: Interim report January-SeptemberQ3 2019: Interim report January-September
Q3 2019: Interim report January-SeptemberVattenfall
 
Year-End report 2019 - Vattenfall
Year-End report 2019 - VattenfallYear-End report 2019 - Vattenfall
Year-End report 2019 - VattenfallVattenfall
 
Vattenfall's year-end report 2017
Vattenfall's year-end report 2017Vattenfall's year-end report 2017
Vattenfall's year-end report 2017Vattenfall
 
Third quarter 2020: Interim report January-September
Third quarter 2020: Interim report January-SeptemberThird quarter 2020: Interim report January-September
Third quarter 2020: Interim report January-SeptemberVattenfall
 
Vattenfall’s Q3 report 2017
Vattenfall’s Q3 report 2017Vattenfall’s Q3 report 2017
Vattenfall’s Q3 report 2017Vattenfall
 
Year-End report 2020 – Vattenfall
Year-End report 2020 – VattenfallYear-End report 2020 – Vattenfall
Year-End report 2020 – VattenfallVattenfall
 
Year end report 2018 - Vattenfall
Year end report 2018 - VattenfallYear end report 2018 - Vattenfall
Year end report 2018 - VattenfallVattenfall
 
Presentation of Vattenfall's full year 2015 results
Presentation of Vattenfall's full year 2015 resultsPresentation of Vattenfall's full year 2015 results
Presentation of Vattenfall's full year 2015 resultsVattenfall
 
Q3 report 2016 for Vattenfall
Q3 report 2016 for VattenfallQ3 report 2016 for Vattenfall
Q3 report 2016 for VattenfallVattenfall
 

Ähnlich wie Q2 2022: Interim report January-June (20)

Vattenfall’s Q2 and half-year results 2018
Vattenfall’s Q2 and half-year results 2018Vattenfall’s Q2 and half-year results 2018
Vattenfall’s Q2 and half-year results 2018
 
Q2 2021: Interim report January-June
Q2 2021: Interim report January-JuneQ2 2021: Interim report January-June
Q2 2021: Interim report January-June
 
Q1 2018: Interim report January-March
Q1 2018: Interim report January-MarchQ1 2018: Interim report January-March
Q1 2018: Interim report January-March
 
Vattenfall's Q3 report 2018
Vattenfall's Q3 report 2018Vattenfall's Q3 report 2018
Vattenfall's Q3 report 2018
 
Q3: Interim report January–September 2021
Q3: Interim report January–September 2021Q3: Interim report January–September 2021
Q3: Interim report January–September 2021
 
Vattenfall Q1 report 2017
Vattenfall Q1 report 2017Vattenfall Q1 report 2017
Vattenfall Q1 report 2017
 
Q2 2020: Interim report January-June
Q2 2020: Interim report January-JuneQ2 2020: Interim report January-June
Q2 2020: Interim report January-June
 
Q1 2019: Interim report January-March
Q1 2019: Interim report January-MarchQ1 2019: Interim report January-March
Q1 2019: Interim report January-March
 
Vattenfall’s Q2 and half-year results 2017
Vattenfall’s Q2 and half-year results 2017Vattenfall’s Q2 and half-year results 2017
Vattenfall’s Q2 and half-year results 2017
 
Q1 2020: Interim report January-March
Q1 2020: Interim report January-MarchQ1 2020: Interim report January-March
Q1 2020: Interim report January-March
 
Vattenfall Q2 report 2019
Vattenfall Q2 report 2019Vattenfall Q2 report 2019
Vattenfall Q2 report 2019
 
Q3 2019: Interim report January-September
Q3 2019: Interim report January-SeptemberQ3 2019: Interim report January-September
Q3 2019: Interim report January-September
 
Year-End report 2019 - Vattenfall
Year-End report 2019 - VattenfallYear-End report 2019 - Vattenfall
Year-End report 2019 - Vattenfall
 
Vattenfall's year-end report 2017
Vattenfall's year-end report 2017Vattenfall's year-end report 2017
Vattenfall's year-end report 2017
 
Third quarter 2020: Interim report January-September
Third quarter 2020: Interim report January-SeptemberThird quarter 2020: Interim report January-September
Third quarter 2020: Interim report January-September
 
Vattenfall’s Q3 report 2017
Vattenfall’s Q3 report 2017Vattenfall’s Q3 report 2017
Vattenfall’s Q3 report 2017
 
Year-End report 2020 – Vattenfall
Year-End report 2020 – VattenfallYear-End report 2020 – Vattenfall
Year-End report 2020 – Vattenfall
 
Year end report 2018 - Vattenfall
Year end report 2018 - VattenfallYear end report 2018 - Vattenfall
Year end report 2018 - Vattenfall
 
Presentation of Vattenfall's full year 2015 results
Presentation of Vattenfall's full year 2015 resultsPresentation of Vattenfall's full year 2015 results
Presentation of Vattenfall's full year 2015 results
 
Q3 report 2016 for Vattenfall
Q3 report 2016 for VattenfallQ3 report 2016 for Vattenfall
Q3 report 2016 for Vattenfall
 

Mehr von Vattenfall

Kvartal 3 2023: Delårsrapport Januari-September
Kvartal 3 2023: Delårsrapport Januari-SeptemberKvartal 3 2023: Delårsrapport Januari-September
Kvartal 3 2023: Delårsrapport Januari-SeptemberVattenfall
 
Kvartal 2 2023: Delårsrapport Januari-Juni
Kvartal 2 2023: Delårsrapport Januari-JuniKvartal 2 2023: Delårsrapport Januari-Juni
Kvartal 2 2023: Delårsrapport Januari-JuniVattenfall
 
Kvartal 1 2023: Delårsrapport januari-mars
Kvartal 1 2023: Delårsrapport januari-marsKvartal 1 2023: Delårsrapport januari-mars
Kvartal 1 2023: Delårsrapport januari-marsVattenfall
 
Bokslutskommuniké 2022
Bokslutskommuniké 2022Bokslutskommuniké 2022
Bokslutskommuniké 2022Vattenfall
 
Kvartal 3 2022: Delårsrapport januari-september
Kvartal 3 2022: Delårsrapport januari-septemberKvartal 3 2022: Delårsrapport januari-september
Kvartal 3 2022: Delårsrapport januari-septemberVattenfall
 
Kvartal 2 2022: Delårsrapport januari-juni 2022
Kvartal 2 2022: Delårsrapport januari-juni 2022Kvartal 2 2022: Delårsrapport januari-juni 2022
Kvartal 2 2022: Delårsrapport januari-juni 2022Vattenfall
 
Kvartal 1 2022: Delårsrapport januari-mars
Kvartal 1 2022: Delårsrapport januari-marsKvartal 1 2022: Delårsrapport januari-mars
Kvartal 1 2022: Delårsrapport januari-marsVattenfall
 
Bokslutskommuniké 2021 - Vattenfall
Bokslutskommuniké 2021 - VattenfallBokslutskommuniké 2021 - Vattenfall
Bokslutskommuniké 2021 - VattenfallVattenfall
 
Kvartal 3 2021: Delårsrapport januari-september 2021
Kvartal 3 2021: Delårsrapport januari-september 2021Kvartal 3 2021: Delårsrapport januari-september 2021
Kvartal 3 2021: Delårsrapport januari-september 2021Vattenfall
 
Kvartal 2 2021: Delårsrapport januari-juni 2021
Kvartal 2 2021: Delårsrapport januari-juni 2021Kvartal 2 2021: Delårsrapport januari-juni 2021
Kvartal 2 2021: Delårsrapport januari-juni 2021Vattenfall
 
Kvartal 1 2021: Delårsrapport januari-mars 2021
Kvartal 1 2021: Delårsrapport januari-mars 2021Kvartal 1 2021: Delårsrapport januari-mars 2021
Kvartal 1 2021: Delårsrapport januari-mars 2021Vattenfall
 
Bokslutskommuniké 2020 – Vattenfall
Bokslutskommuniké 2020 – VattenfallBokslutskommuniké 2020 – Vattenfall
Bokslutskommuniké 2020 – VattenfallVattenfall
 
Kvartal 3 2020: Delårsrapport januari-september 2020
Kvartal 3 2020: Delårsrapport januari-september 2020Kvartal 3 2020: Delårsrapport januari-september 2020
Kvartal 3 2020: Delårsrapport januari-september 2020Vattenfall
 
Kvartal 2 2020: Delårsrapport januari-juni 2020
Kvartal 2 2020: Delårsrapport januari-juni 2020Kvartal 2 2020: Delårsrapport januari-juni 2020
Kvartal 2 2020: Delårsrapport januari-juni 2020Vattenfall
 
Kvartal 1 2020: Delårsrapport januari-mars 2020
Kvartal 1 2020: Delårsrapport januari-mars 2020Kvartal 1 2020: Delårsrapport januari-mars 2020
Kvartal 1 2020: Delårsrapport januari-mars 2020Vattenfall
 

Mehr von Vattenfall (15)

Kvartal 3 2023: Delårsrapport Januari-September
Kvartal 3 2023: Delårsrapport Januari-SeptemberKvartal 3 2023: Delårsrapport Januari-September
Kvartal 3 2023: Delårsrapport Januari-September
 
Kvartal 2 2023: Delårsrapport Januari-Juni
Kvartal 2 2023: Delårsrapport Januari-JuniKvartal 2 2023: Delårsrapport Januari-Juni
Kvartal 2 2023: Delårsrapport Januari-Juni
 
Kvartal 1 2023: Delårsrapport januari-mars
Kvartal 1 2023: Delårsrapport januari-marsKvartal 1 2023: Delårsrapport januari-mars
Kvartal 1 2023: Delårsrapport januari-mars
 
Bokslutskommuniké 2022
Bokslutskommuniké 2022Bokslutskommuniké 2022
Bokslutskommuniké 2022
 
Kvartal 3 2022: Delårsrapport januari-september
Kvartal 3 2022: Delårsrapport januari-septemberKvartal 3 2022: Delårsrapport januari-september
Kvartal 3 2022: Delårsrapport januari-september
 
Kvartal 2 2022: Delårsrapport januari-juni 2022
Kvartal 2 2022: Delårsrapport januari-juni 2022Kvartal 2 2022: Delårsrapport januari-juni 2022
Kvartal 2 2022: Delårsrapport januari-juni 2022
 
Kvartal 1 2022: Delårsrapport januari-mars
Kvartal 1 2022: Delårsrapport januari-marsKvartal 1 2022: Delårsrapport januari-mars
Kvartal 1 2022: Delårsrapport januari-mars
 
Bokslutskommuniké 2021 - Vattenfall
Bokslutskommuniké 2021 - VattenfallBokslutskommuniké 2021 - Vattenfall
Bokslutskommuniké 2021 - Vattenfall
 
Kvartal 3 2021: Delårsrapport januari-september 2021
Kvartal 3 2021: Delårsrapport januari-september 2021Kvartal 3 2021: Delårsrapport januari-september 2021
Kvartal 3 2021: Delårsrapport januari-september 2021
 
Kvartal 2 2021: Delårsrapport januari-juni 2021
Kvartal 2 2021: Delårsrapport januari-juni 2021Kvartal 2 2021: Delårsrapport januari-juni 2021
Kvartal 2 2021: Delårsrapport januari-juni 2021
 
Kvartal 1 2021: Delårsrapport januari-mars 2021
Kvartal 1 2021: Delårsrapport januari-mars 2021Kvartal 1 2021: Delårsrapport januari-mars 2021
Kvartal 1 2021: Delårsrapport januari-mars 2021
 
Bokslutskommuniké 2020 – Vattenfall
Bokslutskommuniké 2020 – VattenfallBokslutskommuniké 2020 – Vattenfall
Bokslutskommuniké 2020 – Vattenfall
 
Kvartal 3 2020: Delårsrapport januari-september 2020
Kvartal 3 2020: Delårsrapport januari-september 2020Kvartal 3 2020: Delårsrapport januari-september 2020
Kvartal 3 2020: Delårsrapport januari-september 2020
 
Kvartal 2 2020: Delårsrapport januari-juni 2020
Kvartal 2 2020: Delårsrapport januari-juni 2020Kvartal 2 2020: Delårsrapport januari-juni 2020
Kvartal 2 2020: Delårsrapport januari-juni 2020
 
Kvartal 1 2020: Delårsrapport januari-mars 2020
Kvartal 1 2020: Delårsrapport januari-mars 2020Kvartal 1 2020: Delårsrapport januari-mars 2020
Kvartal 1 2020: Delårsrapport januari-mars 2020
 

Kürzlich hochgeladen

Collective Mining | Corporate Presentation - April 2024
Collective Mining | Corporate Presentation - April 2024Collective Mining | Corporate Presentation - April 2024
Collective Mining | Corporate Presentation - April 2024CollectiveMining1
 
VIP Amritsar Call Girl 7001035870 Enjoy Call Girls With Our Escorts
VIP Amritsar Call Girl 7001035870 Enjoy Call Girls With Our EscortsVIP Amritsar Call Girl 7001035870 Enjoy Call Girls With Our Escorts
VIP Amritsar Call Girl 7001035870 Enjoy Call Girls With Our Escortssonatiwari757
 
CALL ON ➥8923113531 🔝Call Girls Vineet Khand Lucknow best Night Fun service 🧦
CALL ON ➥8923113531 🔝Call Girls Vineet Khand Lucknow best Night Fun service  🧦CALL ON ➥8923113531 🔝Call Girls Vineet Khand Lucknow best Night Fun service  🧦
CALL ON ➥8923113531 🔝Call Girls Vineet Khand Lucknow best Night Fun service 🧦anilsa9823
 
《加州大学圣克鲁兹分校学位证书复制》Q微信741003700美国学历疑难问题指南|挂科被加州大学圣克鲁兹分校劝退没有毕业证怎么办?《UCSC毕业证购买|加...
《加州大学圣克鲁兹分校学位证书复制》Q微信741003700美国学历疑难问题指南|挂科被加州大学圣克鲁兹分校劝退没有毕业证怎么办?《UCSC毕业证购买|加...《加州大学圣克鲁兹分校学位证书复制》Q微信741003700美国学历疑难问题指南|挂科被加州大学圣克鲁兹分校劝退没有毕业证怎么办?《UCSC毕业证购买|加...
《加州大学圣克鲁兹分校学位证书复制》Q微信741003700美国学历疑难问题指南|挂科被加州大学圣克鲁兹分校劝退没有毕业证怎么办?《UCSC毕业证购买|加...wyqazy
 
BDSM⚡Call Girls in Hari Nagar Delhi >༒8448380779 Escort Service
BDSM⚡Call Girls in Hari Nagar Delhi >༒8448380779 Escort ServiceBDSM⚡Call Girls in Hari Nagar Delhi >༒8448380779 Escort Service
BDSM⚡Call Girls in Hari Nagar Delhi >༒8448380779 Escort ServiceDelhi Call girls
 
Collective Mining | Corporate Presentation - May 2024
Collective Mining | Corporate Presentation - May 2024Collective Mining | Corporate Presentation - May 2024
Collective Mining | Corporate Presentation - May 2024CollectiveMining1
 
VIP Kolkata Call Girl Rishra 👉 8250192130 Available With Room
VIP Kolkata Call Girl Rishra 👉 8250192130  Available With RoomVIP Kolkata Call Girl Rishra 👉 8250192130  Available With Room
VIP Kolkata Call Girl Rishra 👉 8250192130 Available With Roomdivyansh0kumar0
 
High Profile Call Girls Kolkata Gayatri 🤌 8250192130 🚀 Vip Call Girls Kolkata
High Profile Call Girls Kolkata Gayatri 🤌  8250192130 🚀 Vip Call Girls KolkataHigh Profile Call Girls Kolkata Gayatri 🤌  8250192130 🚀 Vip Call Girls Kolkata
High Profile Call Girls Kolkata Gayatri 🤌 8250192130 🚀 Vip Call Girls Kolkataanamikaraghav4
 
Q3 FY24 Earnings Conference Call Presentation
Q3 FY24 Earnings Conference Call PresentationQ3 FY24 Earnings Conference Call Presentation
Q3 FY24 Earnings Conference Call PresentationSysco_Investors
 
Malad Escorts, (Pooja 09892124323), Malad Call Girls Service
Malad Escorts, (Pooja 09892124323), Malad Call Girls ServiceMalad Escorts, (Pooja 09892124323), Malad Call Girls Service
Malad Escorts, (Pooja 09892124323), Malad Call Girls ServicePooja Nehwal
 
VIP 7001035870 Find & Meet Hyderabad Call Girls Miyapur high-profile Call Girl
VIP 7001035870 Find & Meet Hyderabad Call Girls Miyapur high-profile Call GirlVIP 7001035870 Find & Meet Hyderabad Call Girls Miyapur high-profile Call Girl
VIP 7001035870 Find & Meet Hyderabad Call Girls Miyapur high-profile Call Girladitipandeya
 
Call Girls in Friends Colony 9711199171 Delhi Enjoy Call Girls With Our Escorts
Call Girls in Friends Colony 9711199171 Delhi Enjoy Call Girls With Our EscortsCall Girls in Friends Colony 9711199171 Delhi Enjoy Call Girls With Our Escorts
Call Girls in Friends Colony 9711199171 Delhi Enjoy Call Girls With Our Escortsindian call girls near you
 

Kürzlich hochgeladen (20)

@9999965857 🫦 Sexy Desi Call Girls Vaishali 💓 High Profile Escorts Delhi 🫶
@9999965857 🫦 Sexy Desi Call Girls Vaishali 💓 High Profile Escorts Delhi 🫶@9999965857 🫦 Sexy Desi Call Girls Vaishali 💓 High Profile Escorts Delhi 🫶
@9999965857 🫦 Sexy Desi Call Girls Vaishali 💓 High Profile Escorts Delhi 🫶
 
Sensual Moments: +91 9999965857 Independent Call Girls Noida Delhi {{ Monika}...
Sensual Moments: +91 9999965857 Independent Call Girls Noida Delhi {{ Monika}...Sensual Moments: +91 9999965857 Independent Call Girls Noida Delhi {{ Monika}...
Sensual Moments: +91 9999965857 Independent Call Girls Noida Delhi {{ Monika}...
 
Rohini Sector 17 Call Girls Delhi 9999965857 @Sabina Saikh No Advance
Rohini Sector 17 Call Girls Delhi 9999965857 @Sabina Saikh No AdvanceRohini Sector 17 Call Girls Delhi 9999965857 @Sabina Saikh No Advance
Rohini Sector 17 Call Girls Delhi 9999965857 @Sabina Saikh No Advance
 
Collective Mining | Corporate Presentation - April 2024
Collective Mining | Corporate Presentation - April 2024Collective Mining | Corporate Presentation - April 2024
Collective Mining | Corporate Presentation - April 2024
 
VIP Amritsar Call Girl 7001035870 Enjoy Call Girls With Our Escorts
VIP Amritsar Call Girl 7001035870 Enjoy Call Girls With Our EscortsVIP Amritsar Call Girl 7001035870 Enjoy Call Girls With Our Escorts
VIP Amritsar Call Girl 7001035870 Enjoy Call Girls With Our Escorts
 
CALL ON ➥8923113531 🔝Call Girls Vineet Khand Lucknow best Night Fun service 🧦
CALL ON ➥8923113531 🔝Call Girls Vineet Khand Lucknow best Night Fun service  🧦CALL ON ➥8923113531 🔝Call Girls Vineet Khand Lucknow best Night Fun service  🧦
CALL ON ➥8923113531 🔝Call Girls Vineet Khand Lucknow best Night Fun service 🧦
 
《加州大学圣克鲁兹分校学位证书复制》Q微信741003700美国学历疑难问题指南|挂科被加州大学圣克鲁兹分校劝退没有毕业证怎么办?《UCSC毕业证购买|加...
《加州大学圣克鲁兹分校学位证书复制》Q微信741003700美国学历疑难问题指南|挂科被加州大学圣克鲁兹分校劝退没有毕业证怎么办?《UCSC毕业证购买|加...《加州大学圣克鲁兹分校学位证书复制》Q微信741003700美国学历疑难问题指南|挂科被加州大学圣克鲁兹分校劝退没有毕业证怎么办?《UCSC毕业证购买|加...
《加州大学圣克鲁兹分校学位证书复制》Q微信741003700美国学历疑难问题指南|挂科被加州大学圣克鲁兹分校劝退没有毕业证怎么办?《UCSC毕业证购买|加...
 
BDSM⚡Call Girls in Hari Nagar Delhi >༒8448380779 Escort Service
BDSM⚡Call Girls in Hari Nagar Delhi >༒8448380779 Escort ServiceBDSM⚡Call Girls in Hari Nagar Delhi >༒8448380779 Escort Service
BDSM⚡Call Girls in Hari Nagar Delhi >༒8448380779 Escort Service
 
Collective Mining | Corporate Presentation - May 2024
Collective Mining | Corporate Presentation - May 2024Collective Mining | Corporate Presentation - May 2024
Collective Mining | Corporate Presentation - May 2024
 
VIP Kolkata Call Girl Rishra 👉 8250192130 Available With Room
VIP Kolkata Call Girl Rishra 👉 8250192130  Available With RoomVIP Kolkata Call Girl Rishra 👉 8250192130  Available With Room
VIP Kolkata Call Girl Rishra 👉 8250192130 Available With Room
 
High Profile Call Girls Kolkata Gayatri 🤌 8250192130 🚀 Vip Call Girls Kolkata
High Profile Call Girls Kolkata Gayatri 🤌  8250192130 🚀 Vip Call Girls KolkataHigh Profile Call Girls Kolkata Gayatri 🤌  8250192130 🚀 Vip Call Girls Kolkata
High Profile Call Girls Kolkata Gayatri 🤌 8250192130 🚀 Vip Call Girls Kolkata
 
@9999965857 🫦 Sexy Desi Call Girls Karol Bagh 💓 High Profile Escorts Delhi 🫶
@9999965857 🫦 Sexy Desi Call Girls Karol Bagh 💓 High Profile Escorts Delhi 🫶@9999965857 🫦 Sexy Desi Call Girls Karol Bagh 💓 High Profile Escorts Delhi 🫶
@9999965857 🫦 Sexy Desi Call Girls Karol Bagh 💓 High Profile Escorts Delhi 🫶
 
Q3 FY24 Earnings Conference Call Presentation
Q3 FY24 Earnings Conference Call PresentationQ3 FY24 Earnings Conference Call Presentation
Q3 FY24 Earnings Conference Call Presentation
 
Malad Escorts, (Pooja 09892124323), Malad Call Girls Service
Malad Escorts, (Pooja 09892124323), Malad Call Girls ServiceMalad Escorts, (Pooja 09892124323), Malad Call Girls Service
Malad Escorts, (Pooja 09892124323), Malad Call Girls Service
 
VIP 7001035870 Find & Meet Hyderabad Call Girls Miyapur high-profile Call Girl
VIP 7001035870 Find & Meet Hyderabad Call Girls Miyapur high-profile Call GirlVIP 7001035870 Find & Meet Hyderabad Call Girls Miyapur high-profile Call Girl
VIP 7001035870 Find & Meet Hyderabad Call Girls Miyapur high-profile Call Girl
 
(👉゚9999965857 ゚)👉 VIP Call Girls Friends Colony 👉 Delhi 👈 : 9999 Cash Payment...
(👉゚9999965857 ゚)👉 VIP Call Girls Friends Colony 👉 Delhi 👈 : 9999 Cash Payment...(👉゚9999965857 ゚)👉 VIP Call Girls Friends Colony 👉 Delhi 👈 : 9999 Cash Payment...
(👉゚9999965857 ゚)👉 VIP Call Girls Friends Colony 👉 Delhi 👈 : 9999 Cash Payment...
 
Call Girls 🫤 Nehru Place ➡️ 9999965857 ➡️ Delhi 🫦 Russian Escorts FULL ENJOY
Call Girls 🫤 Nehru Place ➡️ 9999965857  ➡️ Delhi 🫦  Russian Escorts FULL ENJOYCall Girls 🫤 Nehru Place ➡️ 9999965857  ➡️ Delhi 🫦  Russian Escorts FULL ENJOY
Call Girls 🫤 Nehru Place ➡️ 9999965857 ➡️ Delhi 🫦 Russian Escorts FULL ENJOY
 
(👉゚9999965857 ゚)👉 VIP Call Girls Greater Noida 👉 Delhi 👈 : 9999 Cash Payment...
(👉゚9999965857 ゚)👉 VIP Call Girls Greater Noida  👉 Delhi 👈 : 9999 Cash Payment...(👉゚9999965857 ゚)👉 VIP Call Girls Greater Noida  👉 Delhi 👈 : 9999 Cash Payment...
(👉゚9999965857 ゚)👉 VIP Call Girls Greater Noida 👉 Delhi 👈 : 9999 Cash Payment...
 
Call Girls in Friends Colony 9711199171 Delhi Enjoy Call Girls With Our Escorts
Call Girls in Friends Colony 9711199171 Delhi Enjoy Call Girls With Our EscortsCall Girls in Friends Colony 9711199171 Delhi Enjoy Call Girls With Our Escorts
Call Girls in Friends Colony 9711199171 Delhi Enjoy Call Girls With Our Escorts
 
Vip Call Girls Hauz Khas ➡️ Delhi ➡️ 9999965857 No Advance 24HRS Live
Vip Call Girls Hauz Khas ➡️ Delhi ➡️ 9999965857 No Advance 24HRS LiveVip Call Girls Hauz Khas ➡️ Delhi ➡️ 9999965857 No Advance 24HRS Live
Vip Call Girls Hauz Khas ➡️ Delhi ➡️ 9999965857 No Advance 24HRS Live
 

Q2 2022: Interim report January-June

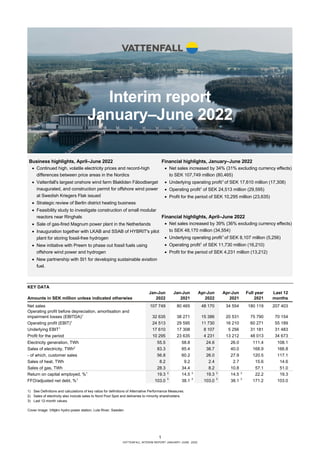
  • 1. 1 VATTENFALL INTERIM REPORT JANUARY–JUNE 2022 Interim report January–June 2022 KEY DATA Jan-Jun Jan-Jun Apr-Jun Apr-Jun Full year Last 12 Amounts in SEK million unless indicated otherwise 2022 2021 2022 2021 2021 months Net sales 107 749 80 465 48 170 34 554 180 119 207 403 Operating profit before depreciation, amortisation and impairment losses (EBITDA)1 32 635 38 271 15 386 20 531 75 790 70 154 Operating profit (EBIT)1 24 513 29 595 11 730 16 210 60 271 55 189 Underlying EBIT1 17 610 17 308 8 107 5 256 31 181 31 483 Profit for the period 10 295 23 635 4 231 13 212 48 013 34 673 Electricity generation, TWh 55.5 58.8 24.6 26.0 111.4 108.1 Sales of electricity, TWh2 83.3 85.4 38.7 40.0 168.9 166.8 - of which, customer sales 56.8 60.2 26.0 27.9 120.5 117.1 Sales of heat, TWh 8.2 9.2 2.4 2.7 15.6 14.6 Sales of gas, TWh 28.3 34.4 8.2 10.8 57.1 51.0 Return on capital employed, %1 19.3 3 14.5 3 19.3 3 14.5 3 22.2 19.3 FFO/adjusted net debt, %1 103.0 3 38.1 3 103.0 3 38.1 3 171.2 103.0 1) See Definitions and calculations of key ratios for definitions of Alternative Performance Measures. 2) Sales of electricity also include sales to Nord Pool Spot and deliveries to minority shareholders. 3) Last 12-month values. Business highlights, April–June 2022 • Continued high, volatile electricity prices and record-high differences between price areas in the Nordics • Vattenfall's largest onshore wind farm Blakliden Fäbodberget inaugurated, and construction permit for offshore wind power at Swedish Kriegers Flak issued • Strategic review of Berlin district heating business • Feasibility study to investigate construction of small modular reactors near Ringhals • Sale of gas-fired Magnum power plant in the Netherlands • Inauguration together with LKAB and SSAB of HYBRIT's pilot plant for storing fossil-free hydrogen • New initiative with Preem to phase out fossil fuels using offshore wind power and hydrogen • New partnership with St1 for developing sustainable aviation fuel. Financial highlights, January–June 2022 • Net sales increased by 34% (31% excluding currency effects) to SEK 107,749 million (80,465) • Underlying operating profit1 of SEK 17,610 million (17,308) • Operating profit1 of SEK 24,513 million (29,595) • Profit for the period of SEK 10,295 million (23,635) Financial highlights, April–June 2022 • Net sales increased by 39% (36% excluding currency effects) to SEK 48,170 million (34,554) • Underlying operating profit1 of SEK 8,107 million (5,256) • Operating profit1 of SEK 11,730 million (16,210) • Profit for the period of SEK 4,231 million (13,212) Cover image: Vittjärv hydro power station, Lule River, Sweden
  • 2. 2 VATTENFALL INTERIM REPORT JANUARY–JUNE 2020 CEO’s comment Vattenfall's underlying results for the first half of the year remained unchanged from last year. A strong performance by our wind business and an expanding customer base were offset by the continued negative effects from price area differences in the Nordics. In Europe there is a lot of focus on securing gas for the upcoming winter. Therefore, the pace in the energy transition needs to remain high. This is the only way we can reduce fossil fuel dependency in Europe. Turbulent electricity markets as gas sets prices Turbulence in the electricity market increased in the second quarter. At present, the big question is what the natural gas supply will look like in Europe this winter with rationing becoming an increasingly likely scenario. The uncertainty has sent electricity prices to new record levels even as we are in the middle of the summer when prices are usually lower. In continental Europe, prices have on average been 3 to 4 times higher than the corresponding period in 2021. In Sweden, average prices have nearly tripled compared to last year, but price differentials between the country’s southern and northern regions remain big. In southern Sweden, prices are clearly linked to continental Europe and the price of gas, while prices in the northern areas, on average, have been comparable to 2021. Stable underlying results dampened by price area differences Profit for the period fell by SEK 13.3 billion to SEK 10.3 billion, which is mainly attributable to the compensation received in 2021 for the early decommissioning of German nuclear power. Underlying operating profit was largely unchanged at SEK 17.6 billion for the half-year but rose by SEK 2.9 billion to SEK 8.1 billion for the quarter. Our sales business is performing well. Customers choose Vattenfall because we can manage the market uncertainty and continue to offer contracts for electricity, heating, and gas. Our wind business is also developing well, with new capacity from Kriegers Flak in Denmark contributing positively. Price area differences continued however to have a negative impact on our Nordic power portfolio. Investing in the energy system of the future In May, we received the construction permit for the offshore wind farm Kriegers Flak in Sweden. And after quarter-end, we secured a CfD contract for the first phase of the Norfolk Zone wind power project in the UK which, when commissioned, will be the world's largest wind power zone. In order to ensure the energy transition in the long run, we will need all types of fossil-free energy sources. Small modular reactors (SMRs) have the potential to eventually add base load power and flexibility to the energy system. That is why we have initiated a feasibility study to evaluate the potential to build SMRs adjacent to Ringhals nuclear power plant. In Berlin, we have initiated a strategic review of our heat business. The energy transition offers a multitude of opportunities, and we need to prioritise on both project- and portfolio level. Partnerships for industry transition A central part of Vattenfall’s strategy is to contribute also to the transition of other sectors. In two projects — with Preem and St1, respectively — we are looking at opportunities to use hydrogen from future wind farms to produce, e.g., fuels for aviation and shipping. In early June, we inaugurated HYBRIT’s pilot plant for storing fossil- free hydrogen together with our partners LKAB and SSAB. Efficient and dynamic storage is an important piece of the puzzle if hydrogen is to play an important role in reducing industry emissions. Following a turbulent first six months, it is likely that we are facing a tough winter here in Europe. At Vattenfall, we will use our experience and expertise to contribute to stabilising the situation for our customers and continue the energy transition. Anna Borg President and CEO Profit for the period First half of 2022 10.3 SEK billion (23.6) Underlying operating profit First half of 2022 17.6 SEK billion (17.3) FFO/adjusted net debt Last 12 months 103.0% (38.1) Return on capital employed Last 12 months 19.3% (14.5) Gas market is in focus and emphasises the importance of the energy transition
  • 3. 3 VATTENFALL INTERIM REPORT JANUARY–JUNE 2022 Group overview Vattenfall generates electricity and heat from a portfolio of energy sources, such as hydro and nuclear power, wind power, and fossil fuels. We sell electricity, gas, and heat to private customers and businesses primarily in northern Europe. Vattenfall continuously hedges its future electricity generation through sales in the forward and futures markets. Market development Electricity markets continue to be characterised by major fluctuations triggered by developments on the Continent. Sharply rising gas prices have resulted in record-high electricity prices and the Nordic system price has largely been decoupled with the hydrological development. High average electricity prices for the first half of 2022 contributed positively to Vattenfall’s results. But major differences between the system price in the Nordics and the price in respective price areas had a negative impact and resulted in a lower achieved price after price hedges. ELECTRICITY SPOT PRICES, EUR/MWh The average spot price in the Nordic countries increased as a result of higher electricity prices on the Continent, which is primarily attributable to high prices for fuel and emissions allowances. Jan-Jun Apr-Jun 2022 2021 Change 2022 2021 Change Nordics 115.6 42.0 175% 121.10 41.90 189% Germany 185.8 55.0 238% 187.0 60.3 210% Netherlands 201.5 56.4 257% 195.6 62.1 215% NORDIC HYDROLOGY Hydrological balance is a measure of the estimated energy volume stored in the form of snow, and water reservoirs and ground water in relation to a normal situation. Historically, Nordic electricity prices have had a negative correlation with the hydrological balance, since the available hydro power capacity normally regulated what energy sources would be used in the system. Electricity prices in the northern parts of the Nordic countries remain linked to the hydrological balance, while the correlation with system price and the price development in the southern regions has decreased, especially in the past year. By the end of the second quarter 2022, the hydrological balance for the Nordics was below normal levels primarily as a result of the low reservoir levels in southern Norway. NORDIC HYDROLOGICAL BALANCE (TWh) However, the fill rate of Vattenfall’s water reservoirs increased to 79% (71%), which is 19 percentage points above normal levels. This is attributable to increased inflows from precipitation and snowmelt, which in turn had a negative effect on the spot price for electricity in Sweden's northern price areas. NORDIC PRICE AREA DIFFERENCES The electricity market in the Nordic countries is divided into separate price areas. Sweden has four price areas and Vattenfall’s hydro power assets’ are mainly located in SE1 and SE2 while the nuclear power assets are located in SE3. Vattenfall also has wind power assets in SE4. In recent years, the differences in electricity prices between the areas have grown wider as a result of bottlenecks in the transmission grid, which prevents the electricity from reaching southern regions. Moreover, new transmission connections to the Continent have contributed further to higher prices in southern Sweden. The Nordic system price (SYS) is a reference price for all price areas and is calculated by the power exchange Nord Pool. SPOT PRICES PER PRICE AREA AND SYSTEM PRICE (EUR/MWh) 1 Difference between SE1 and SE2 is invisible due to high correlation The price area differentials have remained at a high level during the first six months of 2022. In southern Sweden, the prices increased significantly compared to last year (see above), while the average price for northern Sweden was relatively stable -30 -20 -10 0 10 20 30 40 2021 2022 0 20 40 60 80 100 120 140 160 180 2019 2020 2021 2022 EUR/MWh SE1¹ SE2¹ SE3 SE4 SYS
  • 4. 4 VATTENFALL INTERIM REPORT JANUARY–JUNE 2022 INDICATIVE NORDIC HEDGE PRICES AND FINANCIAL HEDGE RATIO (SE, DK, FI) AS PER 30 JUNE 2022 Vattenfall’s price hedging strategy is focused on the Nordic power generation assets as the dominant risk exposure is coupled to Nordic nuclear and hydro power baseload generation. Vattenfall hedges most volumes for the beginning of the time horizon, with declining volumes towards the outer years. 2022 2023 2024 EUR/MWh 25 30 34 Hedge ratio (%) 66 61 38 At the end of the first half of 2022, the price hedge ratio for 2022 stood at 66%, which is 6 percentage points lower than the end of the first quarter of 2022. During that same time, the price hedge level decreased to 25 EUR/MWh. The lower hedge ratio and hedge level are attributable to Vattenfall having adjusted its hedging strategy as a result of the major price area differentials in Sweden. ACHIEVED NORDIC ELECTRICITY PRICES (SE, DK, FI)1 The achieved price is the average price that Vattenfall received for its electricity production during the period and is impacted by the hedge ratio and hedge price (see above), the spot price and effects from price area differentials. Jan-Jun Apr-Jun Full year 2022 2021 2022 2021 2021 EUR/MWh 18 30 15 27 31 Vattenfall's achieved price in the Nordics has decreased significantly primarily because of major price area differentials. FUEL PRICES The prices of gas, coal, and CO2 emission allowances affect mainly Vattenfall’s heat business on the Continent. Gas prices also affect activities within the business segment Customers & Solutions, which is responsible for customer sales of gas. Jan-Jun Apr-Jun 2022 2021 Change 2022 2021 Change Gas (EUR/MWh) 99.1 21.7 357% 99.0 24.7 301% Coal (USD/t) 284.5 78.6 262% 338.1 89.6 277% CO2 (EUR/t) 83.1 43.7 90% 83.3 49.9 67% 1 Achieved prices from the spot market and hedges. Includes Nordic hydro, nuclear and wind power generation The price of gas and coal has increased sharply in the first half-year 2022 as a result of the war in Ukraine. At the end of the second quarter, Russia reduced its flow of gas to Germany, which contributed further to higher gas prices. In addition to high gas prices, the price of coal has been affected by high demand in Europe, a ban on imported Russian coal, and limited supply from Asia. The price of CO2 emission allowances rose primarily as a result of the increased use of coal as fuel. PRICE MARGINS The clean spark spread is the margin between the electricity price and the cost of gas and emissions allowances used for its generation. The clean dark spread represents the same relationship for coal-fired electricity generation. These spreads affect Vattenfall’s heat business in Germany and the Netherlands where the fossil-fired combined heat-and-power (CHP) plants and condensing plants are located. Vattenfall hedges these spreads in part. CLEAN SPARK SPREAD AND CLEAN DARK SPREAD Despite higher electricity prices, the clean spark spreads have been negative during the first half of 2022 as a result of higher gas prices. This has had a negative impact on electricity generation at Vattenfall's gas-fired condensing power plants. The clean dark spreads have been volatile for the first half of the year and are closely linked to the electricity price development on the Continent. -75 -55 -35 -15 5 25 45 65 85 105 2021 2022 Clean Spark Spread NL Clean Dark Spread DE Clean Spark Spread DE
  • 5. 5 VATTENFALL INTERIM REPORT JANUARY–JUNE 2022 Generation development Combined electricity generation declined by 3.3 TWh to 55.5 TWh (58.8) for the first half of 2022. Production from fossil- based power declined (–2.2 TWh) as a result of lower clean spark spreads. Generation from hydro power declined (-2.2 TWh), which was primarily related to the first quarter of 2022. Generation from wind power increased (1.1 TWh) as a result of new capacity, mainly related to the offshore wind farm Kriegers Flak, as well as slightly higher generation from existing plants. ELECTRICITY GENERATION (TWh) AVAILABILITY Availability is the percentage of planned production time for an asset with no unforeseen technical issues or maintenance- related outages. Jan-Jun 2022 2021 Nuclear 90.2% 91.1% Wind - offshore 95.4% 96.1% Wind – onshore 95.8% 96.2% The availability of Vattenfall's nuclear power and wind power were stable for the first half of 2022 compared to the corresponding period of 2021. INSTALLED WIND CAPACITY New installed wind power capacity in the past 12 months mainly pertains to Blakliden Fäbodberget (353 MW), Moerdijk (20 MW of 27 MW), and Haringvliet (4 MW of 22 MW). The comparison is affected by the partial divestments of Princess Ariane (Wieringermeer Extension,114 MW), and divestment of onshore wind farms in Denmark (90 MW). 30 Jun 2022 30 Jun 2021 Onshore wind 1,614 1,442 Offshore wind 2,602 2,602 Total 4,216 4,044 Sales development Electricity sales, excluding sales to Nord Pool Spot and deliveries to minority owners, declined by 3.4 TWh to 56.8 TWh (60.2), primarily as a result of lower volumes in the business segment in France and in Germany. Gas sales declined by 6.1 TWh to 28.3 TWh (34.4) as a result of warmer weather in the Netherlands and Germany. Heat sales declined by 1.0 TWh to 8.2 TWh (9.2) as a result of warmer weather. Jan-Jun Apr-Jun 2022 2021Change 2022 2021Change Sales of electricity to customers , TWh 56.8 60.2 -6% 26.0 27.9 -7% Sales of gas, TWh 28.3 34.4 -18% 8.2 10.8 -24% Sales of heat, TWh 8.2 9.2 -11% 2.4 2.7 -11% TEMPERATURE EFFECTS Temperature impacts sales volume in the operating segments Customers & Solutions and Heat. Lower temperatures usually mean higher demand for heating (including gas) and electricity. In the Nordic countries, this mainly affects sales of electricity and heat. In Germany and the Netherlands, gas remains the primary source of heat, which means that low temperatures increase demand for gas in addition to increased sales of heat. TEMPERATURE DEVIATION FROM NORMAL LEVELS (ºC) Jan-Jun Apr-Jun 2022 2021 2022 2021 Nordics 0.9 -0.3 0.1 0.0 Netherlands 1.2 -0.5 0.6 -1.0 Germany 1.2 -0.6 0.9 -1.0 In the first half of 2022, the temperatures in Vattenfall's markets were higher than normal, which affected sales negatively. 0 10 20 30 Fossil Nuclear Hydro Wind Biomass, waste Jan-Jun 2022 Jan-Jun 2021
  • 6. 6 VATTENFALL INTERIM REPORT JANUARY–JUNE 2022 Net sales Comment January–June: Consolidated net sales increased by SEK 27.3 billion (including positive currency effects of SEK 2.6 billion). The increase is mainly attributable to higher electricity prices in the Netherlands, the Nordics and Germany. Comment April–June: Consolidated net sales increased by SEK 13.6 billion (including positive currency effects of SEK 1.3 billion). The increase is mainly attributable to higher electricity prices in the Netherlands, the Nordics and Germany. Earnings Comment January–June: Underlying operating profit increased by SEK 0.3 billion, which is explained by: • Higher earnings contribution from the Wind operating segment (SEK +4.7 billion) mainly owing to higher electricity prices on the Continent as well as new capacity • Lower earnings contribution from the Power Generation operating segment (SEK –1.7 billion), owing to lower achieved prices in the Nordics, decrease in nuclear power generation, and lower realised earnings contribution from the trading operations. • Lower earnings contribution from the Heat operating segment (SEK –2.9 billion) attributable mainly to higher prices for gas, which led to lower clean spark spreads. • Other items, net (SEK 0.2 billion). Items affecting comparability amounted to SEK 6.9 billion (12.3), of which most pertains to changes in market value for energy derivatives and inventories (SEK 8.4 billion) and reversed impairment charges (SEK 0.9 billion). Higher provisions related to nuclear power in Sweden (SEK -2,4 billion) had a countering effect. Profit for the period totalled SEK 10.3 billion (23.6) and was affected by – in addition to items affecting comparability – lower net financial items as a result of lower return from the Swedish Nuclear Waste Fund and lower tax cost due to lower profit before tax. The profit for the period in 2021 was affected by compensation for the early closure of nuclear power in Germany. Comment April–June: Underlying operating profit increased by SEK 2.9 billion, mainly owing to positive contributions from the Power Generation (SEK 1.5 billion) and Wind (SEK 1.5 billion) operating segments. Items affecting comparability amounted to SEK 3.6 billion (11.0), of which most is attributable to changes in market value for energy derivatives and inventories (SEK 5.2 billion) and reversed impairment charges (SEK 0.9 billion). This was offset in part by increased provisions for nuclear power in Sweden (SEK -2.4 billion). Profit for the period totalled SEK 4.2 billion (13.2), and, apart from the underlying operating profit, were affected by lower net financial items as a result of lower return from the Swedish Nuclear Waste Fund. The profit for the period in 2021 was affected by compensation for the early closure of nuclear power in Germany. Cash flow Comment January–June: Funds from operations (FFO) declined by SEK 1.1 billion mainly as a result of lower operating profit before depreciation, amortisation and impairment losses (EBITDA). Cash flow from changes in operating capital amounted to SEK -1.7 billion. The largest contributing factor was related to the net change in margin calls (SEK –3.9). The change related to CO2 emission allowances (SEK +0.7 billion) had a countering effect Comment April–June: Funds from operations (FFO) increased by SEK 4.5 billion, primarily as a result of higher underlying operating profit before depreciation, amortisation and impairment losses (EBITDA) and lower paid tax. Cash flow from changes in operating capital amounted to SEK 9.8 billion, which was mainly attributable to the net change in margin calls (SEK +13.8 billion). The increase in inventories contributed negatively (SEK 5.1 billion). Important events after the balance sheet date • On 7 July 2022, Vattenfall was awarded a 15-year state subsidy through the UK support scheme “Contracts for Difference” (CfD) for the offshore wind farm Norfolk Boreas. KEY FIGURES – GROUP OVERVIEW Jan-Jun Jan-Jun Apr-Jun Apr-Jun Full year Last 12 Amounts in SEK million 2022 2021 2022 2021 2021 months Net sales 107 749 80 465 48 170 34 554 180 119 207 403 Operating profit before depreciation, amortisation and impairment losses (EBITDA)1 32 635 38 271 15 386 20 531 75 790 70 154 Operating profit (EBIT)1 24 513 29 595 11 730 16 210 60 271 55 189 Underlying operating profit1 17 610 17 308 8 107 5 256 31 181 31 483 Items affecting comparability1 6 903 12 287 3 623 10 954 29 090 23 706 Profit for the period 10 295 23 635 4 231 13 212 48 013 34 673 Funds from operations (FFO)1 20 293 21 425 11 911 7 439 46 096 44 964 Cash flow from changes in operating assets and operating liabilities (working capital) - 1 664 14 871 9 776 16 526 55 736 39 201 Cash flow from operating activities 18 629 36 296 21 687 23 965 101 832 84 165 1) See Definitions and calculations of key ratios for definitions of Alternative Performance Measures.
  • 7. 7 VATTENFALL INTERIM REPORT JANUARY–JUNE 2022 Capital structure Cash and cash equivalents, and short-term investments decreased by SEK 18.3 billion compared with the level at 31 December 2021. Committed credit facilities consist of a EUR 2.0 billion Revolving Credit Facility that expires in November 2024 and five other committed credit facilities totalling EUR 4.0 billion, which expire in 2023. As of 30 June 2022 available liquid assets and/or committed credit facilities amounted to 103.7% of net sales. Vattenfall’s target is to maintain a level of no less than 10% of consolidated net sales, but at least the equivalent of the next 90 days’ maturities Net debt increased by SEK 15.4 billion to a net asset of SEK 29.3 billion and adjusted net debt increased by SEK 17.0 billion to SEK 43.9 billion compared to 31 December 2021. Dividends paid increased net debt by SEK 23.4 billion, which was offset in part by a positive cash flow after investments (SEK 8.9 billion). The adjusted net debt was also affected by higher provisions for nuclear power (SEK 13.2 billion, net) and lower pension provisions (SEK 12.5 billion). NET DEBT -30 0 30 60 90 -60,000 -30,000 0 30,000 60,000 90,000 120,000 Q1 2019 Q2 2021 Q3 2021 Q4 2021 Q1 2022 Q2 2022 % MSEK Interest-bearing liabilities, MSEK Net debt, MSEK Gross debt/equity, % Net debt/equity, % ADJUSTED NET DEBT 0 50 100 150 200 0 30,000 60,000 90,000 120,000 150,000 Q1 2020 Q2 2021 Q3 2021 Q4 2021 Q1 2022 Q2 2022 % MSEK Adjusted net debt, MSEK FFO/adjusted net debt, % Strategic focus areas and targets for 2025 Strategic focus area Targets for 2025 Q2 2022 Outcome 2021 Driving decarbonisation with our customers & partners 1. Customer engagement, absolute Net Promoter Score (NPS)1 : +18 - +10 Securing a fossil-free energy supply 2. CO2 emissions intensity2 : ≤86 gCO2e/kWh 82 82 Delivering high-performing operations 3. Funds from operations (FFO)/adjusted net debt3 : 22%-27% 4. Return On Capital Employed (ROCE)4 , last 12 months: ≥8% 103.0% 19.3% 171.2% 22.2% Empowering our people 5. Lost Time Injury Frequency (LTIF)5 : ≤1.0 6. Employee engagement index 6 : ≥75% 1.3 - 1.7 75% 1) Absolute NPS is weighted 80% from Customers & Solutions and 20% from Heat, which corresponds to our customer composition. Reported on an annual basis 2) Includes CO2 and other greenhouse gases such as N2O and SF6. as well as indirect emissions from electricity and heat use (scope 2) Consolidated value where CO2 is primarily related to the operating segment Heat. The target for 2025 is to be on track to achieving the 1.5° C target by 2030, according to SBT 3) Rolling 12-months values. Received margin calls had a significant impact on the outcome for both the first half year 2022 and for the full year 2021 4) Rolling 12-months values. Compensation for closure of nuclear power in Germany, changes in market value of energy derivatives and inventories and capital gains from the sale of Stromnetz Berlin's had significant impact on the outcome for both the first half year 2022 and the full year 2021 5) Rolling 12-month values. LTIF (Lost Time Injury Frequency) is expressed in terms of the number of lost time work injuries per 1 million hours worked. The metric pertains only to Vattenfall employees 6) Documentation for measurement of target achievement is derived from the results of an employee survey, which is conducted on an annual basis
  • 8. 8 VATTENFALL INTERIM REPORT JANUARY–JUNE 2022 Operating segments Jan-Jun Jan-Jun Apr-Jun Apr-Jun Full year Last 12 Amounts in SEK million 2022 2021 2022 2021 2021 months Underlying EBIT Customers & Solutions 3 350 1 892 1 383 675 2 349 3 807 Power Generation 8 560 10 281 5 449 3 960 19 334 17 613 - of which, realised trading result 2 388 2 767 2 345 768 3 633 3 254 Wind 6 729 2 079 1 829 312 7 866 12 516 Heat - 1 400 1 543 - 495 173 - 343 - 3 286 Distribution 1 286 2 453 182 658 3 152 1 985 - of which, Distribution Germany1 — 666 — 331 666 — - of which, Distribution Sweden 1 305 1 796 194 340 2 516 2 025 Other2 - 776 - 786 - 173 - 418 - 1 189 - 1 179 Eliminations - 139 - 154 - 68 - 104 12 27 Underlying operating profit 17 610 17 308 8 107 5 256 31 181 31 483 1) Stromnetz Berlin sold Q3 2021. 2) “Other” pertains mainly to all Staff functions, including Treasury and Shared Service Centres.
  • 9. 9 VATTENFALL INTERIM REPORT JANUARY–JUNE 2022 Customers & Solutions The Customers & Solutions Business Area is responsible for sales of electricity, gas and energy services across all of Vattenfall’s markets. Strong earnings development as more customers choose Vattenfall • Earnings positively affected by growing customer base and lower churn • New biogas offering for German private customers • New partnership for charging infrastructure for electric cars Q1–Q2: Net sales increased by 65%. Underlying operating profit increased by 77%, mainly owing to a growing customer base in Germany and lower churn in all of Vattenfall’s markets. Compared to year-end 2021, Vattenfall’s total customer base increased by 3% to 10.7 million contracts. Sales of electricity decreased by 3% compared to the corresponding period in 2021 mainly due to lower sold volumes to electricity grid operators in France as well as lower volumes in the retail market in the Nordics and the Netherlands. Sales of gas decreased by 18%, mainly due to warmer weather and lower consumption in the Netherlands and Germany. Q2: Net sales increased by 77%. Underlying operating profit increased by 105%, mainly owing to a growing customer base in Germany. This was partly countered by lower sales of gas due to warmer weather in the Netherlands and Germany in combination with lower sales of gas in the B2B segment in the Netherlands. In April, Vattenfall launched a new biogas offering for German private customers. The gas mix contains 15% biogas and allows customers to reduce their carbon footprint. Biogas availability remains limited in Europe and Vattenfall will therefore, initially, be able to offer this product to approximately 30,000 customers. The expansion of charging infrastructure for electric cars continues. In Germany, Vattenfall will install and operate charging points at all parking lots operated by Q-Park. In Sweden, Vattenfall’s partnership with the MAX hamburger chain will be expanded with the installation of new, faster charging points at a number of restaurants. Vattenfall will also install charging points at the facility of Volvo Construction Equipment in Eskilstuna. KEY FIGURES – CUSTOMERS & SOLUTIONS Jan-Jun Jan-Jun Apr-Jun Apr-Jun Full year Last 12 Amounts in SEK million unless indicated otherwise 2022 2021 2022 2021 2021 months Net sales 79 418 48 044 36 791 20 793 106 560 137 934 External net sales 75 829 46 526 34 974 20 070 102 300 131 603 Underlying EBITDA 3 809 2 338 1 617 906 3 230 4 701 Underlying EBIT 3 350 1 892 1 383 675 2 349 3 807 Sales of electricity, TWh 47.5 48.7 22.0 22.2 96.1 94.9 - of which, private customers 14.7 14.1 6.0 5.7 26.8 27.4 - of which, resellers 9.7 3.5 7.3 1.8 7.9 14.1 - of which, business customers 23.1 31.1 8.7 14.7 61.4 53.4 Sales of gas, TWh 27.8 33.9 8.1 10.6 56.0 49.9 Number of employees, full-time equivalents 3 259 3 014 3 259 3 014 3 213
  • 10. 10 VATTENFALL INTERIM REPORT JANUARY–JUNE 2022 Power Generation Power Generation comprises the Generation and Markets Business Areas. The segment includes Vattenfall’s hydro and nuclear power operations, maintenance services business, and optimisation and trading operations including certain large business customers. The result from hedging the Group’s net exposure in electricity and fuel is reported in this segment. Earnings in the first half year negatively affected by lower achieved prices in the Nordic countries • Feasibility study initiated for construction of small modular reactors at Ringhals • New agreement for delivery of nuclear fuel to the Forsmark and Ringhals nuclear reactors • Expanded partnership with Air Liquide for delivery of renewable electricity from Vattenfall’s wind farm Hollandse Kust Zuid Q1–Q2: Net sales increased by 83%. Underlying operating profit decreased by 17%. The decrease was mainly attributable to lower achieved prices in the Nordic countries that were affected by major price differences between electricity price areas in Sweden as well as lower generation from hydro power (-2.1 TWh) and a lower realised trading result. Higher contribution from pumped hydro storage operations in Germany had an offsetting impact. The average electricity price rose compared to the first half year 2021 but the achieved price decreased due to higher price differences between electricity price areas in Sweden. Q2: Net sales increased by 95%. Underlying operating profit increased by 38% mainly owing to higher realised trading result and higher contribution from pumped hydro storage in Germany. Lower achieved prices in the Nordic countries due to major price differences between electricity price areas in Sweden as well as lower generation from hydro power -0.4 TWh) had an offsetting impact. In order to meet the next decades’ increased power demand in Sweden, Vattenfall is launching a feasibility study for the construction of at least two small modular reactors (SMR) with a capacity of 300-450 MW adjacent to the Ringhals nuclear power plant. Work on the study will start immediately and is scheduled to be completed by late 2023, early 2024. A future investment decision would be conditional upon that the study concludes that construction would be profitable and that all other conditions are met, not least in respect of new nuclear power regulations. Vattenfall has entered into agreements with Westinghouse and Framatome for the long-term delivery of nuclear fuel to the Forsmark and Ringhals reactors. These agreements are in line with Vattenfall’s strategy to remain independent of individual suppliers and countries. Vattenfall has made preparations to increase output at nuclear power reactor Forsmark 1 by just over 100 MW; half will be ready in the autumn and the other half in 2023. Electricity generation can be increased by the equivalent of the annual electricity consumption of over 100,000 Swedish households without any major technical measures. Applications to increase power have been filed with the relevant authorities. Vattenfall and Air Liquide are expanding their partnership through a 15-year corporate power purchase agreement. Starting in 2025, Vattenfall will be supplying about 500 GWh of renewable electricity to Air Liquide from its offshore wind farm Hollandse Kust Zuid. Air Liquide's plants in the Benelux region, which produce gas for industry and healthcare, will be supplied with renewable electricity throughout the agreement. This corporate power purchase agreement is in addition to the 100 GWh agreement already concluded in 2021. KEY FIGURES – POWER GENERATION Jan-Jun Jan-Jun Apr-Jun Apr-Jun Full year Last 12 Amounts in SEK million unless indicated otherwise 2022 2021 2022 2021 2021 months Net sales 89 264 48 726 39 848 20 445 126 318 166 856 External net sales 13 275 14 668 6 340 6 890 40 312 38 919 Underlying EBITDA 10 971 12 411 6 664 5 027 23 714 22 274 Underlying EBIT 8 560 10 281 5 449 3 960 19 334 17 613 - of which, realised trading result 2 388 2 767 2 345 768 3 633 3 254 Electricity generation, TWh 40.6 42.8 19.1 19.7 81.2 79.0 - of which, hydro power 19.1 21.2 9.4 9.8 40.8 38.7 - of which, nuclear power 21.5 21.6 9.7 9.9 40.4 40.3 Sales of electricity, TWh 8.2 10.5 3.5 5.2 22.2 19.9 - of which, resellers 7.3 10.0 3.1 4.9 17.5 14.8 - of which, business customers 0.9 0.5 0.4 0.3 4.7 5.1 Sales of gas, TWh 0.5 0.5 0.1 0.2 1.1 1.1 Number of employees, full-time equivalents 7 291 7 338 7 291 7 338 7 260
  • 11. 11 VATTENFALL INTERIM REPORT JANUARY–JUNE 2022 Wind The Wind Business Area is responsible for the development, construction and operation of Vattenfall’s wind farms as well as large-scale and decentralised solar power and batteries. Higher electricity prices and new capacity contributed to earnings improvement • Inauguration of Vattenfall's largest onshore wind farm Blakliden Fäbodberget • Construction permit for offshore wind power at Swedish Kriegers Flak • Acquisition of two offshore wind power projects off the coast of Gothenburg with a total capacity of 2.8 GW Q1–Q2: Net sales increased by 84% compared to 2021. Underlying operating profit increased by 224% driven by higher electricity prices on the Continent and new capacity, especially Kriegers Flak offshore wind farm in Denmark. Electricity generation increased by 21% driven by Kriegers Flak and somewhat higher generation from existing assets. Q2: Net sales increased by 76%. Underlying operating profit increased by 487% as a result of higher electricity prices, especially on the Continent, and new capacity, particularly Kriegers Flak. Electricity generation increased by 9% driven by higher generation from the offshore wind farms Sandbank and DanTysk in Germany and new capacity from Kriegers Flak. In May, the Swedish government issued a construction permit for an offshore wind farm at Swedish Kriegers Flak. Vattenfall’s application pertains to the building of 40 to 50 wind turbines with a total capacity of 640 MW, or the annual electricity consumption of nearly half a million Swedish households. The next step in the process is to obtain additional permits and to ensure the electricity grid connection on land. A potential investment decision by Vattenfall could be taken in 2025. Also in May, Vattenfall’s largest onshore wind farm Blakliden Fäbodberget in Lycksele and Åsele was inaugurated. The wind farm is co-owned with Vestas and AIP Management and has a total capacity of 353 MW, corresponding to the electricity consumption of 220,000 Swedish households. Vattenfall has acquired the majority share in two offshore wind power projects from the wind power company Zephyr Renewable. The projects -“Vidar” and “Poseidon” - are located off the coast of Gothenburg in Sweden and are expected to have a capacity of 2.8 GW, corresponding to the annual electricity consumption of more than two million Swedish households. The wind farms will primarily consist of floating wind turbines, which are expected to reduce the wind farms’ environmental impact while also enabling electricity production in locations even further away from shore. Vattenfall's ownership interest is 85%. Vattenfall has been awarded GBP 9.3 million in innovation funding from the UK government. The funds are earmarked for the development of the world’s first hydrogen-generating offshore wind turbines where the electrolyser is placed directly on existing in-service wind turbines. The work will commence immediately with the goal of first production already in 2025. Vattenfall is committed to promoting a circular economy and reducing the environmental impact throughout a product’s entire life cycle. At the offshore wind farm Hollandse Kust Zuid which is currently under construction, a new type of recyclable wind turbine blades will be installed on some of the wind turbines. The availability of this type of blades remains limited, but Vattenfall has set a target for all wind-turbine blades to be recyclable in 2030. KEY FIGURES – WIND Jan-Jun Jan-Jun Apr-Jun Apr-Jun Full year Last 12 Amounts in SEK million unless indicated otherwise 2022 2021 2022 2021 2021 months Net sales 12 966 7 056 5 011 2 844 20 872 26 782 External net sales 2 057 2 619 289 824 7 791 7 229 Underlying EBITDA 9 679 4 768 3 322 1 709 13 451 18 362 Underlying EBIT 6 729 2 079 1 829 312 7 866 12 516 Electricity generation - wind power TWh 6.3 5.2 2.3 2.2 11.2 12.3 Sales of electricity, TWh 0.6 0.5 0.2 0.2 1.0 1.1 Number of employees, full-time equivalents 1 416 1 197 1 416 1 197 1 279 Blakliden Fäbodberget onshore wind farm, Sweden
  • 12. 12 VATTENFALL INTERIM REPORT JANUARY–JUNE 2022 Heat The Heat Business Area comprises Vattenfall’s heat business (district heating and decentral solutions) and gas-fired condensing plants Lower clean spark spreads affected results negatively • Strategic review of Berlin heating activities • Takeover of municipally owned heating company Warmtebedrijf Rotterdam in the Netherlands (pending authority approval) • Sale of gas-fired Magnum power plant in the Netherlands Q1–Q2: Net sales increased by 93%. The underlying operating profit decreased by 191% compared with the first half of 2021, mainly owing to higher gas prices which led to lower clean spark spreads primarily affecting heat operations. This was partly offset by higher heat prices following newly re-negotiated contracts and post-hoc price adjustments for the fuel price development. The hedging of spreads also had an offsetting effect, which is reported under the Power Generation operating segment. Electricity generation decreased as a result of the lower spreads and sales of heat decreased due to higher temperatures. Compared with year-end 2021, the number of customers increased by 1.8% to the equivalent of 2.0 million households1 . Q2: Net sales increased by 76%. The underlying operating profit decreased by 386% compared with the second quarter 2021. Lower electricity generation following deteriorated clean spark spreads owing to higher gas prices had a negative effect. Heat sales decreased due to higher temperatures. Higher heat prices had an offsetting impact as they undergo subsequent adjustment for the increasing fuel prices. Vattenfall has initiated a strategic review of its Berlin heat business to assess Vattenfall’s continuing ownership. Irrespective of the findings, Germany will remain a key market for Vattenfall with close to 4.6 million customers in addition to the heating business as well as extensive involvement in wind and solar power, pumped storage and trading. As agreed with the municipal government, Vattenfall will take over the municipally owned heating company Warmtebedrijf Rotterdam. The takeover covers the business in its entirety and ensures that, following a period of uncertainty, customers will continue to receive reliable heat deliveries at affordable prices. Approval for the takeover is still pending before the Netherlands Authority for Consumers and Markets and the European Commission. Vattenfall has agreed with RWE on the sale of the gas-fired power plant Magnum in the Netherlands. RWE will take over the plant as of 30 September 2022. The purchase price of EUR 500 million allows Vattenfall to invest further in the energy transition, for example in fossil-free energy projects such as offshore wind power and district heating and cooling. Previous impairment losses have been reversed by an amount of SEK 0.9 billion as an effect of the transaction. In Berlin, Vattenfall has entered into a new agreement for the supply of district heating. Five residential properties in north- east Berlin will be supplied via a local district heating network with heat that is 55% produced with renewable fuel. Moreover, the German Chancellery will be connected to Vattenfall's district heating network. The agreement will run for ten years, and the first delivery of heat is planned for 2024. KEY FIGURES – HEAT Jan-Jun Jan-Jun Apr-Jun Apr-Jun Full year Last 12 Amounts in SEK million unless indicated otherwise 2022 2021 2022 2021 2021 months Net sales 27 964 14 470 10 373 5 887 34 759 48 253 External net sales 10 185 7 403 4 000 2 897 14 655 17 437 Underlying EBITDA 116 3 006 268 909 2 590 - 300 Underlying EBIT - 1 400 1 543 - 495 173 - 343 - 3 286 Electricity generation - TWh 8.6 10.8 3.2 4.1 19.0 16.8 - of which, fossil-based power 8.5 10.7 3.2 4.0 18.6 16.4 - of which, biomass, waste 0.1 0.1 — 0.1 0.3 0.3 Sales of electricity business customers, TWh 0.5 0.5 0.3 0.3 1.2 1.2 Sales of heat, TWh 8.2 9.2 2.4 2.7 15.6 14.6 Number of employees, full-time equivalents 3 141 3 182 3 141 3 182 3 126 1) Including decentralised energy solutions that have previously been reported separately
  • 13. 13 VATTENFALL INTERIM REPORT JANUARY–JUNE 2022 Distribution The Distribution Business Area comprises Vattenfall’s electricity distribution operations in Sweden and the UK. Earnings comparison affected by sale of Stromnetz Berlin in 2021 • Administrative Court of Appeal issues ruling on 2020–2023 revenue frames for electricity grid companies • 100,000 new smart electricity meters have so far been installed at Vattenfall’s customers Q1–Q2: Net sales decreased by 43% compared with 2021 and the underlying operating profit decreased by 48%. The sale of Stromnetz Berlin on 1 July 2021 affected the net sales comparison by SEK 5.3 billion and the underlying operating profit negatively by SEK 0.7 billion. In addition, the underlying operating profit was affected by a lower gross margin in the Swedish operations, mainly owing to higher costs related to the transmission network as well as an increase in network losses caused by higher electricity prices. Q2: Net sales decreased by 46%. Underlying operating profit decreased by 72%. The sale of Stromnetz Berlin on 1 July 2021 affected the net sales comparison by SEK 2.5 billion and the underlying operating profit negatively by SEK 0.3 billion. In addition, the underlying operating profit was affected by a lower gross margin in the Swedish operations, mainly owing to higher costs for the transmission network as well as an increase in network losses caused by higher electricity prices. In June, the Swedish Administrative Court of Appeal issued a ruling on the revenue frames for the electricity grid companies for regulatory period 2020-2023. The ruling means that the Swedish Energy Markets Inspectorate will need to decide on new revenue frames for the regulatory period 2020-2023. It also voids the application of previous court rulings, which creates ambiguities for how the weighted average cost of capital should be calculated. Vattenfall and other electricity grid companies appealed the decision to the Supreme Administrative Court after the end of the quarter. In April, Vattenfall reached its first milestone with 100,000 new smart electricity meters installed at our customers in Sweden. The plan is for all of Vattenfall's nearly 900,000 electricity grid customers to have the new meters by 2024. This is the second roll-out of smart meters in Sweden. These meters will allow customers to better manage electricity usage and enable the use of new climate-smart services while producing a more robust electricity grid where Vattenfall can detect and address power outages faster. One of the greatest challenges for the energy transition is the long lead times for building electricity grids. Permitting processes can take up to 10-12 years while the need is greater than ever. In May, a final report by The Climate Law Inquiry was issued on climate legislation, which contained several positive proposals for the electricity grid. The technology-choice issue, which is central for high-voltage projects, was clarified with the enquiry committee’s recommending overhead lines as the main alternative for power lines of 130 kV or higher. Compensation payments for the period December-February, which were introduced by the Swedish government and prompted by the winter's high electricity prices, were disbursed to customers in the spring. Most of Vattenfall's eligible customers have received compensation while payments for the extended compensation for March are being prepared. Uninterrupted operation of broadband and digital communications during extended power outages is becoming ever more important. In the northernmost part of Sweden, Vattenfall has inaugurated Sweden's first hydrogen-powered fuel cell facility for broadband network reserve power in collaboration with Ballard Power Systems and IT Norrbotten. Vattenfall owns and is responsible for the plant’s functionality. KEY FIGURES – DISTRIBUTION Jan-Jun Jan-Jun Apr-Jun Apr-Jun Full year Last 12 Amounts in SEK million unless indicated otherwise 2022 2021 2022 2021 2021 months Net sales 6 523 11 525 2 628 4 900 17 262 12 260 External net sales 6 181 9 198 2 434 3 843 14 643 11 626 Underlying EBITDA 2 541 3 973 813 1 340 5 913 4 481 Underlying EBIT 1 286 2 453 182 658 3 152 1 985 Number of employees, full-time equivalents 1 273 2 463 1 273 2 463 1 165
  • 14. 14 VATTENFALL INTERIM REPORT JANUARY–JUNE 2022 Other Other pertains mainly to all Staff functions, including Treasury and Shared Service Centres. Net sales consist primarily of revenues attributable to Vattenfall’s service organisations such as Shared Services, IT and Vattenfall Insurance. KEY FIGURES – OTHER Jan-Jun Jan-Jun Apr-Jun Apr-Jun Full year Last 12 Amounts in SEK million unless indicated otherwise 2022 2021 2022 2021 2021 months Net sales 4 009 3 029 2 243 1 656 6 169 7 149 External net sales 222 51 133 30 418 589 Underlying EBITDA - 348 - 358 44 - 210 - 326 - 316 Underlying EBIT - 776 - 786 - 173 - 418 - 1 189 - 1 179 Number of employees, full-time equivalents 2 927 2 763 2 927 2 763 2 792
  • 15. 15 VATTENFALL INTERIM REPORT JANUARY–JUNE 2022 Consolidated income statement Jan-Jun Jan-Jun Apr-Jun Apr-Jun Full year Last 12 Amounts in SEK million 2022 2021 2022 2021 2021 months Net sales 107 749 80 465 48 170 34 554 180 119 207 403 Cost of purchases - 55 742 - 34 116 - 21 595 - 12 602 - 87 474 - 109 100 Other external expenses - 9 406 - 9 940 - 6 291 - 6 917 - 18 450 - 17 916 Personnel expenses - 10 408 - 10 501 - 5 163 - 5 336 - 19 801 - 19 708 Other operating incomes and expenses, net 331 12 321 304 10 851 21 454 9 464 Participations in the results of associated companies 111 42 - 39 - 19 - 58 11 Operating profit before depreciation, amortisation and impairment losses (EBITDA) 32 635 38 271 15 386 20 531 75 790 70 154 Depreciation, amortisation and impairments - 8 122 - 8 676 - 3 656 - 4 321 - 15 519 - 14 965 Operating profit (EBIT) 24 513 29 595 11 730 16 210 60 271 55 189 Financial income3 382 247 201 208 783 918 Financial expenses1,2,3 - 4 108 - 2 570 - 2 449 - 1 094 - 5 906 - 7 444 Return from the Swedish Nuclear Waste Fund - 5 884 2 763 - 3 013 1 454 4 225 - 4 422 Profit before income taxes 14 903 30 035 6 469 16 778 59 373 44 241 Income taxes - 4 608 - 6 400 - 2 238 - 3 566 - 11 360 - 9 568 Profit for the period 10 295 23 635 4 231 13 212 48 013 34 673 Attributable to owner of the Parent Company 10 260 22 877 4 478 13 002 46 828 34 211 Attributable to non-controlling interests 35 758 - 247 210 1 185 462 Supplementary information Underlying EBITDA4 26 629 25 984 12 660 9 577 48 584 49 229 Underlying EBIT4 17 610 17 308 8 107 5 256 31 181 31 483 Financial items, net excl. discounting effects attributable to provisions and return from the Swedish Nuclear Waste Fund - 2 728 - 1 304 - 1 748 - 381 - 3 090 - 4 514 1) Including interest components related to pension costs - 287 - 218 - 144 - 109 - 439 - 508 2) Including discounting effects attributable to provisions - 998 - 1 019 - 500 - 505 - 2 033 - 2 012 3) Items affecting comparability recognised as financial income and expenses, net 4 - 6 4 — - 6 4 4) See note 4 for information on items affecting comparability
  • 16. 16 VATTENFALL INTERIM REPORT JANUARY–JUNE 2022 Consolidated statement of comprehensive income Jan-Jun Jan-Jun Apr-Jun Apr-Jun Full year Last 12 Amounts in SEK million 2022 2021 2022 2021 2021 months Profit for the period 10 295 23 635 4 231 13 212 48 013 34 673 Other comprehensive income Items that will be reclassified to profit or loss when specific conditions are met Cash flow hedges - changes in fair value 29 435 16 362 2 628 13 095 82 259 95 332 Cash flow hedges - dissolved against income statement - 38 567 - 3 022 - 19 545 - 1 960 - 31 553 - 67 098 Cash flow hedges - transferred to cost of hedged item 5 9 - 1 — 16 12 Hedging of net investments in foreign operations - 1 587 - 572 - 1 317 497 - 1 414 - 2 429 Translation differences, divested companies — 46 — — 697 651 Translation differences 7 626 1 332 6 278 - 1 327 3 218 9 512 Income taxes related to items that will be reclassified - 1 057 - 4 254 3 151 - 3 668 - 15 420 - 12 223 Total items that will be reclassified to profit or loss when specific conditions are met - 4 145 9 901 - 8 806 6 637 37 803 23 757 Items that will not be reclassified to profit or loss Remeasurement pertaining to defined benefit obligations 13 106 428 8 642 - 3 437 - 670 12 008 Income taxes related to items that will not be reclassified - 3 516 - 5 - 2 428 1 031 226 - 3 285 Total items that will not be reclassified to profit or loss 9 590 423 6 214 - 2 406 - 444 8 723 Total other comprehensive income, net after income taxes 5 445 10 324 - 2 592 4 231 37 359 32 480 Total comprehensive income for the period 15 740 33 959 1 639 17 443 85 372 67 153 Attributable to owner of the Parent Company 15 219 33 081 1 485 17 341 83 915 66 053 Attributable to non-controlling interests 521 878 154 102 1 457 1 100
  • 17. 17 VATTENFALL INTERIM REPORT JANUARY–JUNE 2022 Operating segments, Vattenfall Group Jan-Jun Jan-Jun Apr-Jun Apr-Jun Full year Last 12 Amounts in SEK million 2022 2021 2022 2021 2021 months External net sales Customers & Solutions 75 829 46 526 34 974 20 070 102 300 131 603 Power Generation 13 275 14 668 6 340 6 890 40 312 38 919 Wind 2 057 2 619 289 824 7 791 7 229 Heat 10 185 7 403 4 000 2 897 14 655 17 437 Distribution 6 181 9 198 2 434 3 843 14 643 11 626 - of which, Distribution Germany — 3 203 — 1 559 3 203 — - of which, Distribution Sweden 6 113 5 937 2 402 2 256 11 310 11 486 Other1 222 51 133 30 418 589 Total 107 749 80 465 48 170 34 554 180 119 207 403 Internal net sales Customers & Solutions 3 589 1 518 1 817 723 4 260 6 331 Power Generation 75 989 34 058 33 508 13 555 86 006 127 937 Wind 10 909 4 437 4 722 2 020 13 081 19 553 Heat 17 779 7 067 6 373 2 990 20 104 30 816 Distribution 342 2 327 194 1 057 2 619 634 - of which, Distribution Germany — 2 061 — 894 2 061 — - of which, Distribution Sweden 352 278 205 170 586 660 Other1 3 787 2 978 2 110 1 626 5 751 6 560 Eliminations - 112 395 - 52 385 - 48 724 - 21 971 - 131 821 - 191 831 Total — — — — — — Total net sales Customers & Solutions 79 418 48 044 36 791 20 793 106 560 137 934 Power Generation 89 264 48 726 39 848 20 445 126 318 166 856 Wind 12 966 7 056 5 011 2 844 20 872 26 782 Heat 27 964 14 470 10 373 5 887 34 759 48 253 Distribution 6 523 11 525 2 628 4 900 17 262 12 260 - of which, Distribution Germany — 5 264 — 2 453 5 264 — - of which, Distribution Sweden 6 465 6 215 2 607 2 426 11 896 12 146 Other1 4 009 3 029 2 243 1 656 6 169 7 149 Eliminations - 112 395 - 52 385 - 48 724 - 21 971 - 131 821 - 191 831 Total 107 749 80 465 48 170 34 554 180 119 207 403
  • 18. 18 VATTENFALL INTERIM REPORT JANUARY–JUNE 2022 Jan-Jun Jan-Jun Apr-Jun Apr-Jun Full year Last 12 Amounts in SEK million 2022 2021 2022 2021 2021 months Operating profit before depreciation, amortisation and impairment losses (EBITDA) Customers & Solutions 3 808 2 338 1 618 906 3 241 4 711 Power Generation 16 841 24 804 9 263 15 993 42 053 34 090 Wind 9 701 4 768 3 345 1 709 13 534 18 467 Heat 106 3 041 258 909 2 842 - 93 Distribution 2 551 3 972 813 1 340 5 911 4 490 - of which, Distribution Germany — 1 008 — 418 1 008 — - of which, Distribution Sweden 2 537 2 945 807 921 4 873 4 465 Other1 - 233 - 498 157 - 222 8 197 8 462 Eliminations - 139 - 154 - 68 - 104 12 27 Total 32 635 38 271 15 386 20 531 75 790 70 154 Underlying EBITDA Customers & Solutions 3 809 2 338 1 617 906 3 230 4 701 Power Generation 10 971 12 411 6 664 5 027 23 714 22 274 Wind 9 679 4 768 3 322 1 709 13 451 18 362 Heat 116 3 006 268 909 2 590 - 300 Distribution 2 541 3 973 813 1 340 5 913 4 481 - of which, Distribution Germany — 1 009 — 418 1 009 — - of which, Distribution Sweden 2 528 2 946 808 921 4 874 4 456 Other1 - 348 - 358 44 - 210 - 326 - 316 Eliminations - 139 - 154 - 68 - 104 12 27 Total 26 629 25 984 12 660 9 577 48 584 49 229 Jan-Jun Jan-Jun Apr-Jun Apr-Jun Full year Last 12 Amounts in SEK million 2022 2021 2022 2021 2021 months Operating profit (EBIT) Customers & Solutions 3 349 1 892 1 383 675 2 446 3 903 Power Generation 14 429 22 674 8 050 14 925 39 502 31 257 Wind 6 750 2 079 1 852 312 7 919 12 590 Heat - 512 1 579 393 172 - 91 - 2 182 Distribution 1 296 2 452 182 658 3 150 1 994 - of which, Distribution Germany — 665 — 331 665 — - of which, Distribution Sweden 1 315 1 796 193 340 2 515 2 034 Other1 - 660 - 927 - 62 - 428 7 333 7 600 Eliminations - 139 - 154 - 68 - 104 12 27 Operating profit (EBIT) 24 513 29 595 11 730 16 210 60 271 55 189 Operating profit (EBIT) 24 513 29 595 11 730 16 210 60 271 55 189 Financial income and expenses - 9 610 440 - 5 261 568 - 898 - 10 948 Profit before tax 14 903 30 035 6 469 16 778 59 373 44 241 Underlying EBIT Customers & Solutions 3 350 1 892 1 383 675 2 349 3 807 Power Generation 8 560 10 281 5 449 3 960 19 334 17 613 Wind 6 729 2 079 1 829 312 7 866 12 516 Heat - 1 400 1 543 - 495 173 - 343 - 3 286 Distribution 1 286 2 453 182 658 3 152 1 985 - of which, Distribution Germany — 666 — 331 666 — - of which, Distribution Sweden 1 305 1 796 194 340 2 516 2 025 Other1 - 776 - 786 - 173 - 418 - 1 189 - 1 179 Eliminations - 139 - 154 - 68 - 104 12 27 Underlying EBIT 17 610 17 308 8 107 5 256 31 181 31 483 1) “Other” pertains mainly to all Staff functions, including Treasury and Shared Service Centres.
  • 19. 19 VATTENFALL INTERIM REPORT JANUARY–JUNE 2022 Consolidated balance sheet 30 Jun 30 Jun 31 Dec Amounts in SEK million 2022 2021 2021 Assets Non-current assets Intangible assets: non-current 17 975 16 629 17 070 Property, plant and equipment 262 981 241 617 252 828 Participations in associated companies and joint arrangements 6 585 4 685 6 110 Other shares and participations 320 301 313 Share in the Swedish Nuclear Waste Fund 47 063 51 003 52 772 Derivative assets 68 850 15 780 35 240 Deferred tax assets 7 542 10 338 8 905 Contract assets1 63 101 85 Other non-current receivables 6 091 6 534 6 118 Total non-current assets 417 470 346 988 379 441 Current assets Inventories 46 824 19 572 41 539 Intangible assets: current 1 255 28 4 861 Trade receivables and other receivables 40 406 45 184 41 219 Contract assets1 241 439 290 Advance payments paid 10 615 1 111 8 362 Derivative assets 227 234 41 485 120 645 Prepaid expenses and accrued income 12 103 7 083 12 402 Current tax assets 1 338 791 2 717 Short-term investments 62 396 36 499 102 706 Cash and cash equivalents 90 177 20 463 68 176 Assets held for sale 5 108 21 795 — Total current assets 497 697 194 450 402 917 Total assets 915 167 541 438 782 358 Equity and liabilities Equity Attributable to owner of the Parent Company 172 503 126 855 180 710 Attributable to non-controlling interests 16 432 13 005 16 472 Total equity 188 935 139 860 197 182 Non-current liabilities Hybrid Capital 21 490 19 960 20 421 Other interest-bearing liabilities 54 453 50 917 50 839 Pension provisions 27 860 39 208 40 328 Other interest-bearing provisions 132 314 114 221 116 637 Derivative liabilities 74 096 12 120 30 307 Deferred tax liabilities 39 737 22 154 33 913 Contract liabilities1 7 695 6 902 7 422 Other noninterest-bearing liabilities 2 068 1 942 2 018 Total non-current liabilities 359 713 267 424 301 885 Current liabilities Trade payables and other liabilities 36 143 32 402 39 241 Contract liabilities1 999 828 1 213 Advance payments received 71 837 24 751 62 790 Derivative liabilities 188 027 31 321 99 511 Accrued expenses and deferred income 14 856 10 548 18 460 Current tax liabilities 2 339 2 854 2 418 Other interest-bearing liabilities 47 960 18 857 55 148 Interest-bearing provisions 4 358 3 253 4 510 Liabilities associated with assets held for sale — 9 340 — Total current liabilities 366 519 134 154 283 291 Total equity and liabilities 915 167 541 438 782 358 1) The presentation has been adjusted compared with information previously published in Vattenfall’s financial reports. See note 1.
  • 20. 20 VATTENFALL INTERIM REPORT JANUARY–JUNE 2022 SUPPLEMENTARY INFORMATION 30 Jun 30 Jun 31 Dec Amounts in SEK million 2022 2021 2021 Calculation of capital employed Intangible assets: current and non-current 19 230 16 657 21 931 Property, plant and equipment 262 981 241 617 252 828 Participations in associated companies and joint arrangements 6 585 4 685 6 110 Deferred and current tax assets 8 880 11 129 11 622 Non-current noninterest-bearing receivables 4 227 3 436 3 563 Contract assets 304 540 375 Inventories 46 824 19 572 41 539 Trade receivables and other receivables 40 406 45 184 41 219 Prepaid expenses and accrued income 12 103 7 083 12 402 Unavailable liquidity 1 870 4 252 3 446 Other 687 507 643 Total assets excl. financial assets 404 097 354 662 395 678 Deferred and current tax liabilities - 42 076 - 25 008 - 36 331 Other noninterest-bearing liabilities - 2 068 - 1 942 - 2 018 Contract liabilities - 8 694 - 7 730 - 8 635 Trade payable and other liabilities - 36 143 - 32 402 - 39 241 Accrued expenses and deferred income - 14 856 - 10 548 - 18 460 Other - 1 193 - 395 - 899 Total noninterest-bearing liabilities - 105 030 - 78 025 - 105 584 Other interest-bearing provisions not related to adjusted net debt1 - 14 216 - 9 818 - 9 213 Adjustment related to assets/liabilities held for sale 5 108 14 036 — Capital employed2 289 959 280 855 280 881 Capital employed, average 285 407 273 748 271 674 Calculation of net debt Hybrid Capital - 21 490 - 19 960 - 20 421 Bond issues and liabilities to credit institutions - 37 755 - 43 379 - 37 732 Short-term debt, commercial papers and repo - 44 036 - 4 535 - 46 189 Liabilities to associated companies - 1 066 - 984 - 1 452 Liabilities to owners of non-controlling interests - 9 945 - 11 014 - 10 747 Other liabilities - 9 611 - 9 862 - 9 867 Total interest-bearing liabilities - 123 903 - 89 734 - 126 408 Cash and cash equivalents 90 177 20 463 68 176 Short-term investments 62 396 36 499 102 706 Loans to owners of non-controlling interests in foreign Group companies 651 444 229 Net debt2 29 321 - 32 328 44 703 Calculation of adjusted gross debt and net debt Total interest-bearing liabilities - 123 903 - 89 734 - 126 408 50% of Hybrid Capital3 10 745 9 980 10 211 Present value of pension obligations - 27 860 - 39 208 - 40 328 Provisions for gas and wind operations and other environment-related provisions - 12 451 - 11 165 - 11 687 Provisions for nuclear power (net)4 - 53 433 - 39 160 - 40 233 Margin calls received 2 581 2 923 3 340 Liabilities to owners of non-controlling interests due to consortium agreements 9 945 11 014 10 747 Adjustment related to assets/liabilities held for sale — - 1 863 — Adjusted gross debt - 194 376 - 157 213 - 194 358 Reported cash and cash equivalents and short-term investments 152 573 56 962 170 882 Unavailable liquidity - 1 870 - 4 252 - 3 446 Adjusted cash and cash equivalents and short-term investments 150 703 52 710 167 436 Adjusted net debt2 - 43 673 - 104 503 - 26 922 1) Includes personnel-related provisions for non-pension purposes, provisions for tax and legal disputes and certain other provisions. 2) See Definitions and calculations of key ratios for definitions of Alternative Performance Measures. 3) 50% of Hybrid Capital is treated as equity by the rating agencies, which thereby reduces adjusted net debt. 4) The calculation is based on Vattenfall’s share of ownership in the respective nuclear power plants, less Vattenfall’s share in the Swedish Nuclear Waste Fund and liabilities relating to funding of decommissioning obligations in Stade and Brokdorf. Vattenfall has the following ownership interests in the respective plants: Forsmark 66%, Ringhals 70.4%, SKB 55,8%, Brokdorf 20%, Brunsbüttel 66.7%, Krümmel 50% and Stade 33.3%. (According to a special agreement, Vattenfall is responsible for 100% of the provisions for Ringhals.)
  • 21. 21 VATTENFALL INTERIM REPORT JANUARY–JUNE 2022 Consolidated statement of cash flows Jan-Jun Jan-Jun Apr-Jun Apr-Jun Full year Last 12 Amounts in SEK million 2022 2021 2022 2021 2021 months Operating activities Operating profit before depreciation, amortisation and impairment losses 32 635 38 271 15 386 20 531 75 790 70 154 Tax paid - 1 855 - 1 712 1 525 - 632 - 6 725 - 6 868 Capital gains/losses, net - 138 101 - 125 10 - 8 760 - 8 999 Interest received 565 176 536 116 523 912 Interest paid - 2 395 - 2 319 - 1 893 - 1 098 - 3 226 - 3 302 Other, incl. non-cash items - 8 519 - 13 092 - 3 518 - 11 488 - 11 506 - 6 933 Funds from operations (FFO) 20 293 21 425 11 911 7 439 46 096 44 964 Changes in inventories - 157 - 2 883 - 5 252 - 2 462 - 23 067 - 20 341 Changes in operating receivables 9 372 - 9 090 13 201 213 - 31 816 - 13 354 Changes in operating liabilities1 - 6 649 3 458 - 6 774 983 26 232 16 125 Margin calls1 - 3 871 23 553 13 835 18 137 88 995 61 571 Other changes - 359 - 167 - 5 234 - 345 - 4 608 - 4 800 Cash flow from changes in operating assets and operating liabilities - 1 664 14 871 9 776 16 526 55 736 39 201 Cash flow from operating activities 18 629 36 296 21 687 23 965 101 832 84 165 Investing activities Acquisitions in Group companies1 - 173 - 3 - 173 — - 114 - 284 Investments in associated companies and other shares and participations - 29 83 — 86 - 278 - 390 Other investments in non-current assets - 9 570 - 10 781 - 4 657 - 5 391 - 25 157 - 23 946 Total investments - 9 772 - 10 701 - 4 830 - 5 305 - 25 549 - 24 620 Divestments1 253 - 24 212 40 19 579 19 856 Changes in short-term investments1 40 718 - 7 185 17 141 - 7 517 - 73 051 - 25 148 Cash flow from investing activities 31 199 - 17 910 12 523 - 12 782 - 79 021 - 29 912 Cash flow before financing activities 49 828 18 386 34 210 11 183 22 811 54 253 Financing activities Changes in loans to owners of non-controlling interests in foreign Group companies - 401 - 67 54 2 153 - 181 Loans raised2 46 468 5 866 864 519 51 150 91 752 Amortisation of other debt - 51 575 - 25 712 - 20 479 - 5 487 - 35 870 - 61 733 Divestment of shares in Group companies to owners of non-controlling interests — — — — 4 025 4 025 Redemption of Hybrid Capital — - 2 837 — - 2 837 - 2 941 - 104 Issue of Hybrid Capital — 6 481 — 6 481 6 481 — Dividends paid to owners - 23 981 - 5 124 - 23 981 - 5 124 - 5 190 - 24 047 Contribution to owners of non-controlling interests - 523 - 228 - 2 — - 601 - 896 Contribution from owners of non-controlling interests 635 11 399 — 1 786 2 410 Cash flow from financing activities - 29 377 - 21 610 - 43 145 - 6 446 18 993 11 226 Cash flow for the period 20 451 - 3 224 - 8 935 4 737 41 804 65 479 Jan-Jun Jan-Jun Apr-Jun Apr-Jun Full year Last 12 Amounts in SEK million 2022 2021 2022 2021 2021 months Cash and cash equivalents Cash and cash equivalents at start of period 68 176 26 074 97 719 18 170 26 074 20 463 Cash and cash equivalents included in assets held for sale — - 2 400 — - 2 400 — 2 400 Cash flow for the period 20 451 - 3 224 - 8 935 4 737 41 804 65 479 Translation differences 1 550 13 1 393 - 44 298 1 835 Cash and cash equivalents at end of period 90 177 20 463 90 177 20 463 68 176 90 177 1) The value has been adjusted compared with information previously published in Vattenfall’s financial reports. See note 1. 2) Short-term borrowings in which the duration is three months or shorter are reported net.
  • 22. 22 VATTENFALL INTERIM REPORT JANUARY–JUNE 2022 SUPPLEMENTARY INFORMATION Jan-Jun Jan-Jun Apr-Jun Apr-Jun Full year Last 12 Amounts in SEK million 2022 2021 2022 2021 2021 months Cash flow before financing activities 49 828 18 386 34 210 11 183 22 811 54 253 Change in margin calls from Treasury operations - 1 607 - 1 131 - 1 913 76 - 1 700 - 2 176 Changes in short-term investments - 40 718 7 186 - 17 141 7 518 73 051 25 147 Financing activities Divestment of shares in Group companies to owners of non-controlling interests — — — — 4 025 4 025 Dividends paid to owners - 23 981 - 5 124 - 23 981 - 5 124 - 5 190 - 24 047 Contribution to/from owners of non-controlling interests 112 - 217 397 — 1 185 1 514 Cash flow after dividend - 16 366 19 100 - 8 428 13 653 94 182 58 716 Analysis of change in net debt Net debt at start of period 44 703 - 48 178 37 611 - 43 865 - 48 178 - 32 328 Cash flow after dividend - 16 366 19 100 - 8 428 13 653 94 182 58 716 Changes as a result of valuation at fair value 1 273 607 784 100 660 1 326 Changes in interest-bearing liabilities for leasing - 861 - 608 - 657 - 172 - 1 442 - 1 695 Interest-bearing liabilities/short-term investments acquired/divested — — — — - 13 - 13 Cash and cash equivalents included in assets held for sale — - 2 400 — - 2 400 — 2 400 Interest-bearing liabilities associated with assets held for sale — 106 — 106 — - 106 Translation differences on net debt 572 - 955 11 250 - 506 1 021 Net debt at end of period 29 321 - 32 328 29 321 - 32 328 44 703 29 321 Cash flow from operating activities 18 629 36 296 21 687 23 965 101 832 84 165 Maintenance investments - 4 117 - 3 689 - 1 661 - 1 412 - 11 012 - 11 440 Free cash flow1 14 512 32 607 20 026 22 553 90 820 72 725 1) See Definitions and calculations of key ratios for definitions of Alternative Performance Measures.
  • 23. 23 VATTENFALL INTERIM REPORT JANUARY–JUNE 2022 INVESTMENTS Jan-Jun Jan-Jun Apr-Jun Apr-Jun Full year Last 12 Amounts in SEK million 2022 2021 2022 2021 2021 months Electricity generation Hydro power 249 312 141 174 795 732 Nuclear power 744 553 347 323 1 263 1 454 Gas 141 23 90 19 64 182 Wind power and solar PV 5 625 6 496 3 506 4 227 11 157 10 286 Biomass, waste 9 39 3 3 73 43 Total electricity generation 6 768 7 423 4 087 4 746 13 352 12 697 CHP/heat Fossil-based power 257 263 70 199 1 053 1 047 Heat networks 507 575 332 392 1 511 1 443 Other 2 106 37 83 483 379 Total CHP/heat 766 944 439 674 3 047 2 869 Electricity networks Electricity networks 2 003 2 886 1 239 1 605 5 758 4 875 Total electricity networks 2 003 2 886 1 239 1 605 5 758 4 875 Purchases of shares, shareholder contributions 202 - 80 173 - 86 400 682 Other 834 640 476 352 1 557 1 751 Total investments 10 573 11 813 6 414 7 291 24 114 22 874 Accrued investments, unpaid invoices (-)/release of accrued investments (+) - 801 - 1 112 - 1 584 - 1 986 1 443 1 754 Cash and cash equivalents in acquired companies — — — — - 8 - 8 Total investments with cash flow effect 9 772 10 701 4 830 5 305 25 549 24 620
  • 24. 24 VATTENFALL INTERIM REPORT JANUARY–JUNE 2022 Consolidated statement of changes in equity 30 Jun 2022 30 Jun 2021 31 Dec 2021 Amounts in SEK million Attributable to owner of the Parent Company Attributable to non- controlling interests Total equity Attributable to owner of the Parent Company Attributable to non- controlling interests Total equity Attributable to owner of the Parent Company Attributable to non- controlling interests Total equity Balance brought forward 180 710 16 472 197 182 97 724 13 468 111 192 97 724 13 468 111 192 Profit for the period 10 260 35 10 295 22 877 758 23 635 46 828 1 185 48 013 Cash flow hedges - changes in fair value 29 435 — 29 435 16 362 — 16 362 82 259 — 82 259 Cash flow hedges - dissolved against income statement - 38 567 — - 38 567 - 3 038 16 - 3 022 - 31 569 16 - 31 553 Cash flow hedges - transferred to cost of hedged item 5 — 5 9 — 9 16 — 16 Hedging of net investments in foreign operations - 1 587 — - 1 587 - 572 — - 572 - 1 414 — - 1 414 Translation differences, divested companies — — — 46 — 46 697 — 697 Translation differences 7 140 486 7 626 1 225 107 1 332 2 983 235 3 218 Remeasurement pertaining to defined benefit obligations 13 106 — 13 106 428 — 428 - 700 30 - 670 Income taxes related to other comprehensive income - 4 573 — - 4 573 - 4 256 - 3 - 4 259 - 15 185 - 9 - 15 194 Total other comprehensive income for the period 4 959 486 5 445 10 204 120 10 324 37 087 272 37 359 Total comprehensive income for the period 15 219 521 15 740 33 081 878 33 959 83 915 1 457 85 372 Dividends paid to owners - 23 414 - 675 - 24 089 - 4 000 - 1 124 - 5 124 - 4 000 - 1 190 - 5 190 Group contributions from(+)/to(-) owners of non-controlling interests — — — — — — — 51 51 Changes in ownership in Group companies on divestments of shares to owners of non- controlling interests — — — — — — 2 538 1 508 4 046 Contribution to/from owners of non- controlling interests — 112 112 — - 217 - 217 — 1 185 1 185 Other changes in ownership — 2 2 — — — — — — Other changes - 12 — - 12 50 — 50 533 - 7 526 Total transactions with equity holders - 23 426 - 561 - 23 987 - 3 950 - 1 341 - 5 291 - 929 1 547 618 Balance carried forward 172 503 16 432 188 935 126 855 13 005 139 860 180 710 16 472 197 182 - Of which, Reserve for hedges 26 458 8 26 466 10 934 8 10 942 36 968 8 36 976
  • 25. 25 VATTENFALL INTERIM REPORT JANUARY–JUNE 2022 Key ratios, Vattenfall Group Jan-Jun Jan-Jun Apr-Jun Apr-Jun Full year Last 12 In % unless otherwise stated. (x) means times1 2022 2021 2022 2021 2021 months Operating margin 22.8 36.8 24.4 46.9 33.5 26.6 Operating margin2 16.3 21.5 16.8 15.2 17.3 15.2 Pre-tax profit margin 13.8 37.3 13.4 48.6 33.0 21.3 Pre-tax profit margin2 7.4 22.1 5.9 16.9 16.8 9.9 Return on equity 23.53 30.33 23.53 30.33 36.9 23.5 Return on capital employed 19.33 14.53 19.33 14.53 22.2 19.3 Return on capital employed2 11.03 11.03 11.03 11.03 11.5 11.0 EBIT interest cover, (x) 10.33 12.13 10.33 12.13 15.8 10.3 EBIT interest cover, (x)2 6.03 9.33 6.03 9.33 8.3 6.0 FFO interest cover, (x) 9.33 13.13 9.33 13.13 12.9 9.3 FFO interest cover, net (x) 11.03 14.73 11.03 14.73 15.9 11.0 Cash flow interest cover after maintenance investments, (x) 15.83 33.53,4 15.83 33.53,4 27.44 15.8 FFO/gross debt 36.33 44.33 36.33 44.33 36.5 36.3 FFO/net debt - 153.43 123.13 - 153.43 123.13 - 103.1 - 153.4 FFO/adjusted net debt 103.03 38.13 103.03 38.13 171.2 103.0 EBITDA/net financial items, (x) 12.0 29.3 8.8 53.9 24.5 15.5 EBITDA/net financial items, (x)2 9.8 19.9 7.2 25.1 15.7 10.9 Equity/Total assets 20.6 25.8 20.6 25.8 25.2 20.6 Gross debt/equity 65.6 64.2 65.6 64.2 64.1 65.6 Net debt/equity - 15.5 23.1 - 15.5 23.1 - 22.7 - 15.5 Gross debt/gross debt plus equity 39.6 39.1 39.6 39.1 39.1 39.6 Net debt/net debt plus equity - 18.4 18.8 - 18.4 18.8 - 29.3 - 18.4 Net debt/EBITDA, (x) - 0.43 0.53 - 0.43 0.53 - 0.6 - 0.4 Adjusted net debt/EBITDA, (x) 0.63 1.83 0.63 1.83 0.4 0.6 1) See Definitions and calculations of key ratios for definitions of Alternative Performance Measures. 2) Based on Underlying operating profit. 3) Last 12-month values. 4) The value has been adjusted compared with information previously published in Vattenfall’s financial reports.
  • 26. 26 VATTENFALL INTERIM REPORT JANUARY–JUNE 2022 Quarterly information, Vattenfall Group Q2 Q1 Q4 Q3 Q2 Q1 Amounts in SEK million 2022 2022 2021 2021 2021 2021 Income statement Net sales 48 170 59 579 63 529 36 125 34 554 45 911 Operating profit before depreciation, amortisation and impairment losses (EBITDA) 15 386 17 249 10 226 27 293 20 531 17 740 Underlying EBITDA 12 660 13 970 13 452 9 149 9 577 16 408 Operating profit (EBIT) 11 730 12 783 7 750 22 926 16 210 13 385 Underlying EBIT 8 107 9 504 9 092 4 782 5 256 12 053 Profit before income taxes 6 469 8 433 7 156 22 182 16 778 13 257 Profit for the period 4 231 6 064 6 101 18 277 13 212 10 423 - of which, attributable to owner of the Parent Company 4 478 5 782 5 774 18 178 13 002 9 875 - of which, attributable to non-controlling interests - 247 282 327 99 210 548 Balance sheet Capital employed 289 959 276 749 280 881 255 184 280 855 271 110 Net debt 29 321 37 611 44 703 47 348 - 32 328 - 43 865 Cash flow Funds from operations (FFO) 11 911 8 382 18 616 6 054 7 439 13 987 Cash flow from operating activities 9 776 - 3 058 4 312 1 61 223 1 23 965 1 12 331 1 Cash flow from investing activities 12 523 18 676 - 45 872 1 - 15 238 1 - 12 782 1 - 5 128 1 Cash flow from financing activities - 43 145 13 768 41 855 - 1 252 - 6 446 - 15 164 Cash flow for the period - 8 935 29 386 295 44 733 4 737 - 7 961 Free cash flow 20 026 - 5 514 516 1 57 696 1 22 553 1 10 054 1 1) The value has been adjusted compared with information previously published in Vattenfall’s financial reports. Q2 Q1 Q4 Q3 Q2 Q1 In % unless otherwise stated. (x) means times1 2022 2022 2021 2021 2021 2021 Key ratios Return on equity 23.5 31.0 36.9 40.2 30.3 10.0 Return on capital employed2 19.3 21.8 22.2 22.4 14.5 5.9 Return on capital employed2, 3 11.0 10.5 11.5 11.7 11.0 9.9 EBIT interest cover, (x)2 10.3 14.9 15.8 16.6 12.1 5.1 EBIT interest cover, (x)2, 3 6.0 7.3 8.3 8.7 9.3 8.6 FFO/gross debt2 36.3 28.8 36.5 46.0 44.3 40.0 FFO/net debt2 - 153.4 - 107.7 - 103.1 - 82.0 123.1 83.8 FFO/adjusted net debt2 103.0 120.5 171.2 182.7 38.1 32.8 Equity/Total assets 20.6 24.4 25.2 27.8 25.8 26.8 Gross debt/equity 65.6 66.7 64.1 44.2 64.2 72.0 Net debt/equity - 15.5 - 17.9 - 22.7 - 24.8 23.1 34.4 Net debt/net debt plus equity - 18.4 - 21.8 - 29.3 - 32.9 18.8 25.6 Net debt/EBITDA, (x)2 - 0.4 - 0.5 - 0.6 - 0.6 0.5 0.9 Adjusted net debt/EBITDA, (x)2 0.6 0.4 0.4 0.3 1.8 2.4 1) See Definitions and calculations of key ratios for definitions of Alternative Performance Measures. 2) Last 12-month values. 3) Based on Underlying operating profit.
  • 27. 27 VATTENFALL INTERIM REPORT JANUARY–JUNE 2022 NOTE 1 | Accounting policies, risks and uncertainties Accounting policies This interim report for the Group has been prepared in accordance with IAS 34 – “Interim Financial Reporting”, and the Swedish Annual Accounts Act. The accounting policies and calculation methods applied in this interim report are the same as those described in Vattenfall’s 2021 Annual and Sustainability Report in Note 3 to the consolidated accounts, Accounting policies. Amended IFRSs endorsed by the EU for application in the 2022 financial year have no significant effect on Vattenfall’s financial statements. Risks and uncertainties For a description of risks, uncertainties and risk management, please refer to Vattenfall’s 2021 Annual and Sustainability Report, pages 62-71. Vattenfall continues to face high credit exposures in Business Area Markets. High market prices and volatility levels in the European commodity markets seen already in the second half of 2021 continued into first half of 2022. This was amplified further by the Russian invasion of Ukraine at the end of February which especially impacted the gas market where continued low gas storage levels in combination with the EU proposal for minimum gas storage fills and Russia's announcement to only accept Ruble as currency for energy purchases as of April 2022 has led to increased uncertainty. A reduction, or stop, of gas deliveries from Russia to Europe will have a negative effect on Vattenfall’s operations in Business Areas Heat, Customers & Solutions as well as Markets. Countries with low capacity to import Liquid Natural Gas (LNG), such as Germany, will be particularly affected. Furthermore, risks and uncertainties can arise from regulatory interventions, but these cannot yet be specified. The war in Ukraine Vattenfall has assessed potential effects on its financial statements as per the first half year 2022 due to Russia’s invasion of Ukraine. Vattenfall has no operations and participations either in Ukraine or the countries currently under sanctions, respectively. Implications on Vattenfall’s long- term view are continuously evaluated. However, the war in Ukraine has not materially changed Vattenfall’s long term outlook for Vattenfall’s markets in a negative way. Hence, this is not regarded as a triggering event for an impairment test in the second quarter. One of the main risks for Vattenfall are defaults by customers and counterparties caused by the continued high electricity and commodity prices. The development is closely monitored and if necessary Expected Credit Losses are adjusted in future periods. The credit risk of counterparties is minimized to a large extent through margin securities. Due to the strong increase in electricity prices, counterparties had to provide margin securities to Vattenfall. Conversely, if electricity prices were to fall significantly, Vattenfall would have to fund a large outflow of cash for margin securities. Presentation of financial statements In the interim reports for 2022 the following amendments in the presentations were made compared to Vattenfall’s 2021 Annual and Sustainability Report: • In the balance sheet contractual assets and liabilities are divided into short- and long-term contractual assets and liabilities respectively. • In the cash flow statement acquisitions in group companies as well as divestments are shown as the net of acquisition price and cash in acquired companies and the net of sales price and cash in divested companies respectively. In addition, changes in margin calls from the treasury operations, which were previously included in short term investments in cash flow from investments as well as changes in operating liabilities, are included in Margin calls related to derivatives. Other Significant related-party transactions are described in Note 44 to the consolidated accounts in Vattenfall’s 2021 Annual and Sustainability Report. No material changes have taken place in relations or transactions with related parties since the publication. NOTE 2 | Exchange rates KEY EXCHANGE RATES APPLIED IN THE ACCOUNTS OF THE VATTENFALL GROUP Jan-Jun Jan-Jun Apr-Jun Apr-Jun Full year 2022 2021 2022 2021 2021 Average rate EUR 10.4590 10.1312 10.4670 10.1586 10.1469 DKK 1.4059 1.3622 1.4070 1.3660 1.3644 GBP 12.4055 11.6450 12.3329 11.8168 11.7820 USD 9.5913 8.4030 9.8041 8.4870 8.5687 30 Jun 30 Jun 31 Dec 2022 2021 2021 Balance sheet date rate EUR 10.7300 10.1110 10.2503 DKK 1.4424 1.3597 1.3784 GBP 12.5029 11.7837 12.1987 USD 10.3302 8.5081 9.0502
  • 28. 28 VATTENFALL INTERIM REPORT JANUARY–JUNE 2022 NOTE 3 | Financial instruments by measurement category and related effects on income For assets and liabilities with a remaining maturity less than three months (e.g., cash and bank balances, trade receivables and other receivables and trade payables and other payables), fair value is considered to be equal to the carrying amount. For Other shares and participations the fair value is approximated by using cost. The carrying amounts of financial assets measured at amortised cost do not differ significantly from their fair values. The difference between carrying amounts and fair values for financial liabilities measured at amortised cost amounts to SEK -1,365 million (31 December 2021: 8,509). Financial instruments that are measured at fair value on the balance sheet are described below according to the fair value hierarchy (levels), which in IFRS 13 is defined as: Level 1: Quoted prices (unadjusted) in active markets for identical assets or liabilities. Level 2: Inputs other than quoted prices included in Level 1 that are observable for the asset or liability, either directly (that is, as prices) or indirectly (that is, derived from prices). In Level 2 Vattenfall reports mainly commodity derivatives, currency-forward contracts and interest rate swaps. Level 3: Inputs for the asset or liability that are not based on observable market data (that is, unobservable inputs). FINANCIAL ASSETS AND LIABILITIES THAT ARE MEASURED AT FAIR VALUE ON THE BALANCE SHEET AT 30 JUNE 2022 Amounts in SEK million Level 1 Level 2 Level 3 Total Assets Share in the Swedish Nuclear Waste Fund 47 063 — — 47 063 Derivative assets — 293 823 2 261 296 084 Short-term investments, cash equivalents and other shares and participations 65 744 6 213 — 71 957 Total assets 112 807 300 036 2 261 415 104 Liabilities Derivative liabilities — 262 123 — 262 123 Total liabilities — 262 123 — 262 123 FINANCIAL ASSETS AND LIABILITIES THAT ARE MEASURED AT FAIR VALUE ON THE BALANCE SHEET AT 31 DECEMBER 2021 Amounts in SEK million Level 1 Level 2 Level 3 Total Assets Share in the Swedish Nuclear Waste Fund 52 772 — — 52 772 Derivative assets — 154 744 1 141 155 885 Short-term investments, cash equivalents and other shares and participations 116 013 11 404 — 127 417 Total assets 168 785 166 148 1 141 336 074 Liabilities Derivative liabilities — 129 818 — 129 818 Total liabilities — 129 818 — 129 818
  • 29. 29 VATTENFALL INTERIM REPORT JANUARY–JUNE 2022 NOTE 4 | Items affecting comparability Items affecting comparability include capital gains and capital losses from sale of shares and other non-current assets, impairment losses and reversed impairment losses and other material items that are of an infrequent nature. Also included here are, for trading activities, changes in the fair value of energy derivatives, which according to IFRS 9 cannot be recognised using hedge accounting and changes in the fair value of inventories. Jan-Jun Jan-Jun Apr-Jun Apr-Jun Full year Last 12 Amounts in SEK million 2022 2021 2022 2021 2021 months Items affecting comparability 6 903 12 287 3 623 10 954 29 090 23 706 - of which, capital gains 204 41 187 - 7 8 960 9 123 - of which, capital losses - 66 - 142 - 63 - 3 - 199 - 123 - of which, impairment losses - 1 — - 1 — - 38 - 39 - of which, reversed impairment losses 898 — 898 — 1 922 2 820 - of which, provisions - 2 551 - 2 452 - 2 551 - 2 452 - 3 785 - 3 884 - of which, changes in the fair value of energy derivatives 5 210 2 745 400 2 267 8 715 11 180 - of which, changes in the fair value of inventories 3 209 156 4 750 318 1 313 4 366 - of which, other non-recurring items affecting comparability — 11 939 3 10 831 12 202 263 Items affecting comparability during the first half of 2022 amounted to SEK 6.9 billion, most of which pertains to changes in market value for energy derivatives and inventories (SEK 8.4 billion) and provisions in nuclear operations (SEK -2.6 billion). The reversed impairment losses relates to gas-fired condensing plants in Business Area Heat. Items affecting comparability during the first half of 2021 amounted to SEK 12.3 billion, most of which pertains to result from sale of and compensation for Nuclear production rights in Germany (SEK 12.5 billion), and changes in market value for energy derivatives and inventories (SEK 2.9 billion). The increase in provisions pertains to the nuclear operations (SEK - 2.5 billion). Capital gains and losses pertain mainly to smaller divestments in Business Area Wind (SEK -0.1 billion).
  • 30. 30 VATTENFALL INTERIM REPORT JANUARY–JUNE 2022 NOTE 5 | Acquired and divested operations Acquired operations On 17th of June 2022 Vattenfall acquired 85% of the shares in Zephyr Vind AB. The total purchase price for the shares was SEK 173 million, and the value of total net assets acquired is SEK 9 million.
  • 31. 31 VATTENFALL INTERIM REPORT JANUARY–JUNE 2022 The Parent Company Vattenfall AB Accounting policies The Parent Company Vattenfall AB’s accounts are prepared in accordance with the Swedish Annual Accounts Act and recommendation RFR 2 – Accounting for Legal Entities, issued by the Swedish Financial Reporting Board. The accounting policies used in this interim report are the same as those described in Vattenfall’s 2021 Annual and Sustainability Report, Note 3 to the Parent Company accounts, Accounting policies. New accounting policies applicable from 1 January 2022 has had no significant effect on the Parent Company’s financial statements. January – June 2022 A condensed income statement and balance sheet for the Parent Company are presented below. • Net sales amounted to SEK 17,656 million (20,286). • Profit before appropriations and income taxes was SEK -35,149 million (1,979). • The lower operating profit are mainly attributable to changes in market value for energy derivatives. In addition, the Parent Company is charged with increased commitments for future decommissioning of Ringhals and Forsmark resulting from increased provisions for those group companies and the negative development of the share in the Swedish Nuclear Waste Fund. • The improved net financial items refers to dividends from group companies, mainly from Vattenfall GmbH. • The balance sheet total was SEK 413,822 million (31 December 2021: 468,482). • Cash and cash equivalents, and short-term investments amounted to SEK 109,712 million (31 December 2021: 145,743). • Dividend paid to the owner of SEK 23 414 million (4,000). Risks and uncertainties See Note 1 to the consolidated accounts, Accounting policies, risks and uncertainties. Other The owners to the Swedish nuclear companies are required to provide security to the Swedish state as a guarantee that sufficient funds exist to cover the future costs of nuclear waste management. The security is provided in the form of guarantee commitments from the owners of the nuclear power companies and includes both financial and supplementary security.The state has during the first six month during 2022 decided to increase the levels of the security. The effect for Vattenfall AB will be an increase of 14,7 billion SEK. Significant related-party transactions are described in Note 44 to the consolidated accounts, Related party disclosures, in Vattenfall’s 2021 Annual and Sustainability Report. No material changes have taken place in relations or transactions with related parties compared with the description in Vattenfall’s 2021 Annual and Sustainability Report.
  • 32. 32 VATTENFALL INTERIM REPORT JANUARY–JUNE 2022 Parent Company income statement Jan-Jun Jan-Jun Full year Last 12 Amounts in SEK million 2022 2021 2021 months Net sales 17 656 20 286 40 045 37 415 Cost of purchases related to production - 61 365 - 16 589 - 37 035 - 81 811 Other external expenses - 2 620 - 2 205 - 5 250 - 5 665 Personnel expenses - 1 827 - 1 151 - 2 247 - 2 923 Other operating incomes and expenses, net - 32 - 32 - 52 - 52 Operating profit before depreciation, amortisation and impairment losses (EBITDA) - 48 188 309 - 4 539 - 53 036 Depreciation, amortisation and impairments - 329 - 317 - 629 - 641 Operating profit (EBIT) - 48 517 - 8 - 5 168 - 53 677 Result from participations in subsidiaries 15 757 2 206 2 231 15 782 Result from participations in associated companies - 61 — 1 - 60 Other financial income 950 978 1 537 1 509 Other financial expenses - 3 278 - 1 197 - 2 820 - 4 901 Profit before appropriations and income taxes - 35 149 1 979 - 4 219 - 41 347 Appropriations 2 290 713 5 086 6 663 Profit before income taxes - 32 859 2 692 867 - 34 684 Income taxes 9 685 - 119 445 10 249 Profit for the period - 23 174 2 573 1 312 - 24 435
  • 33. 33 VATTENFALL INTERIM REPORT JANUARY–JUNE 2022 Parent Company balance sheet 30 Jun 30 Jun 31 Dec Amounts in SEK million 2022 2021 2021 Assets Non-current assets Intangible assets: non-current 302 348 330 Property, plant and equipment 6 906 6 618 7 003 Shares and participations 166 963 161 477 166 802 Deferred tax assets 11 981 1 208 2 272 Other non-current receivables 71 151 68 545 71 123 Total non-current assets 257 303 238 196 247 530 Current assets Inventories 284 335 342 Intangible assets: current 13 4 9 Current receivables group 6 237 9 948 59 366 Current receivables 39 185 7 217 13 791 Current tax assets 1 088 — 1 701 Short-term investments 61 582 35 652 101 877 Cash and cash equivalents 48 130 17 341 43 866 Total current assets 156 519 70 497 220 952 Total assets 413 822 308 693 468 482 Equity, provisions and liabilities Equity Restricted equity Share capital (131,700,000 shares with a share quota value of SEK 50) 6 585 6 585 6 585 Revaluation reserve 37 989 37 989 37 989 Other reserves 1 363 1 349 1 370 Non-restricted equity Retained earnings 42 816 66 209 64 911 Profit for the period - 23 174 2 573 1 312 Total equity 65 579 114 705 112 167 Untaxed reserves 4 878 12 628 7 168 Provisions 6 077 5 086 5 621 Non-current liabilities Hybrid capital 21 490 19 960 20 421 Other interest-bearing liabilities group 222 10 1 573 Other interest-bearing liabilities 46 483 36 976 37 902 Other noninterest-bearing liabilities group 12 590 12 488 12 590 Other noninterest-bearing liabilities 8 585 275 279 Total non-current liabilities 89 370 69 709 72 765 Current liabilities Other interest-bearing liabilities group 151 711 79 195 197 355 Other interest-bearing liabilities 49 365 18 638 54 960 Current tax liabilities — 183 — Other noninterest-bearing liabilities group 1 249 2 629 4 521 Other noninterest-bearing liabilities 45 593 5 920 13 925 Total current liabilities 247 918 106 565 270 761 Total equity, provisions and liabilities 413 822 308 693 468 482
  • 34. 34 VATTENFALL INTERIM REPORT JANUARY–JUNE 2022 Definitions and calculations of key ratios Alternative Performance Measures In order to ensure a fair presentation of the Group’s operations, the Vattenfall Group uses a number of Alternative Performance Measures that are not defined in IFRS or in the Swedish Annual Accounts Act. The Alternative Performance Measures that Vattenfall uses are described below, including their definitions and how they are calculated. The Alternative Performance Measures used are unchanged compared with earlier periods. Definition EBIT: Operating profit (Earnings Before Interest and Tax) EBITDA: Operating profit before depreciation, amortisation and impairment losses (Earnings Before Interest, Tax, Depreciation and Amortisation) Items affecting comparability: Capital gains and capital losses from shares and other non-current assets, impairment losses and reversed impairment losses and other material items that are of an infrequent nature. Also included here are, for trading activities, changes in the fair value of energy derivatives, which according to IFRS 9 cannot be recognised using hedge accounting and changes in the fair value of inventories. See Consolidated income statement for a specification of items affecting comparability. Underlying EBITDA: Underlying operating profit before depreciation, amortisation and impairment losses. This measure is intended to provide a better view on the operating result by excluding items affecting comparability that are of an infrequent nature, while also excluding non-cash depreciation and amortisation. Underlying operating profit: Operating profit (EBIT) excluding items affecting comparability. This measure is intended to provide a better view on the operating result by excluding items affecting comparability that are of an infrequent nature. FFO: Funds From Operations, see Consolidated statement of cash flow Free cash flow: Cash flow from operating activities less maintenance investments Interest-bearing liabilities See Consolidated balance sheet - Supplementary Information Net debt: See Consolidated balance sheet - Supplementary Information Adjusted net debt: See Consolidated balance sheet - Supplementary Information Capital employed: Total assets less financial assets, noninterest-bearing liabilities and certain other interest-bearing provisions not included in adjusted net debt. see Consolidated balance sheet - Supplementary Information Other definitions Definition Hybrid Capital: Perpetual subordinated securities, junior to all Vattenfall’s unsubordinated debt instruments. LTIF: Lost Time Injury Frequency (LTIF) is expressed in terms of the number of lost time work injuries (per 1 million hours worked), i.e., work-related accidents resulting in absence longer than one day, and accidents resulting in fatality. CALCULATION OF EBITDA, UNDERLYING EBITDA AND UNDERLYING EBIT Jan-Jun Jan-Jun Apr-Jun Apr-Jun Full year Last 12 Amounts in SEK million 2022 2021 2022 2021 2021 months Operating profit (EBIT) 24 513 29 595 11 730 16 210 60 271 55 189 Depreciation, amortisation and impairment losses - 8 122 - 8 676 - 3 656 - 4 321 - 15 519 - 14 965 Operating profit before depreciation, amortisation and impairment losses (EBITDA) 32 635 38 271 15 386 20 531 75 790 70 154 Items affecting comparability excl. impairment losses and reversed impairment losses - 6 006 - 12 287 - 2 726 - 10 954 - 27 206 - 20 925 Underlying operating profit before depreciation, amortisation and impairment losses 26 629 25 984 12 660 9 577 48 584 49 229 Operating profit (EBIT) 24 513 29 595 11 730 16 210 60 271 55 189 Items affecting comparability - 6 903 - 12 287 - 3 623 - 10 954 - 29 090 - 23 706 Underlying operating profit 17 610 17 308 8 107 5 256 31 181 31 483
  • 35. 35 VATTENFALL INTERIM REPORT JANUARY–JUNE 2022 The key ratios are presented as percentages (%) or times (x). KEY RATIOS BASED ON CONTINUING OPERATIONS AND LAST 12-MONTH VALUES JULY 2021 – JUNE 2022 Operating margin, % = 100 x EBIT 55 189 = 26.6 Net sales 207 403 Operating margin excl. items = 100 x Underlying EBIT 31 483 = 15.2 affecting comparability, % Net sales 207 403 Pre-tax profit margin, % = 100 x Profit before income taxes 44 241 = 21.3 Net sales 207 403 Pre-tax profit margin excl. items = 100 x Profit before income taxes excl. items affecting comparability 20 531 = 9.9 affecting comparability, % Net sales 207 403 Return on equity, % = 100 x Profit for the period attributable to owner of the Parent Company 34 211 = 23.5 Average equity for the period attributable to owner of the 145 294 Parent Company excl. the Reserve for cash flow hedges Return on capital employed, % = 100 x EBIT 55 189 = 19.3 Capital employed, average 285 407 Return on capital employed excl. = 100 x Underlying EBIT 31 483 = 11.0 items affecting comparability, % Capital employed, average 285 407 EBIT interest cover, (x) = EBIT + financial income 56 107 = 10.3 Financial expenses excl. discounting effects attributable to 5 432 provisions EBIT interest cover excl. Items = Underlying EBIT + financial income 32 401 = 6.0 affecting comparability, (x) Financial expenses excl. discounting effects attributable to 5 432 provisions FFO + financial expenses excl. FFO interest cover, (x) = discounting effects attributable to provisions 50 396 = 9.3 Financial expenses excl. discounting effects attributable to 5 432 provisions FFO + financial items net excl. discounting effects attributable FFO interest cover, net, (x) = to provisions and return from the Swedish Nuclear Waste Fund 49 478 = 11.0 Financial items net excl. discounting effects attributable to 4 514 provisions and return from the Swedish Nuclear Waste Fund
  • 36. 36 VATTENFALL INTERIM REPORT JANUARY–JUNE 2022 Cash flow from operating activities less maintenance investments + financial expenses excl. Discounting Cash flow interest cover after = effects attributable to provisions and interest components related to pension costs 77 649 = 15.8 maintenance investments, (x) Financial expenses excl. discounting effects attributable to 4 924 provisions and interest components related to pension costs FFO/gross debt, % = 100 x FFO 44 964 = 36.3 Interest-bearing liabilities 123 903 FFO/net debt, % = 100 x FFO 44 964 = -153.4 Net debt -29 321 FFO/adjusted net debt, % = 100 x FFO 44 964 = 103.0 Adjusted net debt 43 673 EBITDA/net financial = EBITDA 70 154 = 15.5 items, (x) Financial items net excl. discounting effects attributable to 4 514 provisions and return from the Swedish Nuclear Waste Fund EBITDA excl. items affecting = EBITDA excl. items affecting comparability 49 229 = 10.9 comparability/net financial Financial items net excl. discounting effects attributable to 4 514 items, (x) provisions and return from the Swedish Nuclear Waste Fund KEY RATIOS BASED ON THE BALANCE SHEET PER 30 JUNE 2022 Equity/total assets, % = 100 x Equity 188 935 = 20.6 Balance sheet total 915 167 Gross debt/equity, % = 100 x Interest-bearing liabilities 123 903 = 65.6 Equity 188 935 Net debt/equity, % = 100 x Net debt -29 321 = -15.5 Equity 188 935 Gross debt/gross debt = 100 x Interest-bearing liabilities 123 903 = 39.6 equity, % Interest-bearing liabilities + equity 312 838 Net debt/net debt plus = 100 x Net debt -29 321 = -18.4 equity, % Net debt + equity 159 614 Net debt/EBITDA, (x) = Net debt -29 321 = -0.4 EBITDA 70 154 Adjusted net debt/ = Adjusted net debt 43 673 = 0.6 EBITDA, (x) EBITDA 70 154
  • 37. 37 VATTENFALL INTERIM REPORT JANUARY–JUNE 2022 This is information is such that Vattenfall AB is obliged to make public in accordance with the EU Market Abuse Regulation and the Swedish Securities Markets Act. The information was submitted for publication, through the agency of the contact persons set out above, at 08.00 CEST on 22 July 2022. This report has been prepared in both Swedish and English versions. In the event of discrepancies between the two versions, the Swedish version shall govern. Interim report signature The Board of Directors and the President certify that this half-year interim report presents a true and fair overview of the Vattenfall Group’s and the Parent Company Vattenfall AB’s operations, financial position and results of operations, and describes the significant risks and uncertainties facing the Parent Company and the companies belonging to the Group. Solna, 22 July 2022 Financial calendar Interim report January-September, 27 October 2022 Year-end report 2022, 8 February 2023 Mats Granryd Chairman of the Board Viktoria Bergman Håkan Erixon Tomas Kåberger Rolf Ohlsson Fredrik Rystedt Anna Borg President and CEO Ann Carlsson Daniel Kristiansson Robert Lönnqvist Jeanette Regin Contact information Vattenfall AB (publ) 169 92 Stockholm Corporate identity number 556036-2138 T +46 8-739 50 00 www.vattenfall.com www.vattenfall.se Anna Borg President and CEO T +46 8-739 50 09 Kerstin Ahlfont CFO T +46 8-739 64 28 Ruben van Bavel Acting Head of Group Control & Investor Relations T +31 650 126 296 Vattenfall’s press office T +46 8-739 50 10 press@vattenfall.com