Q2 2020: Interim report January-June
•
0 gefällt mir•377 views

Vattenfall’s report for the first six months shows stable operations through the pandemic. However a challenging market and write-downs give a negative result for the period.

Empfohlen
Weitere ähnliche Inhalte
Was ist angesagt?
Was ist angesagt? (20)
Ähnlich wie Q2 2020: Interim report January-June
Ähnlich wie Q2 2020: Interim report January-June (11)
Mehr von Vattenfall
Mehr von Vattenfall (15)
Kürzlich hochgeladen
Kürzlich hochgeladen (20)
Q2 2020: Interim report January-June
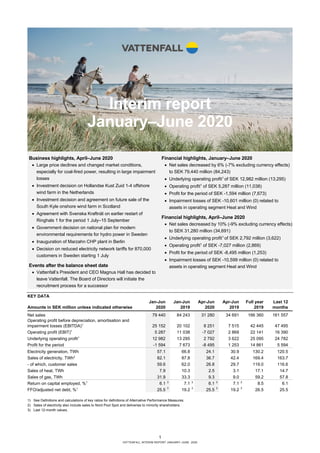
- 1. 1 VATTENFALL INTERIM REPORT JANUARY–JUNE 2020 Interim report January–June 2020 KEY DATA Jan-Jun Jan-Jun Apr-Jun Apr-Jun Full year Last 12 Amounts in SEK million unless indicated otherwise 2020 2019 2020 2019 2019 months Net sales 79 440 84 243 31 280 34 691 166 360 161 557 Operating profit before depreciation, amortisation and impairment losses (EBITDA)1 25 152 20 102 8 251 7 515 42 445 47 495 Operating profit (EBIT)1 5 287 11 038 -7 027 2 869 22 141 16 390 Underlying operating profit1 12 982 13 295 2 792 3 622 25 095 24 782 Profit for the period -1 594 7 673 -8 495 1 253 14 861 5 594 Electricity generation, TWh 57.1 66.8 24.1 30.9 130.2 120.5 Sales of electricity, TWh2 82.1 87.8 36.7 42.4 169.4 163.7 - of which, customer sales 59.6 62.0 26.8 29.7 119.0 116.6 Sales of heat, TWh 7.9 10.3 2.5 3.1 17.1 14.7 Sales of gas, TWh 31.9 33.3 9.3 9.0 59.2 57.8 Return on capital employed, %1 6.1 3 7.1 3 6.1 3 7.1 3 8.5 6.1 FFO/adjusted net debt, %1 25.5 3 19.2 3 25.5 3 19.2 3 26.5 25.5 1) See Definitions and calculations of key ratios for definitions of Alternative Performance Measures. 2) Sales of electricity also include sales to Nord Pool Spot and deliveries to minority shareholders. 3) Last 12-month values. Business highlights, April–June 2020 • Large price declines and changed market conditions, especially for coal-fired power, resulting in large impairment losses • Investment decision on Hollandse Kust Zuid 1-4 offshore wind farm in the Netherlands • Investment decision and agreement on future sale of the South Kyle onshore wind farm in Scotland • Agreement with Svenska Kraftnät on earlier restart of Ringhals 1 for the period 1 July–15 September • Government decision on national plan for modern environmental requirements for hydro power in Sweden • Inauguration of Marzahn CHP plant in Berlin • Decision on reduced electricity network tariffs for 870,000 customers in Sweden starting 1 July Events after the balance sheet date • Vattenfall’s President and CEO Magnus Hall has decided to leave Vattenfall. The Board of Directors will initiate the recruitment process for a successor Financial highlights, January–June 2020 • Net sales decreased by 6% (-7% excluding currency effects) to SEK 79,440 million (84,243) • Underlying operating profit1 of SEK 12,982 million (13,295) • Operating profit1 of SEK 5,287 million (11,038) • Profit for the period of SEK -1,594 million (7,673) • Impairment losses of SEK -10,601 million (0) related to assets in operating segment Heat and Wind Financial highlights, April–June 2020 • Net sales decreased by 10% (-9% excluding currency effects) to SEK 31,280 million (34,691) • Underlying operating profit1 of SEK 2,792 million (3,622) • Operating profit1 of SEK -7,027 million (2,869) • Profit for the period of SEK -8,495 million (1,253) • Impairment losses of SEK -10,599 million (0) related to assets in operating segment Heat and Wind
- 2. 2 VATTENFALL INTERIM REPORT JANUARY–JUNE 2020 CEO’s comment Difficult market conditions but stable operations Electricity, gas and heat have been delivered to Vattenfall’s customers with a high level of service and without major disruptions, despite the pandemic. Our employees have dealt with the situation in an exemplary way and have adapted their ways of working and routines to ensure safe and reliable operation of our facilities. On the other hand, we are seeing strained market conditions in many respects, especially for fossil-fired power generation. While this is not surprising, it is now resulting in large write-downs. Vattenfall is thus reporting a loss for the second quarter and first half of 2020. Volatile electricity market Development of the Nordic electricity market (which has the single- largest impact on Vattenfall’s earnings) has been volatile, with large fluctuations. During the first half of the year the system price peaked at around EUR 30/MWh, but fell recently to under EUR 1/MWh – an historically low level. This is mainly explained by large runoff into reservoirs and a high level of wind power generation. Extreme price differences have arisen between price areas in Sweden, partly due to transfer challenges in the transmission grid. After reaching an agreement with Svenska Kraftnät, Ringhals 1 was brought online earlier than planned following its maintenance outage, to stabilise the frequency. Stable underlying result but impairments For understandable reasons, fossil-fired power generation is especially exposed in today’s challenging market. Germany’s parliament has adopted a law calling for the phase-out of coal, which is in line with the international trend and Vattenfall’s strategy to phase out fossil fuels. However, a natural consequence of this is that the value of fossil-fired plants is decreasing. The value of Vattenfall’s coal-fired power plant in Hamburg, Moorburg, has been written down by SEK 9.1 billion due to low margins and this trend. Falling electricity prices are having a substantial and negative impact on Vattenfall. Assets particularly in Swedish wind power have been written down by SEK 1.5 billion as a result of this. The combined effect of these write-downs is that profit for the first half of the year and second quarter amounted to SEK -1.6 billion and SEK -8.5 billion, respectively. In recent years we have seen a positive trend for Vattenfall, and operationally we are showing a relatively stable result for the first half of the year. However, during the second quarter we were affected very negatively by low electricity prices. Underlying operating profit was SEK 13.0 billion for the first half of the year and SEK 2.8 billion for the second quarter. This represents a decrease of SEK 0.3 billion and SEK 0.8 billion, respectively, for the two periods. Leaving the company in a clear direction Despite a tumultuous market development in many respects, the future direction is clear. We see continued support for investments in fossil-free energy solutions. Among other measures, during the quarter we took the decision to invest in what will be the world’s largest offshore wind farm, Hollandse Kust Zuid 1-4 in the Netherlands (1.5 GW, equivalent to the annual electricity consumption of approximately 2 million households). After many exciting and inspiring years as CEO of Vattenfall I have decided to step down. It has been an incredibly inspiring journey together with engaged colleagues in the executive team and across the company who have all worked hard to take Vattenfall to its current position. Vattenfall is one of the drivers towards a fossil-free energy future and I will remain fully committed until my successor is in place. Magnus Hall President and CEO Profit for the period -1.6SEK billion First half of 2020 Underlying operating profit 13.0SEK billion First half of 2020 FFO/adjusted net debt 25.5% Last 12 months Return on capital employed 6.1% Last 12 months
- 3. 3 VATTENFALL INTERIM REPORT JANUARY–JUNE 2020 Group overview Customer sales development Sales of electricity, excluding sales to Nord Pool Spot and deliveries to minority shareholders, decreased by 2.4 TWh to 59.6 TWh (62.0) as a result of lower volumes in the Nordic countries and in the B2B segment in Germany. Higher sales in the B2B segment in France had a countering effect. Sales of gas decreased by 1.4 TWh to 31.9 TWh (33.3), mainly owing to warmer weather in the Netherlands and Germany. Sales of heat decreased by 2.4 TWh to 7.9 TWh (10.3), which is mainly due to the divestment of the heat operations in Hamburg in September 2019. CUSTOMER SALES (TWh) Generation development Total electricity generation decreased by 9.7 TWh to 57.1 TWh (66.8) during the first half of 2020. Lower nuclear power (-7.2 TWh) and fossil-based power generation (-5.5 TWh) were partly countered by higher hydro power (+1.9 TWh) and wind power generation (+1.1 TWh). ELECTRICITY GENERATION (TWh) Price development Average Nordic electricity spot prices were 84% lower, at EUR 5.6/MWh (35.6) during the second quarter of 2020 compared with the corresponding period in 2019, mainly owing to a very high hydrological balance. Spot prices in Germany were 43% lower, at EUR 20.3/MWh (35.8), and prices in the Netherlands decreased by 46% to EUR 20.9/MWh (39.1). Electricity prices in Germany and the Netherlands were mainly affected by lower fuel prices and warm weather coupled with lower demand. Electricity futures prices for delivery in 2021 and 2022 were 14%–32% lower than during the second quarter of 2019. Compared with the second quarter of 2019, the average spot price for gas was 59% lower, at EUR 5.3 EUR/MWh (13.0). The spot price for coal was 22% lower, at USD 42.5/t (54.5). The futures price for gas was 35% lower, at EUR 12.3/MWh (18.9), and the futures price for coal was 25% lower, at USD 54.0/t (71.7). The price of CO2 emission allowances was 17% lower, at EUR 21.2/t (25.5). AVERAGE INDICATIVE NORDIC HEDGE PRICES (SE, DK, FI) AS PER 30 JUNE 2020 EUR/MWh 2020 2021 2022 33 30 31 VATTENFALL’S ESTIMATED NORDIC HEDGE RATIO (%) AS PER 30 JUNE 2020 ACHIEVED NORDIC ELECTRICITY PRICES (SE, DK, FI)1 EUR/MWH SENSITIVITY ANALYSIS – CONTINENTAL PORTFOLIO (DE, NL, UK) +/-10% price impact on future profit before tax, SEK million2 Market- quoted 2021 2022 2023 Observed yearly volatility3 Electricity +/- 951 +/- 1,261 +/- 1,436 17%-23% Coal -/+ 77 -/+ 93 -/+ 122 16%-19% Gas -/+ 332 -/+ 587 -/+ 690 17%-23% CO2 -/+ 278 -/+ 358 -/+ 412 44%-46% 1) Achieved prices from the spot market and hedges. Includes Nordic hydro, nuclear and wind power generation. 2) The denotation +/- entails that a higher price affects operating profit favourably, and -/+ vice versa. 3) Observed yearly volatility for daily price movements for each commodity, based on forward contracts. Volatility normally decreases the further ahead in time the contracts pertain to. Jan-Jun 2020 Jan-Jun 2019 Apr-Jun 2020 Apr-Jun 2019 Full year 2019 28 32 30 28 32 0 10 20 30 40 50 60 70 Electricity Gas Heat Jan-Jun 2019 Jan-Jun 2020 0 10 20 30 Fossil Nuclear Hydro Wind Biomass, waste Jan-Jun 2019 Jan-Jun 2020 65 57 29 0 20 40 60 80 2020 2021 2022
- 4. 4 VATTENFALL INTERIM REPORT JANUARY–JUNE 2020 Net sales Comment January–June: Consolidated net sales decreased by SEK 4.8 billion (including positive currency effects of SEK 0.9 billion). The decrease is mainly attributable to lower electricity prices and lower sales volumes in the Nordic countries and the Netherlands, and lower revenue from the heat operations. Comment April–June: Consolidated net sales decreased by SEK 3.4 billion (including negative currency effects of SEK 0.2 billion). The decrease is mainly attributable to lower electricity prices and lower sales volumes in the Nordic countries and the Netherlands. Earnings Comment January–June: The underlying operating profit decreased by SEK 0.3 billion, which is explained by: • Lower earnings contribution from the Power Generation operating segment (SEK -1.5 billion), mainly owing to lower achieved prices in the Nordic countries and a decrease in nuclear power generation, which was partly compensated by a higher realised earnings contribution from the trading operations • Higher earnings contribution from the Customers & Solutions operating segment (SEK +0.9 billion) resulting from a strong sales contribution in Germany and the Netherlands. Lower depreciation in the Netherlands also contributed positively • Higher earnings contribution from the Distribution operating segment (SEK +0.7 billion) due to lower costs, which were elevated in 2019 as a result of Storm Alfrida • Other items, net (SEK -0.3 billion) Items affecting comparability amounted to SEK -7.7 billion (-2.3), of which most pertain to impairment losses in the Heat (SEK -9.1 billion) and Wind (SEK -1.5 billion) operating segments. This was partly countered by unrealised changes in market value for energy derivatives and inventories (SEK 2.7 billion) and the sale of nuclear power production rights in Germany (SEK 1.6 billion). Profit for the period totalled SEK -1.6 billion (7.7) and was affected by, in addition to items affecting comparability, lower net financial items associated with a lower return from the Swedish Nuclear Waste Fund and tax costs arising from SEK 1.2 billion in impairment of deferred tax assets, as well as the additional not recognized deferred tax asset of SEK 2.7 billion during the quarter associated with an impairment loss for the Moorburg power plant. Comment April–June: The underlying operating profit decreased by SEK 0.8 billion. Negative contributions from the Power Generation (SEK -0.7 billion) and Wind (SEK -0.5 billion) operating segments were countered by a positive contribution from the Customers & Solutions operating segment (SEK +0.3 billion). Items affecting comparability amounted to SEK -9.8 billion (-0.8), of which most pertained to impairment losses in the Heat (SEK -9.1 billion) and Wind (SEK -1.5 billion) operating segments, which were partly countered by unrealised changes in market value for energy derivatives and inventories (SEK 2.3 billion). Profit for the period was SEK -8.5 billion (1.3), where the negative effect of items affecting comparability and higher tax cost resulting from the impairment of deferred tax assets were countered by higher net financial items resulting from a higher return from the Swedish Nuclear Waste Fund. Cash flow Comment January–June: Funds from operations (FFO) increased by SEK 0.8 billion, mainly owing to a higher operating profit before depreciation, amortisation and impairment losses (EBITDA). Cash flow from changes in working capital was SEK -9.3 billion. The largest contributing factors were changes related to CO2 emission allowances (SEK -4.5 billion), the net change in margin calls (SEK -1.0 billion), the net change in operating receivables and operating liabilities resulting from seasonal effects in the Customers & Solutions and Heat operating segments (SEK -0.9 billion), and an increase in inventories (SEK -0.9 billion). Comment April–June: Funds from operations (FFO) decreased by SEK 1.6 billion, mainly owing to a lower operating profit before depreciation, amortisation and impairment losses (EBITDA) and higher paid tax. Cash flow from changes in working capital was SEK 11.5 billion, which is mainly explained by the net change in margin calls (SEK 7.7 billion) and the net change in operating receivables and operating liabilities resulting from seasonal effects in the Customers & Solutions and Heat operating segments (SEK 5.7 billion). An increase in inventories had a negative effect (SEK -0.5 billion). Events after the balance sheet date • Vattenfall’s President and CEO Magnus Hall has decided to leave Vattenfall. The Board of Directors will initiate the recruitment process for a successor KEY FIGURES – GROUP OVERVIEW Jan-Jun Jan-Jun Apr-Jun Apr-Jun Full year Last 12 Amounts in SEK million 2020 2019 2020 2019 2019 months Net sales 79 440 84 243 31 280 34 691 166 360 161 557 Operating profit before depreciation, amortisation and impairment losses (EBITDA)1 25 152 20 102 8 251 7 515 42 445 47 495 Operating profit (EBIT)1 5 287 11 038 - 7 027 2 869 22 141 16 390 Underlying operating profit1 12 982 13 295 2 792 3 622 25 095 24 782 Items affecting comparability1 - 7 695 - 2 257 - 9 819 - 753 - 2 954 - 8 392 Profit for the period - 1 594 7 673 - 8 495 1 253 14 861 5 594 Funds from operations (FFO)1 16 656 15 845 4 420 6 057 34 949 35 760 Cash flow from changes in operating assets and operating liabilities (working capital) - 9 265 - 17 725 11 504 3 028 - 18 230 - 9 770 Cash flow from operating activities 7 391 - 1 880 15 924 9 085 16 719 25 990 1) See Definitions and calculations of key ratios for definitions of Alternative Performance Measures.
- 5. 5 VATTENFALL INTERIM REPORT JANUARY–JUNE 2020 Capital structure Cash and cash equivalents, and short-term investments increased by SEK 9.4 billion compared with the level at 31 December 2019. Committed credit facilities consist of a EUR 2.0 billion Revolving Credit Facility that expires on 10 December 2021 and a credit facility of SEK 3.0 billion that expires on 15 June 2021. As per 30 June 2020 available liquid assets and/or committed credit facilities amounted to 39% of net sales. Vattenfall’s target is to maintain a level of no less than 10% of consolidated net sales, but at least the equivalent of the next 90 days’ maturities. Net debt and adjusted net debt increased by SEK 7.3 billion and SEK 8.3 billion, respectively, compared with the levels at 31 December 2019. This is mainly attributable to a negative cash flow after investments (SEK 2.3 billion) and paid dividend to owner (SEK 3.6 billion) as well as minority owners (SEK 0.8 billion). In addition, adjusted net debt was affected by increased provisions for nuclear power (SEK 2.4 billion). NET DEBT ADJUSTED NET DEBT Strategic objectives In 2015 Vattenfall’s board of directors decided that Vattenfall’s strategic objectives would be 1) Leading towards Sustainable Consumption and 2) Leading towards Sustainable Production, with 3) High Performing Operations and 4) Empowered and Engaged People. Effective 1 January 2016 Vattenfall’s board adopted six strategic targets linked to these four strategic objectives. These strategic targets are outlined below. The strategic direction is still the same, but in 2019 a new element was added to reflect the importance of a connected and optimised energy system to enable fossil-free living. The updated strategy is described in more detail in Vattenfall’s Annual and Sustainability Report 2019. Strategic objectives Targets for 2020 Q2 2020 Full Year 2019 Leading towards Sustainable Consumption 1. Customer engagement, Net Promoter Score relative to peers1 (NPS relative): +2 +1 +1 Leading towards Sustainable Production 2. Aggregated commissioned new renewables capacity 2016-2020: ≥2,300 MW 3. Absolute CO2 emissions pro rata: ≤21 Mt 1,322 MW 5.9 Mt 1 226 MW 19.3 Mt2 High Performing Operations 4. Return On Capital Employed (ROCE), last 12 months: ≥8% 6.1% 8.5% Empowered and Engaged People 5. Lost Time Injury Frequency (LTIF): ≤1.25 6. Employee Engagement Index3 : ≥70% 1.9 - 2.1 69% 1) The target is a positive NPS in absolute terms and +2 compared to Vattenfall’s peer competitors to be achieved by 2020. 2) The outcome includes the divested heat operations in Hamburg, where emissions amounted to 1.1 Mt during the period January-September 2019. 3) Documentation for measurement of target achievement us derived from the results of an employee survey, which is conducted on an annual basis. 0 30 60 90 120 0 30 000 60 000 90 000 120 000 Q1 2019 Q2 2019 Q3 2019 Q4 2019 Q1 2020 Q2 2020 %MSEK Interest-bearing liabilities, MSEK Net debt, MSEK Gross debt/equity, % Net debt/equity, % 0 5 10 15 20 25 30 0 30 000 60 000 90 000 120 000 150 000 Q1 2019 Q2 2019 Q3 2019 Q4 2019 Q1 2020 Q2 2020 %MSEK Adjusted net debt, MSEK FFO/adjusted net debt, %
- 6. 6 VATTENFALL INTERIM REPORT JANUARY–JUNE 2020 Operating segments Jan-Jun Jan-Jun Apr-Jun Apr-Jun Full year Last 12 Amounts in SEK million 2020 2019 2020 2019 2019 months Underlying operating profit Customers & Solutions 1 407 507 389 111 1 337 2 237 Power Generation 6 882 8 419 2 325 2 981 15 437 13 900 - of which, trading 1 748 944 - 26 73 1 794 2 598 Wind 2 002 1 851 - 144 365 4 155 4 306 Heat 589 1 087 - 291 - 443 550 52 Distribution 2 917 2 264 843 997 4 998 5 651 - of which, Distribution Germany 468 501 136 140 1 132 1 099 - of which, Distribution Sweden 2 449 1 752 706 857 3 856 4 553 Other1 - 750 - 652 - 296 - 291 - 1 274 - 1 372 Eliminations - 65 - 181 - 34 - 98 - 108 8 Underlying operating profit 12 982 13 295 2 792 3 622 25 095 24 782 1) “Other” pertains mainly to all Staff functions, including Treasury and Shared Service Centres. Customers & Solutions Power Generation – Generation Power Generation – Markets Wind Heat Distribution
- 7. 7 VATTENFALL INTERIM REPORT JANUARY–JUNE 2020 Customers & Solutions The Customers & Solutions Business Area is responsible for sales of electricity, gas and energy services in all of Vattenfall’s markets. Strong sales development in Germany and continued expansion in charging solutions for electric cars • Continued good customer growth in France and Germany • New partnerships and flexible charging solutions for electric cars • Vattenfall earns high sustainability ranking in new survey Q1–Q2: Net sales decreased mainly owing to lower prices in the Nordic countries and the Netherlands and to lower volumes in these markets as a result of warmer weather and slightly lower consumption in conjunction with the Covid-19 crisis. This was partly offset by a larger customer base in Germany and higher volumes in the B2B segment in France. Underlying operating profit increased mainly due to a strong sales contribution from Germany and the Netherlands. Lower depreciation in the Netherlands also contributed to the increase. Q2: Net sales decreased mainly owing to lower prices and volumes in the Nordic countries and the Netherlands. This was partly offset by higher volumes in the B2B segment in France. Underlying operating profit increased mainly as a result of lower depreciation in the Netherlands. Compared with year-end 2019, the total customer base decreased from 10.2 to 9.9 million contracts. The decrease is mainly related to the divestment of the sales business in the UK, iSupplyEnergy, during the first quarter of 2020. The increase in sales of electricity is mainly related to higher volumes in the B2B segment in France. In Sweden Vattenfall signed an agreement with electrical technology wholesaler Elektroskandia Sverige AB under which the company will be able to offer it’s end customers e-vehicle charging solutions and related payment services. Elektroskandia will sell the hardware, and Vattenfall will be responsible for operation of the charging stations. In the Netherlands, Vattenfall entered into an agreement with the automotive distributor Louwman Group. Customers who buy a Toyota or Lexus hybrid electric or fully electric car will receive a flexible home charger and an InCharge card that can be used at public charging stations. Also in the Netherlands, Vattenfall has equipped 80 public charging stations with new software that regulates the charging speed for e-vehicles. When the available amount of electricity is high, vehicles are charged at maximum speed, while the charging speed is temporarily reduced if the amount of available electricity drops. This type of flexible solution creates room in the electricity grid to be able to add more intermittent renewable energy sources. Vattenfall earned a high sustainability ranking in the Sustainable Brand Index, Europe’s largest brand study on sustainability. The most remarkable improvement was achieved in the Netherlands, where the Vattenfall brand was launched in 2019 and replaced Nuon. Vattenfall earned an eighth place ranking among all brands in the country and was ranked as the second most sustainable energy company among private customers. KEY FIGURES – CUSTOMERS & SOLUTIONS Jan-Jun Jan-Jun Apr-Jun Apr-Jun Full year Last 12 Amounts in SEK million unless indicated otherwise 2020 2019 2020 2019 2019 months Net sales 44 514 46 088 18 234 19 401 89 859 88 285 External net sales 43 764 44 745 17 904 18 881 87 343 86 362 Underlying operating profit before depreciation, amortisation and impairment losses 1 857 1 313 615 530 3 021 3 565 Underlying operating profit 1 407 507 389 111 1 337 2 237 Sales of electricity, TWh 48.3 45.9 21.8 21.7 89.5 91.9 - of which, private customers 13.8 14.7 5.3 5.9 28.0 27.1 - of which, resellers 3.9 3.4 1.7 1.8 6.5 7.0 - of which, business customers 30.6 27.8 14.8 14.0 55.0 57.8 Sales of gas, TWh 29.5 30.6 8.2 8.1 54.2 53.1 Number of employees, full-time equivalents 2 948 3 172 2 948 3 172 3 150
- 8. 8 VATTENFALL INTERIM REPORT JANUARY–JUNE 2020 Power Generation Power Generation comprises the Generation and Markets Business Areas. The segment includes Vattenfall’s hydro and nuclear power operations, maintenance services business, and optimisation and trading operations including certain large business customers. Nuclear power contributing to network stability • Lower achieved prices and lower nuclear power generation • Agreement with TSO Svenska Kraftnät on earlier restart of Ringhals 1 for the period 1 July–15 September • Government decision on national plan for modern environmental requirements for hydro power in Sweden Q1–Q2: Net sales decreased mainly as a result of lower electricity prices in the Nordic countries driven by a high hydrological balance, which was partly offset by hedging. Net sales were also negatively affected by lower sales of electricity and gas in the B2B segment in Germany, lower internal sales and lower nuclear power generation. Underlying operating profit decreased as a result of lower achieved prices in the Nordic countries and lower nuclear power generation. This was partly compensated by a higher realised trading result. Nuclear power generation decreased by 7.2 TWh during the first half of 2020, mainly due to the prolonged shutdowns of Ringhals 1 and 3 in conjunction with the yearly revisions and the closure of Ringhals 2. Combined availability for Vattenfall’s nuclear power plants was 78.9% (88.4%). Hydro power generation increased by 1.9 TWh during the first half of the year. Nordic reservoir levels were at 64% of capacity (69%), which is 3 percentage points above the normal level. Q2: Net sales decreased mainly owing to lower electricity prices in the Nordic countries and lower sales of electricity and gas in the B2B segment in Germany. This was partly offset by hedging. Underlying operating profit decreased mainly as a result of lower achieved prices. To support stability in the Swedish electricity grid, an agreement was entered into with the Transmission System Operator (TSO) Svenska Kraftnät under which Ringhals 1 is now being operated during the period 1 July–15 September in exchange for approximately SEK 300 million in compensation. Previously it was planned that Ringhals 1 would not be restarted until after the summer due to the prevailing market situation. Ringhals 1 will be operated until year-end 2020, at which time the reactor will be permanently shut down. Separate agreements have also been signed with Svenska Kraftnät to enable down-regulation of capacity at Ringhals during periods of high frequency in the electricity grid and to provide the gas turbine at Forsmark as part of the so-called capacity reserve. On 25 June the Swedish government announced its decision on the national plan for modern environmental requirements for hydro power. The decision entails that the greatest possible consideration will be given to cap production capacity losses resulting from environmental measures at 1.5 TWh. The regulation capacity and available capacity are to be as high as possible and provide the opportunity to increase the capacity in developed water bodies. During the second quarter, Vattenfall sold the Finnish maintenance services business to TMV Line Oy. Vattenfall will focus on the Swedish market going forward. KEY FIGURES – POWER GENERATION Jan-Jun Jan-Jun Apr-Jun Apr-Jun Full year Last 12 Amounts in SEK million unless indicated otherwise 2020 2019 2020 2019 2019 months Net sales 44 411 53 096 18 167 18 617 102 378 93 693 External net sales 16 260 18 076 6 368 6 870 38 425 36 609 Underlying operating profit before depreciation, amortisation and impairment losses 8 905 10 278 3 364 3 914 19 207 17 834 Underlying operating profit 6 882 8 419 2 325 2 981 15 437 13 900 - of which, realized trading result 1 748 944 - 26 73 1 794 2 598 Electricity generation, TWh 40.4 45.7 17.7 21.3 89.0 83.7 - of which, hydro power 20.3 18.4 10.4 8.4 35.7 37.6 - of which, nuclear power 20.1 27.3 7.3 12.9 53.3 46.1 Sales of electricity, TWh 10.1 14.9 4.5 7.4 27.0 22.2 - of which, resellers 9.1 12.8 4.0 6.4 22.8 19.1 - of which, business customers 1.0 2.1 0.5 1.0 4.2 3.1 Sales of gas, TWh 2.4 2.7 1.1 0.9 5.0 4.7 Number of employees, full-time equivalents 7 506 7 353 7 506 7 353 7 429
- 9. 9 VATTENFALL INTERIM REPORT JANUARY–JUNE 2020 Wind The Wind Business Area is responsible for development, construction and operation of Vattenfall’s wind farms as well as large-scale and decentralised solar power and batteries. Important steps for continued growth in renewables • Final investment decision for the world’s largest offshore wind farm, Hollandse Kust Zuid 1-4, in the Netherlands • Final investment decision for the South Kyle onshore wind farm in Scotland and agreement on future divestment • Second quarter earnings negatively impacted by lower wind speeds, lower electricity prices and lower availability • The value of wind farms in Sweden and Denmark written down by SEK 1.5 billion Q1–Q2: Net sales and underlying operating profit increased during the first half of 2020 owing to new capacity (mainly the Horns Rev 3 offshore wind farm in Denmark) and higher production from strong winds early in the year. This was partly offset by lower electricity prices. Q2: Net sales and underlying operating profit decreased compared with the same quarter in 2019 due to lower wind speeds, lower electricity prices and lower availability, mainly in offshore wind. Electricity generation was unchanged as new capacity was offset by lower wind speeds and availability. Following updated price assumptions, the value of onshore and offshore wind farms in Sweden as well as onshore wind farms in Denmark has been written down by SEK 1.5 billion in total. These wind farms have been in operation for more than 10 years and the original investments were made in a market characterised by higher costs and more immature technology. The write-downs are reported in items affecting comparability. In June Vattenfall took the final investment decision for construction of what will be the world’s largest offshore wind farm, Hollandse Kust Zuid 1-4, in the Netherlands. The wind farm will have installed capacity of 1,500 MW, which is equivalent to the annual electricity consumption of more than two million Dutch households. Vattenfall was awarded the construction permits after winning two tender rounds and has chosen to combine the two projects for process and cost optimisation. The wind farm is planned to be fully operational in 2023. At the end of April the final investment decision was also taken to construct the onshore South Kyle Wind Farm (240 MW) in Scotland. Vattenfall has entered into a partnership with renewable infrastructure fund Greencoat UK Wind, which will acquire the wind farm following its completion. Vattenfall will construct the wind farm and manage its operation on behalf of Greencoat for a minimum of 10 years. Vattenfall will also purchase the power for a period of 15 years. South Kyle will be able to power some 170,000 UK homes with renewable electricity per year, saving close to 300,000 tonnes in CO2 emissions annually. During the quarter Vattenfall completed construction of the Coevoerden solar park in the Netherlands. The solar park has a capacity of 7 MW and has been sold to the Belgian insurance company Patronale. In April, installation of solar panels at the Haringvliet hybrid energy park in Haringvliet, the Netherlands, was begun. Haringvliet combines 38 MW of solar energy, 22 MW of onshore wind power and 12 MW of battery capacity. The plant is planned to be operational at year-end 2020. KEY FIGURES – WIND Jan-Jun Jan-Jun Apr-Jun Apr-Jun Full year Last 12 Amounts in SEK million unless indicated otherwise 2020 2019 2020 2019 2019 months Net sales 6 951 6 418 2 219 2 760 13 492 14 025 External net sales 3 552 3 012 491 1 174 6 578 7 118 Underlying operating profit before depreciation, amortisation and impairment losses 4 781 4 459 1 241 1 718 9 620 9 942 Underlying operating profit 2 002 1 851 - 144 365 4 155 4 306 Electricity generation - wind power TWh 5.6 4.5 2.1 2.0 9.7 10.8 Sales of electricity, TWh 0.6 0.7 0.2 0.3 1.3 1.2 Number of employees, full-time equivalents 1 074 939 1 074 939 1 000
- 10. 10 VATTENFALL INTERIM REPORT JANUARY–JUNE 2020 Heat The Heat Business Area comprises Vattenfall’s heat business (district heating and decentral solutions) and gas- and coal-fired condensing plants Large impairment loss for the coal-fired plant Moorburg • The value of Moorburg written down by SEK 9.1 billion • Inauguration of Marzahn combined heat and power plant in Berlin • Agreement on installation of climate-smart district heating network in the UK Q1–Q2: Net sales and underlying operating profit decreased compared with a year ago, mainly owing to the sale of the district heating operations in Hamburg in September 2019 and the closure of the Hemweg 8 coal-fired power plant in December 2019. These factors affected the comparison for net sales by SEK 3.0 billion and for underlying operating profit by SEK 0.6 billion. Lower clean dark spreads and clean spark spreads also had a negative effect. Compared with year-end 2019, the number of customers increased by 0.7% to 1.8 million households. Q2: Net sales decreased compared with a year ago, mainly owing to the sale of the district heating operations in Hamburg and the closure of Hemweg 8, which affected the comparison for net sales by SEK 1.1 billion and for underlying operating profit by SEK 0.1 billion. The underlying operating result was higher as a result of higher clean sparks spreads which was partly countered by lower clean dark spreads. An impairment loss of SEK 9.1 billion has been recognised for Vattenfall’s Moorburg coal-fired plant in Hamburg due to a combination of low market prices and reduced opportunities for future hard coal condensing operations related to Germany’s phase-out of coal. The impairment loss is reported in items affecting comparability. During the quarter Vattenfall inaugurated the Marzahn combined heat and power plant in Berlin. The new gas-fired plant is highly efficient, with an efficiency of more than 90%. The plant has installed capacity of 260 MW of electricity and 230 MW of heat. Together with Vattenfall’s Klingenberg CHP plant, Marzahn forms the basis for the district heating supply to approximately 450,000 households in the eastern parts of Berlin. The commissioning of Marzahn is expected to reduce CO2 emissions by 240,000 tonnes per year. Since 2009 Vattenfall has reduced its annual CO2 emissions in Berlin from 13.3 tonnes to less than 6 million tonnes. In the UK, Vattenfall signed an agreement with property developer Argent Related on installation of a climate-smart district heating network for some 6,700 new homes and 280,000 square metres of new office, retail and commercial space at the Brent Cross South development in north London. The district heating network is expected to be operational in 2023. In Amsterdam the northwest and southeast district heating networks have been joined together. In parallel with this, construction is under way of boilers and a hot water storage facility. The project will pave the way for continued growth through connection of up to 290,000 homes by 2040. KEY FIGURES – HEAT Jan-Jun Jan-Jun Apr-Jun Apr-Jun Full year Last 12 Amounts in SEK million unless indicated otherwise 2020 2019 2020 2019 2019 months Net sales 11 456 17 566 4 404 7 028 31 403 25 293 External net sales 7 232 9 157 2 894 3 451 15 947 14 022 Underlying operating profit before depreciation, amortisation and impairment losses 2 492 2 887 677 486 4 409 4 014 Underlying operating profit 589 1 087 - 291 - 443 550 52 Electricity generation - TWh 11.1 16.6 4.3 7.6 31.5 26.0 - of which, fossil-based power 10.9 16.4 4.2 7.5 31.1 25.6 - of which, biomass, waste 0.2 0.2 0.1 0.1 0.4 0.4 Sales of electricity business customers, TWh 0.6 0.5 0.3 0.3 1.2 1.3 Sales of heat, TWh 7.9 10.3 2.5 3.1 17.1 14.7 Number of employees, full-time equivalents 3 241 3 890 3 241 3 890 3 310
- 11. 11 VATTENFALL INTERIM REPORT JANUARY–JUNE 2020 Distribution The Distribution Business Area comprises Vattenfall’s electricity distribution operations in Sweden, Germany (Berlin) and the UK. Lower network tariffs in Sweden and measures to counteract network capacity shortage • Decision on reduced electricity network tariffs for 870,000 customers connected to the local grid in Sweden, starting 1 July • R&D project for development of a flexibility market in the Greater Stockholm area • New technology allows for elimination of the use of greenhouse gas SF6 Q1–Q2: Net sales decreased during the first half of 2020 as higher revenues from the Swedish regional network associated with higher costs from the Transmission System Operator were offset by the effect of lower distributed volumes in local networks and a lower contribution from Germany. Underlying profit increased as a result of lower operating expenses, which were elevated in 2019 by the impact of Storm Alfrida. Q2: Net sales decreased compared with the same period in 2019, mainly driven by a lower contribution from Germany and the effect of a change in the tariff structure for the Swedish regional network. Underlying operating profit decreased as a result of a lower gross margin in the Swedish regional network and slightly higher operating costs and depreciation. In October 2019, the Swedish Energy Markets Inspectorate communicated its decision on the revenue frames for the 2020- 2023 regulatory period and the weighted average cost of capital (WACC) was set at the low level of 2.16%, compared with 5.85% for the preceding regulatory period. As an adaptation to this, Vattenfall Eldistribution reduced its network tariff for 870,000 private and business customers connected to the local grid by approximately 5%, effective 1 July 2020. The revenue frames for 2020-2023 have been appealed by many electricity distribution companies, including Vattenfall. The new revenue regulation is set in an ordinance, and the electricity distribution companies must prove that the decision is in violation of the law as well as the ordinance. The new ordinance is very detailed, and according to the European Commission it may be in contravention of EU directives. The Swedish legal process is ongoing in the Administrative Court in Linköping. In the course of this process an additional company was added for comparison, and the regulator thereby reviewed the WACC calculation. The updated WACC is 2.35%, which is the level that will apply if the ordinance remains. Vattenfall’s Swedish distribution companies are awaiting the outcome of this process and are balancing the uncertainty with tentative low revenue frames, the need of network investments and stable network tariffs. To enable an adaptation of available capacity in the electricity grid, Vattenfall is participating in a research project aimed at developing and testing a flexibility market in the Greater Stockholm area. In such a market, electricity consumers could refrain from or reduce their electricity consumption, and electricity producers could adapt their electricity generation. These measures would thereby help prevent shortages of capacity from arising in the electricity grid. The new services are planned to be implemented this coming winter, when electricity use is the highest and the need for flexibility will also be the highest. In Berlin, Vattenfall’s subsidiary Stromnetz Berlin has commissioned a new connection point, a 110 kV substation, to which the Marzahn combined heat and power plant is connected. The Marzahn CHP in Berlin is a key piece of the puzzle in the city’s ambition to be climate-neutral by 2050. To avoid the use of the greenhouse gas sulphur hexafluoride (SF6), a new technology for insulating high voltage circuit breakers is being used where possible. In a power grid station in Siemensstadt, Berlin, new high voltage breakers were installed in early June. These work without SF6 and instead rely on pure air as the insulating gas. KEY FIGURES – DISTRIBUTION Jan-Jun Jan-Jun Apr-Jun Apr-Jun Full year Last 12 Amounts in SEK million unless indicated otherwise 2020 2019 2020 2019 2019 months Net sales 10 928 11 546 4 784 5 414 22 540 21 922 External net sales 8 529 9 204 3 558 4 294 17 903 17 228 Underlying operating profit before depreciation, amortisation and impairment losses 4 604 3 860 1 694 1 810 8 248 8 992 Underlying operating profit 2 917 2 264 843 997 4 998 5 651 Number of employees, full-time equivalents 2 335 2 218 2 335 2 218 2 247
- 12. 12 VATTENFALL INTERIM REPORT JANUARY–JUNE 2020 Other Other pertains mainly to all Staff functions, including Treasury and Shared Service Centres. Net sales consist primarily of revenues attributable to Vattenfall’s service organisations such as Shared Services, IT and Vattenfall Insurance. KEY FIGURES – OTHER Jan-Jun Jan-Jun Apr-Jun Apr-Jun Full year Last 12 Amounts in SEK million unless indicated otherwise 2020 2019 2020 2019 2019 months Net sales 2 850 2 770 1 451 1 417 5 556 5 636 External net sales 103 49 65 21 164 218 Underlying operating profit before depreciation, amortisation and impairment losses - 328 - 257 - 86 - 92 - 457 - 528 Underlying operating profit - 750 - 652 - 296 - 291 - 1 274 - 1 372 Number of employees, full-time equivalents 2 651 2 700 2 651 2 700 2 678
- 13. 13 VATTENFALL INTERIM REPORT JANUARY–JUNE 2020 Consolidated income statement Jan-Jun Jan-Jun Apr-Jun Apr-Jun Full year Last 12 Amounts in SEK million 2020 2019 2020 2019 2019 months Net sales 79 440 84 243 31 280 34 691 166 360 161 557 Cost of purchases - 38 002 - 44 862 - 13 108 - 17 142 - 87 580 - 80 720 Other external expenses - 8 862 - 9 705 - 5 307 - 4 904 - 22 675 - 21 832 Personnel expenses - 10 271 - 10 258 - 5 131 - 5 142 - 20 249 - 20 262 Other operating incomes and expenses, net 2 641 442 486 3 6 167 8 366 Participations in the results of associated companies 206 242 31 9 422 386 Operating profit before depreciation, amortisation and impairment losses (EBITDA) 25 152 20 102 8 251 7 515 42 445 47 495 Depreciation, amortisation and impairments - 19 865 - 9 064 - 15 278 - 4 646 - 20 304 - 31 105 Operating profit (EBIT)1 5 287 11 038 - 7 027 2 869 22 141 16 390 Financial income2,5 2 348 2 501 2 155 1 244 2 703 2 550 Financial expenses3,4,5 - 4 708 - 3 188 - 1 097 - 1 623 - 6 522 - 8 042 Profit before income taxes 2 927 10 351 - 5 969 2 490 18 322 10 898 Income taxes expense - 4 521 - 2 678 - 2 526 - 1 237 - 3 461 - 5 304 Profit for the period - 1 594 7 673 - 8 495 1 253 14 861 5 594 Attributable to owner of the Parent Company - 2 238 6 6486 - 8 826 9356 13 173 4 287 Attributable to non-controlling interests 644 1 0256 331 3186 1 688 1 307 Supplementary information Underlying operating profit before depreciation, amortisation and impairment losses 22 246 22 359 7 471 8 268 43 940 43 827 Underlying operating profit 12 982 13 295 2 792 3 622 25 095 24 782 Financial items, net excl. discounting effects attributable to provisions and return from the Swedish Nuclear Waste Fund - 1 567 - 1 720 - 330 - 956 - 3 774 - 3 621 1) Including items affecting comparability - 7 695 - 2 257 - 9 819 - 753 - 2 954 - 8 392 - of which, capital gains 215 398 214 5 3 538 3 355 - of which, capital losses - 39 - 15 - 33 - 9 - 25 - 49 - of which, impairment losses - 10 601 — - 10 599 — - 1 459 - 12 060 - of which, provisions - 769 - 526 - 1 197 - 526 - 3 431 - 3 674 - of which, unrealised changes in the fair value of energy derivatives 2 989 - 483 2 021 387 - 1 688 1 784 - of which, unrealised changes in the fair value of inventories - 277 - 909 253 - 227 - 556 76 - of which, restructuring costs - 95 - 142 - 76 - 41 - 148 - 101 - of which, other non-recurring items affecting comparability 882 - 580 - 402 - 342 815 2 277 2) Including return from the Swedish Nuclear Waste Fund 291 2 149 1 935 1 127 2 252 394 3) Including interest components related to pension costs - 272 - 444 - 136 - 224 - 871 - 699 4) Including discounting effects attributable to provisions - 1 084 - 1 116 - 547 - 550 - 2 297 - 2 265 5) Items affecting comparability recognised as financial income and expenses, net — 2 — — - 1 - 3 6) The value has been adjusted compared with information previously published in Vattenfall’s financial reports.
- 14. 14 VATTENFALL INTERIM REPORT JANUARY–JUNE 2020 Consolidated statement of comprehensive income Jan-Jun Jan-Jun Apr-Jun Apr-Jun Full year Last 12 Amounts in SEK million 2020 2019 2020 2019 2019 months Profit for the period - 1 594 7 673 - 8 495 1 253 14 861 5 594 Other comprehensive income Items that will be reclassified to profit or loss when specific conditions are met Cash flow hedges - changes in fair value - 467 304 - 811 2 411 181 - 590 Cash flow hedges - dissolved against income statement 3 303 - 2 384 1 611 - 1 277 - 5 641 46 Cash flow hedges - transferred to cost of hedged item - 53 - 25 - 2 - 8 - 34 - 62 Hedging of net investments in foreign operations 220 - 1 436 2 207 - 473 - 1 275 381 Translation differences, divested companies - 4 — - 4 — - 94 - 98 Translation differences - 421 3 126 - 5 434 1 079 2 728 - 819 Income taxes related to items that will be reclassified - 667 1 082 - 959 - 149 2 157 408 Total items that will be reclassified to profit or loss when specific conditions are met 1 911 667 - 3 392 1 583 - 1 978 - 734 Items that will not be reclassified to profit or loss Remeasurement pertaining to defined benefit obligations 733 - 4 105 - 2 157 - 4 105 - 4 577 261 Income taxes related to items that will not be reclassified - 280 1 128 587 1 128 1 244 - 164 Total items that will not be reclassified to profit or loss 453 - 2 977 - 1 570 - 2 977 - 3 333 97 Total other comprehensive income, net after income taxes 2 364 - 2 310 - 4 962 - 1 394 - 5 311 - 637 Total comprehensive income for the period 770 5 363 - 13 456 - 141 9 550 4 957 Attributable to owner of the Parent Company 152 4 032 1 - 13 225 - 552 1 7 757 3 877 Attributable to non-controlling interests 618 1 331 1 - 231 411 1 1 793 1 080 1) The value has been adjusted compared with information previously published in Vattenfall’s financial reports.
- 15. 15 VATTENFALL INTERIM REPORT JANUARY–JUNE 2020 Operating segments, Vattenfall Group Jan-Jun Jan-Jun Apr-Jun Apr-Jun Full year Last 12 Amounts in SEK million 2020 2019 2020 2019 2019 months External net sales Customers & Solutions 43 764 44 745 17 904 18 881 87 343 86 362 Power Generation 16 260 18 076 6 368 6 870 38 425 36 609 Wind 3 552 3 012 491 1 174 6 578 7 118 Heat 7 232 9 157 2 894 3 451 15 947 14 022 Distribution 8 529 9 204 3 558 4 294 17 903 17 228 - of which, Distribution Germany 2 639 3 291 1 206 1 816 6 498 5 846 - of which, Distribution Sweden 5 830 5 856 2 320 2 453 11 288 11 262 Other1 103 49 65 21 164 218 Total 79 440 84 243 31 280 34 691 166 360 161 557 Internal net sales Customers & Solutions 750 1 343 330 520 2 516 1 923 Power Generation 28 151 35 020 11 799 11 747 63 953 57 084 Wind 3 399 3 406 1 728 1 586 6 914 6 907 Heat 4 224 8 409 1 510 3 577 15 456 11 271 Distribution 2 399 2 342 1 226 1 120 4 637 4 694 - of which, Distribution Germany 2 125 2 109 1 058 1 005 4 156 4 172 - of which, Distribution Sweden 290 247 178 119 509 552 Other1 2 747 2 721 1 386 1 396 5 392 5 418 Eliminations - 41 670 - 53 241 - 17 979 - 19 946 - 98 868 - 87 297 Total — — — — — — Total net sales Customers & Solutions 44 514 46 088 18 234 19 401 89 859 88 285 Power Generation 44 411 53 096 18 167 18 617 102 378 93 693 Wind 6 951 6 418 2 219 2 760 13 492 14 025 Heat 11 456 17 566 4 404 7 028 31 403 25 293 Distribution 10 928 11 546 4 784 5 414 22 540 21 922 - of which, Distribution Germany 4 764 5 400 2 264 2 821 10 654 10 018 - of which, Distribution Sweden 6 120 6 103 2 498 2 572 11 797 11 814 Other1 2 850 2 770 1 451 1 417 5 556 5 636 Eliminations - 41 670 - 53 241 - 17 979 - 19 946 - 98 868 - 87 297 Total 79 440 84 243 31 280 34 691 166 360 161 557
- 16. 16 VATTENFALL INTERIM REPORT JANUARY–JUNE 2020 Jan-Jun Jan-Jun Apr-Jun Apr-Jun Full year Last 12 Amounts in SEK million 2020 2019 2020 2019 2019 months Operating profit before depreciation, amortisation and impairment losses (EBITDA) Customers & Solutions 1 784 1 293 551 500 2 976 3 467 Power Generation 11 752 7 671 4 056 3 186 13 642 17 723 Wind 4 780 4 456 1 240 1 719 9 645 9 969 Heat 2 461 2 866 663 477 4 957 4 552 Distribution 4 597 3 856 1 690 1 806 8 236 8 977 - of which, Distribution Germany 1 010 1 003 408 394 2 175 2 182 - of which, Distribution Sweden 3 570 2 827 1 272 1 404 6 018 6 761 Other1 - 157 141 85 - 75 3 097 2 799 Eliminations - 65 - 181 - 34 - 98 - 108 8 Total 25 152 20 102 8 251 7 515 42 445 47 495 Underlying operating profit before depreciation, amortisation and impairment losses Customers & Solutions 1 857 1 313 615 530 3 021 3 565 Power Generation 8 905 10 278 3 364 3 914 19 207 17 834 Wind 4 781 4 459 1 241 1 718 9 620 9 942 Heat 2 492 2 887 677 486 4 409 4 014 Distribution 4 604 3 860 1 694 1 810 8 248 8 992 - of which, Distribution Germany 1 017 1 009 412 398 2 189 2 197 - of which, Distribution Sweden 3 570 2 825 1 272 1 404 6 016 6 761 Other1 - 328 - 257 - 86 - 92 - 457 - 528 Eliminations - 65 - 181 - 34 - 98 - 108 8 Total 22 246 22 359 7 471 8 268 43 940 43 827 Jan-Jun Jan-Jun Apr-Jun Apr-Jun Full year Last 12 Amounts in SEK million 2020 2019 2020 2019 2019 months Operating profit (EBIT) Customers & Solutions 1 320 487 311 81 1 157 1 990 Power Generation 9 729 5 812 3 017 2 253 9 870 13 787 Wind 516 1 848 - 1 630 365 3 603 2 271 Heat - 8 545 1 066 - 9 405 - 453 354 - 9 257 Distribution 2 911 2 258 840 993 4 986 5 639 - of which, Distribution Germany 462 494 133 136 1 118 1 086 - of which, Distribution Sweden 2 449 1 753 706 857 3 858 4 554 Other1 - 579 - 252 - 126 - 272 2 279 1 952 Eliminations - 65 - 181 - 34 - 98 - 108 8 Operating profit (EBIT) 5 287 11 038 - 7 027 2 869 22 141 16 390 Operating profit (EBIT) 5 287 11 038 - 7 027 2 869 22 141 16 390 Financial income and expenses - 2 360 - 687 1 058 - 379 - 3 819 - 5 492 Profit before tax 2 927 10 351 - 5 969 2 490 18 322 10 898 Underlying operating profit Customers & Solutions 1 407 507 389 111 1 337 2 237 Power Generation 6 882 8 419 2 325 2 981 15 437 13 900 Wind 2 002 1 851 - 144 365 4 155 4 306 Heat 589 1 087 - 291 - 443 550 52 Distribution 2 917 2 264 843 997 4 998 5 651 - of which, Distribution Germany 468 501 136 140 1 132 1 099 - of which, Distribution Sweden 2 449 1 752 706 857 3 856 4 553 Other1 - 750 - 652 - 296 - 291 - 1 274 - 1 372 Eliminations - 65 - 181 - 34 - 98 - 108 8 Underlying operating profit 12 982 13 295 2 792 3 622 25 095 24 782 1) “Other” pertains mainly to all Staff functions, including Treasury and Shared Service Centres.
- 17. 17 VATTENFALL INTERIM REPORT JANUARY–JUNE 2020 Consolidated balance sheet 30 Jun 30 Jun 31 Dec Amounts in SEK million 2020 2019 2019 Assets Non-current assets Intangible assets: non-current 18 660 19 027 18 735 Property, plant and equipment 248 387 249 779 256 700 Participations in associated companies and joint arrangements 4 656 5 449 4 827 Other shares and participations 332 343 333 Share in the Swedish Nuclear Waste Fund 46 157 44 839 45 691 Derivative assets 10 315 11 636 7 788 Deferred tax assets 12 468 12 761 14 583 Other non-current receivables 5 599 6 060 5 537 Total non-current assets 346 574 349 894 354 194 Current assets Inventories 13 917 13 471 13 353 Intangible assets: current 147 124 135 Trade receivables and other receivables 24 825 25 656 26 345 Contract assets 273 254 188 Advance payments paid 7 591 3 446 3 996 Derivative assets 9 892 14 084 10 080 Prepaid expenses and accrued income 6 207 7 391 7 853 Current tax assets 703 1 584 1 163 Short-term investments 22 821 17 330 22 551 Cash and cash equivalents 19 813 11 676 10 604 Assets held for sale 320 9 122 318 Total current assets 106 509 104 138 96 586 Total assets 453 083 454 032 450 780 Equity and liabilities Equity Attributable to owner of the Parent Company 90 160 90 128 1 93 631 Attributable to non-controlling interests 13 223 14 687 1 14 891 Total equity 103 383 104 815 108 522 Non-current liabilities Hybrid Capital 20 242 20 272 20 164 Other interest-bearing liabilities 53 873 54 299 52 405 Pension provisions 43 174 44 560 44 026 Other interest-bearing provisions 105 290 95 112 102 395 Derivative liabilities 9 215 10 809 7 833 Deferred tax liabilities 16 262 14 297 14 713 Contract liabilities 8 620 8 163 8 462 Other noninterest-bearing liabilities 2 083 2 265 2 134 Total non-current liabilities 258 759 249 777 252 132 Current liabilities Trade payables and other liabilities 23 468 25 355 27 809 Advance payments received 1 080 5 100 1 577 Derivative liabilities 11 349 20 161 13 701 Accrued expenses and deferred income 9 859 10 873 17 098 Current tax liabilities 1 192 1 723 1 502 Other interest-bearing liabilities 40 653 27 142 25 058 Interest-bearing provisions 3 330 3 871 3 371 Liabilities associated with assets held for sale 10 5 215 10 Total current liabilities 90 941 99 440 90 126 Total equity and liabilities 453 083 454 032 450 780 1) The value has been adjusted compared with information previously published in Vattenfall’s financial reports.
- 18. 18 VATTENFALL INTERIM REPORT JANUARY–JUNE 2020 SUPPLEMENTARY INFORMATION 30 Jun 30 Jun 31 Dec Amounts in SEK million 2020 2019 2019 Calculation of capital employed Intangible assets: current and non-current 18 807 19 151 18 870 Property, plant and equipment 248 387 249 779 256 700 Participations in associated companies and joint arrangements 4 656 5 449 4 827 Deferred and current tax assets 13 171 14 345 15 746 Non-current noninterest-bearing receivables 3 866 3 668 3 758 Contract assets 273 254 188 Inventories 13 917 13 471 13 353 Trade receivables and other receivables 24 825 25 656 26 345 Prepaid expenses and accrued income 6 207 7 391 7 853 Unavailable liquidity 4 260 5 768 3 859 Other 572 654 530 Total assets excl. financial assets 338 941 345 586 352 029 Deferred and current tax liabilities - 17 454 - 16 020 - 16 215 Other noninterest-bearing liabilities - 2 083 - 2 265 - 2 134 Contract liabilities - 8 620 - 8 163 - 8 462 Trade payable and other liabilities - 23 468 - 25 355 - 27 809 Accrued expenses and deferred income - 9 859 - 10 873 - 17 098 Other - 185 - 58 - 186 Total noninterest-bearing liabilities - 61 669 - 62 734 - 71 904 Other interest-bearing provisions not related to adjusted net debt1 - 10 631 - 12 319 - 11 314 Capital employed2 266 641 270 533 268 811 Capital employed, average 268 587 266 463 260 190 Calculation of net debt Hybrid Capital - 20 242 - 20 272 - 20 164 Bond issues and liabilities to credit institutions - 51 914 - 42 604 - 38 829 Short-term debt, commercial papers and repo - 20 225 - 17 023 - 17 453 Present value of liabilities pertaining to acquisitions of Group companies - 28 - 28 - 28 Liabilities to associated companies - 675 - 726 - 733 Liabilities to owners of non-controlling interests - 11 028 - 10 550 - 10 647 Other liabilities - 10 656 - 10 510 - 9 773 Total interest-bearing liabilities - 114 768 - 101 713 - 97 627 Cash and cash equivalents 19 813 11 676 10 604 Short-term investments 22 821 17 330 22 551 Loans to owners of non-controlling interests in foreign Group companies 521 252 206 Net debt2 - 71 613 - 72 455 - 64 266 Calculation of adjusted gross debt and net debt Total interest-bearing liabilities - 114 768 - 101 713 - 97 627 50% of Hybrid Capital3 10 121 10 136 10 082 Present value of pension obligations - 43 174 - 44 560 - 44 026 Provisions for gas and wind operations and other environment-related provisions - 8 789 - 8 121 - 8 571 Provisions for nuclear power (net)4 - 37 917 - 30 219 - 35 521 Margin calls received 4 806 4 212 3 706 Liabilities to owners of non-controlling interests due to consortium agreements 11 028 10 550 10 647 Adjustment related to assets/liabilities held for sale — - 767 — Adjusted gross debt - 178 693 - 160 482 - 161 310 Reported cash and cash equivalents and short-term investments 42 634 29 006 33 155 Unavailable liquidity - 4 260 - 5 768 - 3 859 Adjusted cash and cash equivalents and short-term investments 38 374 23 238 29 296 Adjusted net debt2 - 140 319 - 137 244 - 132 014 1) Includes personnel-related provisions for non-pension purposes, provisions for tax and legal disputes and certain other provisions. 2) See Definitions and calculations of key ratios for definitions of Alternative Performance Measures. 3) 50% of Hybrid Capital is treated as equity by the rating agencies, which thereby reduces adjusted net debt. 4) The calculation is based on Vattenfall’s share of ownership in the respective nuclear power plants, less Vattenfall’s share in the Swedish Nuclear Waste Fund and liabilities to associated companies. Vattenfall has the following ownership interests in the respective plants: Forsmark 66%, Ringhals 70.4%, Brokdorf 20%, Brunsbüttel 66.7%, Krümmel 50% and Stade 33.3%. (According to a special agreement, Vattenfall is responsible for 100% of the provisions for Ringhals.)
- 19. 19 VATTENFALL INTERIM REPORT JANUARY–JUNE 2020 Consolidated statement of cash flows Jan-Jun Jan-Jun Apr-Jun Apr-Jun Full year Last 12 Amounts in SEK million 2020 2019 2020 2019 2019 months Operating activities Operating profit before depreciation, amortisation and impairment losses 25 152 20 102 8 251 7 515 42 445 47 495 Tax paid - 1 352 - 454 - 45 227 - 1 528 - 2 426 Capital gains/losses, net - 175 - 383 - 181 3 - 3 513 - 3 305 Interest received 127 155 58 73 329 301 Interest paid - 2 241 - 2 387 - 976 - 958 - 2 969 - 2 823 Other, incl. non-cash items - 4 855 - 1 188 - 2 687 - 803 185 - 3 482 Funds from operations (FFO) 16 656 15 845 4 420 6 057 34 949 35 760 Changes in inventories - 944 - 654 - 479 - 926 - 196 - 486 Changes in operating receivables - 414 - 2 339 11 764 5 996 - 6 294 - 4 369 Changes in operating liabilities - 7 239 - 3 714 - 7 556 - 2 798 9 171 5 646 Margin calls - 967 - 11 214 7 653 1 077 - 20 733 - 10 486 Other changes 299 196 122 - 321 - 178 - 75 Cash flow from changes in operating assets and operating liabilities - 9 265 - 17 725 11 504 3 028 - 18 230 - 9 770 Cash flow from operating activities 7 391 - 1 880 15 924 9 085 16 719 25 990 Investing activities Acquisitions in Group companies - 67 - 771 - 1 - 7 - 754 - 50 Investments in associated companies and other shares and participations 84 138 127 16 256 202 Other investments in non-current assets - 10 205 - 11 820 - 5 713 - 5 705 - 26 335 - 24 720 Total investments - 10 188 - 12 453 - 5 587 - 5 696 - 26 833 - 24 568 Divestments 620 585 570 16 7 452 7 487 Cash and cash equivalents in acquired companies — 147 — — 148 1 Cash and cash equivalents in divested companies - 83 — - 83 — - 3 542 - 3 625 Cash flow from investing activities - 9 651 - 11 721 - 5 100 - 5 680 - 22 775 - 20 705 Cash flow before financing activities - 2 260 - 13 601 10 824 3 405 - 6 056 5 285 Financing activities Changes in short-term investments - 208 6 108 - 892 - 2 610 559 - 5 757 Changes in loans to owners of non-controlling interests in foreign Group companies - 318 237 13 37 282 - 273 Loans raised1 24 513 12 506 10 280 1 619 12 622 24 629 Amortisation of debt pertaining to acquisitions of Group companies — - 23 — - 23 - 23 — Amortisation of other debt - 7 607 - 7 301 - 4 747 - 234 - 12 001 - 12 307 Effect of early termination of swaps related to financing activities — 221 — - 6 — - 221 Dividends paid to owners - 4 462 - 2 627 - 4 462 - 2 627 - 3 714 - 5 549 Contribution to/from owners of non-controlling interests - 468 - 667 3 - 179 - 1 138 - 939 Cash flow from financing activities 11 450 8 454 195 - 4 023 - 3 413 - 417 Cash flow for the period 9 190 - 5 147 11 019 - 618 - 9 469 4 868 Jan-Jun Jan-Jun Apr-Jun Apr-Jun Full year Last 12 Amounts in SEK million 2020 2019 2020 2019 2019 months Cash and cash equivalents Cash and cash equivalents at start of period 10 604 17 094 8 734 12 233 17 094 11 676 Cash and cash equivalents included in assets held for sale — - 355 236 14 2 992 3 347 Cash flow for the period 9 190 - 5 147 11 019 - 618 - 9 469 4 868 Translation differences 19 84 - 176 47 - 13 - 78 Cash and cash equivalents at end of period 19 813 11 676 19 813 11 676 10 604 19 813
- 20. 20 VATTENFALL INTERIM REPORT JANUARY–JUNE 2020 SUPPLEMENTARY INFORMATION Jan-Jun Jan-Jun Apr-Jun Apr-Jun Full year Last 12 Amounts in SEK million 2020 2019 2020 2019 2019 months Cash flow before financing activities -2,260 - 13 601 10 824 3 405 - 6 056 5 285 Financing activities Effects from terminating swaps related to financing activities — 221 — - 6 — - 221 Dividends paid to owners - 4 462 - 2 627 - 4 462 - 2 627 - 3 714 - 5 549 Contribution to/from owners of non-controlling interests - 468 - 667 3 - 179 - 1 138 - 939 Cash flow after dividend - 7 190 - 16 674 6 365 593 - 10 908 - 1 424 Analysis of change in net debt Net debt at start of period - 64 266 - 47 728 - 81 579 - 72 537 - 47 728 - 72 455 Change accounting principles — - 4 609 — — - 4 609 — Cash flow after dividend - 7 190 - 16 674 6 365 593 - 10 908 - 1 424 Changes as a result of valuation at fair value - 397 - 292 147 - 48 - 456 - 561 Changes in interest-bearing liabilities for leasing - 463 - 435 3 - 340 - 202 3 - 711 - 739 Interest-bearing liabilities/short-term investments acquired/divested 25 — 25 2 - 11 14 Cash and cash equivalents included in assets held for sale — - 355 236 14 2 992 3 347 Interest-bearing liabilities associated with assets held for sale — - 798 - 26 - 6 - 792 6 Translation differences on net debt 678 - 1 564 3 3 559 - 271 - 2 043 199 Net debt at end of period - 71 613 - 72 455 - 71 613 - 72 455 - 64 266 - 71 613 Cash flow from operating activities 7 391 - 1 880 15 924 9 085 16 719 25 990 Maintenance investments - 5 599 - 6 316 - 3 268 - 2 360 - 15 148 - 14 431 Free cash flow2 1 792 - 8 196 12 656 6 725 1 571 11 559 1) Short-term borrowings in which the duration is three months or shorter are reported net. 2) See Definitions and calculations of key ratios for definitions of Alternative Performance Measures. 3) The value has been adjusted compared with information previously published in Vattenfall’s financial reports.
- 21. 21 VATTENFALL INTERIM REPORT JANUARY–JUNE 2020 INVESTMENTS Jan-Jun Jan-Jun Apr-Jun Apr-Jun Full year Last 12 Amounts in SEK million 2020 2019 2020 2019 2019 months Electricity generation Hydro power 365 357 206 190 920 928 Nuclear power 1 026 1 189 557 625 2 213 2 050 Coal power 3 29 3 22 139 113 Gas 156 12 28 1 277 421 Wind power and solar PV 2 342 4 075 1 742 2 594 7 501 5 768 Biomass, waste 96 48 65 - 31 149 197 Total electricity generation 3 988 5 710 2 601 3 401 11 199 9 477 CHP/heat Fossil-based power 670 1 068 476 742 2 134 1 736 Heat networks 522 485 410 346 1 522 1 559 Other 222 373 121 150 760 609 Total CHP/heat 1 414 1 926 1 007 1 238 4 416 3 904 Electricity networks Electricity networks 3 361 2 642 1 854 1 598 7 071 7 790 Total electricity networks 3 361 2 642 1 854 1 598 7 071 7 790 Purchases of shares, shareholder contributions - 17 633 - 126 - 9 498 - 152 Other 794 688 440 371 1 754 1 860 Total investments 9 540 11 599 5 776 6 599 24 938 22 879 Accrued investments, unpaid invoices (-)/ release of accrued investments (+) 648 854 - 189 - 903 1 895 1 689 Total investments with cash flow effect 10 188 12 453 5 587 5 696 26 833 24 568
- 22. 22 VATTENFALL INTERIM REPORT JANUARY–JUNE 2020 Consolidated statement of changes in equity 30 Jun 2020 30 Jun 2019 31 Dec 2019 Amounts in SEK million Attributable to owner of the Parent Company Attributable to non- controlling interests Total equity Attributable to owner of the Parent Company Attributable to non- controlling interests Total equity Attributable to owner of the Parent Company Attributable to non- controlling interests Total equity Balance brought forward 93 631 14 891 108 522 88 096 15 501 103 597 88 096 15 501 103 597 Profit for the period - 2 238 644 - 1 594 6 6481 1 0251 7 673 13 173 1 688 14 861 Cash flow hedges - changes in fair value - 467 — - 467 304 — 304 181 — 181 Cash flow hedges - dissolved against income statement 3 318 - 15 3 303 - 2 368 - 16 - 2 384 - 5 624 - 17 - 5 641 Cash flow hedges - transferred to cost of hedged item - 53 — - 53 - 25 — - 25 - 34 — - 34 Hedging of net investments in foreign operations 220 — 220 - 1 436 — - 1 436 - 1 275 — - 1 275 Translation differences, divested companies - 4 — - 4 — — — - 94 — - 94 Translation differences - 407 - 14 - 421 2 807 319 3 126 2 504 224 2 728 Remeasurement pertaining to defined benefit obligations 733 — 733 - 4 105 — - 4 105 - 4 443 - 134 - 4 577 Income taxes related to other comprehensive income - 950 3 - 947 2 207 3 2 210 3 369 32 3 401 Total other comprehensive income for the period 2 390 - 26 2 364 - 2 616 306 - 2 310 - 5 416 105 - 5 311 Total comprehensive income for the period 152 618 770 4 032 1 331 5 363 7 757 1 793 9 550 Dividends paid to owners - 3 623 - 1 583 - 5 206 - 2 000 - 1 478 - 3 478 - 2 000 - 1 714 - 3 714 Group contributions from(+)/to(-) owners of non-controlling interests — — — — — — — 30 30 Contribution to/from owners of non- controlling interests — - 468 - 468 — - 667 - 667 — - 1 138 - 1 138 Other changes in ownership — - 235 - 235 — — — — 197 197 Other changes — — — — — — - 222 222 — Total transactions with equity holders - 3 623 - 2 286 - 5 909 - 2 000 - 2 145 - 4 145 - 2 222 - 2 403 - 4 625 Balance carried forward 90 160 13 223 103 383 90 128 14 687 104 815 93 631 14 891 108 522 - Of which, Reserve for hedges - 973 11 - 962 - 868 23 - 845 - 3 147 22 - 3 125 1) The value has been adjusted compared with information previously published in Vattenfall’s financial reports
- 23. 23 VATTENFALL INTERIM REPORT JANUARY–JUNE 2020 Key ratios, Vattenfall Group Jan-Jun Jan-Jun Apr-Jun Apr-Jun Full year Last 12 In % unless otherwise stated. (x) means times1 2020 2019 2020 2019 2019 months Operating margin 6.7 13.1 - 22.5 8.3 13.3 10.1 Operating margin2 16.3 15.8 8.9 10.4 15.1 15.3 Pre-tax profit margin 3.7 12.3 - 19.1 7.2 11.0 6.7 Pre-tax profit margin2 13.4 15.0 12.3 9.3 12.8 11.9 Return on equity 4.43 12.03.4 4.43 12.03.4 14.0 4.4 Return on capital employed 6.13 7.13 6.13 7.13 8.5 6.1 Return on capital employed2 9.23 7.53 9.23 7.53 9.6 9.2 EBIT interest cover, (x) 3.23 5.13 3.23 5.13 5.3 3.2 EBIT interest cover, (x)2 4.73 5.43 4.73 5.43 6.0 4.7 FFO interest cover, (x) 7.23 7.73 7.23 7.73 9.3 7.2 FFO interest cover, net (x) 10.93 10.13 10.93 10.13 10.3 10.9 Cash flow interest cover after maintenance investments, (x) 3.33 3.83 3.33 3.83 1.5 3.3 FFO/gross debt 31.23 25.93 31.23 25.93 35.8 31.2 FFO/net debt 49.93 36.43 49.93 36.43 54.4 49.9 FFO/adjusted net debt 25.53 19.23 25.53 19.23 26.5 25.5 EBITDA/net financial items, (x) 16.1 11.7 25.0 7.9 11.2 13.1 EBITDA/net financial items, (x)2 14.2 13.0 22.6 8.6 11.6 12.1 Equity/Total assets 22.8 23.1 22.8 23.1 24.1 22.8 Gross debt/equity 111.0 97.0 111.0 97.0 90.0 111.0 Net debt/equity 69.3 69.1 69.3 69.1 59.2 69.3 Gross debt/gross debt plus equity 52.6 49.2 52.6 49.2 47.4 52.6 Net debt/net debt plus equity 40.9 40.9 40.9 40.9 37.2 40.9 Net debt/EBITDA, (x) 1.53 2.03 1.53 2.03 1.5 1.5 Adjusted net debt/EBITDA, (x) 3.03 3.73 3.03 3.73 3.1 3.0 1) See Definitions and calculations of key ratios for definitions of Alternative Performance Measures. 2) Based on Underlying operating profit. 3) Last 12-month values. 4) The value has been adjusted compared with information previously published in Vattenfall’s financial reports.
- 24. 24 VATTENFALL INTERIM REPORT JANUARY–JUNE 2020 Quarterly information, Vattenfall Group Q2 Q1 Q4 Q3 Q2 Q1 Amounts in SEK million 2020 2020 2019 2019 2019 2019 Income statement Net sales 31 280 48 160 46 179 35 938 34 691 49 552 Operating profit before depreciation, amortisation and impairment losses (EBITDA) 8 251 16 900 8 844 13 499 7 515 12 587 Underlying Operating profit before depreciation, amortisation and impairment losses 7 471 14 773 13 165 8 416 8 268 14 092 Operating profit (EBIT) - 7 027 12 313 2 427 8 677 2 869 8 168 Underlying operating profit 2 792 10 187 8 207 3 594 3 622 9 673 Profit before income taxes - 5 969 8 895 173 7 798 2 490 7 861 Profit for the period - 8 495 6 900 488 6 700 1 253 6 420 - of which, attributable to owner of the Parent Company - 8 826 6 587 151 6 375 935 1 5 713 1 - of which, attributable to non-controlling interests 331 313 337 325 318 1 707 1 Balance sheet Non-current assets 346 574 365 151 354 194 354 122 349 931 343 569 Short-term investments 22 821 22 972 22 551 21 156 17 330 14 555 Cash and cash equivalents 19 813 8 734 10 604 12 773 11 676 12 233 Other current assets 63 875 95 437 63 431 58 339 75 095 84 164 Total assets 453 083 492 294 450 780 446 390 454 032 454 521 Equity 103 383 122 277 108 522 109 461 104 815 108 613 - of which, attributable to owner of the Parent Company 90 160 107 008 93 631 94 385 90 128 1 92 680 1 - of which, attributable to non-controlling interests 13 223 15 269 14 891 15 076 14 687 1 15 933 1 Hybrid Capital 20 242 21 098 20 164 20 622 20 272 20 096 Other interest-bearing liabilities 94 526 92 747 77 463 73 199 81 441 79 513 Pension provisions 43 174 42 660 44 026 48 321 44 560 40 037 Other interest-bearing provisions 108 620 107 183 105 766 98 952 98 983 98 076 Contract liabilities 8 620 8 589 8 462 8 391 8 163 7 819 Deferred tax liabilities 16 262 16 971 14 713 14 406 14 297 14 725 Other noninterest-bearing liabilities 58 256 80 769 71 664 73 038 81 501 85 642 Total equity and liabilities 453 083 492 294 450 780 446 390 454 032 454 521 Capital employed 266 641 287 567 268 811 265 390 270 533 270 536 Net debt - 71 613 - 81 579 - 64 266 - 59 648 - 72 455 - 72 539 Cash flow Funds from operations (FFO) 4 420 12 235 11 520 7 583 6 057 9 789 Cash flow from changes in operating assets and operating liabilities 11 504 - 20 768 - 6 530 6 026 3 028 - 20 754 Cash flow from operating activities 15 924 - 8 533 4 990 13 609 9 085 - 10 965 Cash flow from investing activities - 5 100 - 4 552 - 9 557 - 1 497 - 5 680 - 6 041 Cash flow before financing activities 10 824 - 13 085 - 4 567 12 112 3 405 - 17 006 Changes in short-term investments - 892 684 - 1 913 - 3 636 - 2 610 8 718 Loans raised/Amortisation of debt, net, etc. 5 549 10 572 4 754 - 9 984 1 214 3 759 Dividends paid to owners - 4 462 — - 266 - 822 - 2 627 — Cash flow from financing activities 195 11 256 2 575 - 14 442 - 4 023 12 477 Cash flow for the period 11 019 - 1 829 - 1 992 - 2 330 - 618 - 4 529 Free cash flow 12 656 - 10 865 - 1 171 10 940 6 725 - 14 921 1) The value has been adjusted compared with information previously published in Vattenfall’s financial reports.
- 25. 25 VATTENFALL INTERIM REPORT JANUARY–JUNE 2020 Q2 Q1 Q4 Q3 Q2 Q1 In % unless otherwise stated. (x) means times1 2020 2020 2019 2019 2019 2019 Key ratios Return on equity 4.4 14.4 14.0 16.8 12.04 13.84 Return on capital employed2 6.1 9.4 8.5 9.2 7.1 7.1 Return on capital employed2, 3 9.2 9.2 9.6 8.3 7.5 7.6 EBIT interest cover, (x)2 3.2 4.5 5.3 6.0 5.1 5.1 EBIT interest cover, (x)2, 3 4.7 4.4 6.0 5.4 5.4 5.4 FFO/gross debt2 31.2 32.8 35.8 32.7 25.9 24.4 FFO/net debt2 49.9 45.8 54.4 51.5 36.4 33.5 FFO/adjusted net debt2 25.5 25.2 26.5 24.5 19.2 18.1 Equity/assets ratio 22.8 24.8 24.1 24.5 23.1 23.9 Gross debt/equity 111.0 93.1 90.0 85.7 97.0 91.7 Net debt/equity 69.3 66.7 59.2 54.5 69.1 66.8 Net debt/net debt plus equity 40.9 40.0 37.2 35.3 40.9 40.0 Net debt/EBITDA, (x)2 1.5 1.7 1.5 1.4 2.0 2.0 Adjusted net debt/EBITDA, (x)2 3.0 3.2 3.1 3.0 3.7 3.7 1) See Definitions and calculations of key ratios for definitions of Alternative Performance Measures. 2) Last 12-month values. 3) Based on Underlying operating profit. 4) The value has been adjusted compared with information previously published in Vattenfall’s financial reports.
- 26. 26 VATTENFALL INTERIM REPORT JANUARY–JUNE 2020 NOTE 1 | Accounting policies, risks and uncertainties Accounting policies This interim report for the Group has been prepared in accordance with IAS 34 – “Interim Financial Reporting”, and the Swedish Annual Accounts Act. The accounting policies and calculation methods applied in this interim report are the same as those described in Vattenfall’s 2019 Annual and Sustainability Report in Note 3 to the consolidated accounts, Accounting policies. Amended IFRSs endorsed by the EU for application in the 2020 financial year have no significant effect on Vattenfall’s financial statements. Risks and uncertainties For a description of risks, uncertainties and risk management, please refer to Vattenfall’s 2019 Annual and Sustainability Report, pages 62-71. Apart from the information provided under “Business highlights” in this report and under “Business highlights” in previously published interim reports in 2020, no other material changes have taken place since the publication of the Annual and Sustainability Report. Furthermore, the group assesses that materialized risks following the outbreak of Covid-19 are still in line with Vattenfall’s risk assessments for the Annual and Sustainability Report 2019. However, the probability of further downside events has significantly increased compared to the pre-Covid-19 world Other Significant related-party transactions are described in Note 44 to the consolidated accounts in Vattenfall’s 2019 Annual and Sustainability Report. No material changes have taken place in relations or transactions with related parties compared with the description in Vattenfall’s 2019 Annual and Sustainability Report. In addition to the significant contingent liabilities described in Note 40 to the consolidated accounts in Vattenfall’s 2019 Annual and Sustainability Report, the Nuclear Power plant Kernkraftwerk Krümmel GmbH & Co. OHG, in which Vattenfall has a shareholding of 50%, sold additional production rights during the first half-year 2020 to the co-shareholder PreussenElektra GmbH. Vattenfall’s share of the sales price for the production rights sold in the first half year is SEK 1.6 billion. The price for all production rights sold is subject to a court proceeding initiated by PreussenElektra. Should a lower price be confirmed by the court, a repayment must be made. NOTE 2 | Exchange rates KEY EXCHANGE RATES APPLIED IN THE ACCOUNTS OF THE VATTENFALL GROUP Jan-Jun Jan-Jun Apr-Jun Apr-Jun Full year 2020 2019 2020 2019 2019 Average rate EUR 10.6435 10.4782 10.6768 10.5588 10.5572 DKK 1.4259 1.4036 1.4315 1.4144 1.4140 GBP 12.1951 11.9637 11.9730 12.0557 12.0391 USD 9.6248 9.2469 9.6726 9.3896 9.4180 30 Jun 30 Jun 31 Dec 2020 2019 2019 Balance sheet date rate EUR 10.4948 10.5633 10.4468 DKK 1.4082 1.4153 1.3982 GBP 11.5020 11.7822 12.2788 USD 9.3720 9.2823 9.2993
- 27. 27 VATTENFALL INTERIM REPORT JANUARY–JUNE 2020 NOTE 3 | Financial instruments by measurement category and related effects on income For assets and liabilities with a remaining maturity less than three months (e.g., cash and bank balances, trade receivables and other receivables and trade payables and other payables), fair value is considered to be equal to the carrying amount. For Other shares and participations the fair value is approximated by using cost. The carrying amounts of financial assets do not differ significantly from their fair values. The difference between carrying amounts and fair values for financial liabilities amounts to SEK 6,414 million (31 December 2019: 7,580). Financial instruments that are measured at fair value on the balance sheet are described below according to the fair value hierarchy (levels), which in IFRS 13 is defined as: Level 1: Quoted prices (unadjusted) in active markets for identical assets or liabilities. Level 2: Inputs other than quoted prices included in Level 1 that are observable for the asset or liability, either directly (that is, as prices) or indirectly (that is, derived from prices). In Level 2 Vattenfall reports mainly commodity derivatives, currency-forward contracts and interest rate swaps. Level 3: Inputs for the asset or liability that are not based on observable market data (that is, unobservable inputs). FINANCIAL ASSETS AND LIABILITIES THAT ARE MEASURED AT FAIR VALUE ON THE BALANCE SHEET AT 30 JUNE 2020 Amounts in SEK million Level 1 Level 2 Level 3 Total Assets Share in the Swedish Nuclear Waste Fund 46 157 — — 46 157 Derivative assets — 19 785 422 20 207 Short-term investments, cash equivalents and other shares and participations 16 208 4 098 — 20 306 Total assets 62 365 23 883 422 86 670 Liabilities Derivative liabilities — 20 556 8 20 564 Total liabilities — 20 556 8 20 564 FINANCIAL ASSETS AND LIABILITIES THAT ARE MEASURED AT FAIR VALUE ON THE BALANCE SHEET AT 31 DECEMBER 2019 Amounts in SEK million Level 1 Level 2 Level 3 Total Assets Share in the Swedish Nuclear Waste Fund 45 691 — — 45 691 Derivative assets — 17 490 377 17 867 Short-term investments, cash equivalents and other shares and participations 15 870 8 430 — 24 300 Total assets 61 561 25 920 377 87 858 Liabilities Derivative liabilities — 21 514 20 21 534 Total liabilities — 21 514 20 21 534
- 28. 28 VATTENFALL INTERIM REPORT JANUARY–JUNE 2020 NOTE 4 | Acquired and divested operations Divested operations On 20th of February 2020, Vattenfall signed an agreement to sell its 55% shareholding in the waste incineration plant Müllverwertung Rugenberger Damm GmbH (MVR), to the co-shareholder Stadtreinigung Hamburg, a subsidiary of the City of Hamburg. The transaction received approval from the cartel office and was closed in the beginning of May. The consideration received amounts to SEK 514 million. NOTE 5 | Impairment losses and reversed impairment losses Accounting policy Assessments are made on a regular basis throughout the year for any indication that an asset may have decreased in value. If any such indication is identified, the asset’s recoverable amount is estimated, and an impairment test is performed. For a description of the principles for such calculations, please refer to Note 9 to the consolidated accounts in Vattenfall’s 2019 Annual and Sustainability Report. During 2020 a change has been implemented relating to cash generating units within business area Wind whereby cash generating units now consists of onshore respective offshore wind power plants in the respective countries where Vattenfall operates within the business area. Impairment losses January-June 2020 During the first half of 2020, the process described above resulted in recognition of SEK 10,601 million in impairment losses, which are charged against operating profit. Of this amount, SEK 9,100 million pertains to the Moorburg power plant in business area Heat. The impairment loss is attributable to the combination of low market prices and reduced opportunities for future hard coal condensing operations due to Germany’s phase-out of coal. In the Wind business area, impairment losses of SEK 1,473 million were recognised in units in Sweden and Denmark. The remaining amount pertains to smaller impairment losses on assets held for sale. In addition to the above, deferred tax assets in Germany were written down by SEK 1,227 million as poorer market conditions have led to greater uncertainty as to whether these can be utilised, resulting in a higher tax expense during the period. No previously recognised impairment losses have been reversed in the income statement. NOTE 6 | Effects of COVID-19 Overall effect on operations Fundamentally the impact of the general societal shutdown on Vattenfall’s operations is not significant. Vattenfall has not utilised government support for short-term work and employee furloughs in any market. All plants have continued to deliver according to plan. Expected credit losses In addition to what is described in Note 1 about risks and uncertainties, Vattenfall has increased its provision for expected credit losses on trade receivables, as the assessment is that slightly more customers than previously are expected to encounter payment difficulties. The financial effect on the group amounts to SEK 37 million. For a description of the accounting policy for provisions to loss reserves, see Note 23 to the consolidated accounts in Vattenfall’s 2019 Annual and Sustainability Report. .
- 29. 29 VATTENFALL INTERIM REPORT JANUARY–JUNE 2020 The Parent Company Vattenfall AB Accounting policies The Parent Company Vattenfall AB’s accounts are prepared in accordance with the Swedish Annual Accounts Act and recommendation RFR 2 – Accounting for Legal Entities, issued by the Swedish Financial Reporting Board. The accounting policies used in this interim report are the same as those described in Vattenfall’s 2019 Annual and Sustainability Report, Note 3 to the Parent Company accounts, Accounting policies. New accounting policies applicable from 1 January 2020 has had no significant effect on the Parent Company’s financial statements. January – June 2020 A condensed income statement and balance sheet for the Parent Company are presented below. • Net sales amounted to SEK 25,223 million (25,713). • Profit before appropriations and income taxes was SEK 9,663 million (16,437). • Lower prices on electricity had a negative effect on earnings, unrealized changes in fair value of energy derivatives impacted positively. Dividend received from subsidiaries amounted to SEK 623 million (8,189). Lower financial expenses due to favorable exchange rate effects also impacted earnings positively. • The balance sheet total was SEK 289,145 million (31 December 2019: 282,662). • Investments during the period amounted to SEK 408 million (348), • Cash and cash equivalents, and short-term investments amounted to SEK 38,841 million (31 December 2019: 28,573). • Dividend paid to the owner of SEK 3,623 million (2,000) Presentation of Parent Company income statements See Note 1 to the consolidated accounts, Accounting policies, risks and uncertainties. Risks and uncertainties See Note 1 to the consolidated accounts, Accounting policies, risks and uncertainties. Other Significant related-party transactions are described in Note 44 to the consolidated accounts, Related party disclosures, in Vattenfall’s 2019 Annual and Sustainability Report. No material changes have taken place in relations or transactions with related parties compared with the description in Vattenfall’s 2019 Annual and Sustainability Report.
- 30. 30 VATTENFALL INTERIM REPORT JANUARY–JUNE 2020 Parent Company income statement Jan-Jun Jan-Jun Full year Last 12 Amounts in SEK million 2020 2019 2019 months Net sales 25 223 25 713 49 807 49 317 Cost of purchases - 12 370 - 12 957 - 28 256 - 27 669 Other external expenses - 2 307 - 1 620 - 3 697 - 4 384 Personnel expenses - 1 141 - 1 148 - 2 083 - 2 076 Other operating incomes and expenses, net 150 91 160 219 Operating profit before depreciation, amortisation and impairment losses (EBITDA) 9 555 10 079 15 931 15 407 Depreciation, amortisation and impairments - 291 - 244 - 525 - 572 Operating profit (EBIT) 9 264 9 835 15 406 14 835 Result from participations in subsidiaries 623 8 189 8 226 660 Result from participations in associated companies — — 1 1 Other financial income 1 314 843 1 592 2 063 Other financial expenses - 1 538 - 2 430 - 4 137 - 3 245 Profit before appropriations and income taxes 9 663 16 437 21 088 14 314 Appropriations 223 1 418 498 - 697 Profit before income taxes 9 886 17 855 21 586 13 617 Income taxes - 1 981 - 2 091 - 2 890 - 2 780 Profit for the period 7 905 15 764 18 696 10 837
- 31. 31 VATTENFALL INTERIM REPORT JANUARY–JUNE 2020 Parent Company balance sheet 30 Jun 30 Jun 31 Dec Amounts in SEK million 2020 2019 2019 Assets Non-current assets Intangible assets: non-current 343 188 333 Property, plant and equipment 5 374 4 857 5 273 Shares and participations 161 030 149 879 160 465 Deferred tax assets — 1 175 762 Other non-current receivables 69 080 64 823 66 195 Total non-current assets 235 827 220 922 233 028 Current assets Inventories 412 310 383 Intangible assets: current 28 80 168 Current receivables 13 997 17 668 20 510 Current tax assets 40 — — Short-term investments 21 975 16 481 21 702 Cash and cash equivalents 16 866 11 487 6 871 Total current assets 53 318 46 026 49 634 Total assets 289 145 266 948 282 662 Equity, provisions and liabilities Equity Restricted equity Share capital (131,700,000 shares with a share quota value of SEK 50) 6 585 6 585 6 585 Revaluation reserve 37 989 37 989 37 989 Other reserves 1 458 1 327 1 480 Non-restricted equity Retained earnings 61 574 46 631 46 479 Profit for the period 7 905 15 764 18 696 Total equity 115 511 108 296 111 229 Untaxed reserves 11 375 10 335 11 598 Provisions 5 227 5 273 5 219 Non-current liabilities Hybrid capital 20 244 20 276 20 167 Other interest-bearing liabilities 40 465 43 550 40 494 Deferred tax liabilities 415 — — Other noninterest-bearing liabilities 12 147 11 158 12 148 Total non-current liabilities 73 271 74 984 72 809 Current liabilities Other interest-bearing liabilities 79 793 58 943 70 892 Current tax liabilities 2 776 249 Other noninterest-bearing liabilities 3 966 8 341 10 666 Total current liabilities 83 761 68 060 81 807 Total equity, provisions and liabilities 289 145 266 948 282 662
- 32. 32 VATTENFALL INTERIM REPORT JANUARY–JUNE 2020 Definitions and calculations of key ratios Alternative Performance Measures In order to ensure a fair presentation of the Group’s operations, the Vattenfall Group uses a number of Alternative Performance Measures that are not defined in IFRS or in the Swedish Annual Accounts Act. The Alternative Performance Measures that Vattenfall uses are described below, including their definitions and how they are calculated. The Alternative Performance Measures used are unchanged compared with earlier periods. Definition EBIT: Operating profit (Earnings Before Interest and Tax) EBITDA: Operating profit before depreciation, amortisation and impairment losses (Earnings Before Interest, Tax, Depreciation and Amortisation) Items affecting comparability: Capital gains and capital losses from shares and other non-current assets, impairment losses and reversed impairment losses and other material items that are of an infrequent nature. Also included here are, for trading activities, unrealised changes in the fair value of energy derivatives, which according to IFRS 9 cannot be recognised using hedge accounting and unrealised changes in the fair value of inventories. See Consolidated income statement for a specification of items affecting comparability. Underlying EBITDA: Underlying operating profit before depreciation, amortisation and impairment losses. This measure is intended to provide a better view on the operating result by excluding items affecting comparability that are of an infrequent nature, while also excluding non-cash depreciation and amortisation. Underlying operating profit: Operating profit (EBIT) excluding items affecting comparability. This measure is intended to provide a better view on the operating result by excluding items affecting comparability that are of an infrequent nature. FFO: Funds From Operations, see Consolidated statement of cash flow Free cash flow: Cash flow from operating activities less maintenance investments Interest-bearing liabilities See Consolidated balance sheet - Supplementary Information Net debt: See Consolidated balance sheet - Supplementary Information Adjusted net debt: See Consolidated balance sheet - Supplementary Information Capital employed: Total assets less financial assets, noninterest-bearing liabilities and certain other interest-bearing provisions not included in adjusted net debt. see Consolidated balance sheet - Supplementary Information Other definitions Definition Hybrid Capital: Perpetual subordinated securities, junior to all Vattenfall’s unsubordinated debt instruments. LTIF: Lost Time Injury Frequency (LTIF) is expressed in terms of the number of lost time work injuries (per 1 million hours worked), i.e., work-related accidents resulting in absence longer than one day, and accidents resulting in fatality. CALCULATION OF EBITDA, UNDERLYING EBITDA AND UNDERLYING EBIT Jan-Jun Jan-Jun Apr-Jun Apr-Jun Full year Last 12 Amounts in SEK million 2020 2019 2020 2019 2019 months Operating profit (EBIT) 5 287 11 038 - 7 027 2 869 22 141 16 390 Depreciation, amortisation and impairment losses - 19 865 - 9 064 - 15 278 - 4 646 - 20 304 - 31 105 Operating profit before depreciation, amortisation and impairment losses (EBITDA) 25 152 20 102 8 251 7 515 42 445 47 495 Items affecting comparability excl. impairment losses and reversed impairment losses - 2 906 2 257 - 780 753 1 495 - 3 668 Underlying operating profit before depreciation, amortisation and impairment losses 22 246 22 359 7 471 8 268 43 940 43 827 Operating profit (EBIT) 5 287 11 038 - 7 027 2 869 22 141 16 390 Items affecting comparability 7 695 2 257 9 819 753 2 954 8 392 Underlying operating profit 12 982 13 295 2 792 3 622 25 095 24 782
- 33. 33 VATTENFALL INTERIM REPORT JANUARY–JUNE 2020 The key ratios are presented as percentages (%) or times (x). KEY RATIOS BASED ON CONTINUING OPERATIONS AND LAST 12-MONTH VALUES JULY 2019 – JUNE 2020 Operating margin, % = 100 x EBIT 16 390 = 10.1 Net sales 161 557 Operating margin excl. items = 100 x Underlying EBIT 24 782 = 15.3 affecting comparability, % Net sales 161 557 Pre-tax profit margin, % = 100 x Profit before income taxes 10 898 = 6.7 Net sales 161 557 Pre-tax profit margin excl. items = 100 x Profit before income taxes excl. items affecting comparability 19 293 = 11.9 affecting comparability, % Net sales 161 557 Return on equity, % = 100 x Profit for the period attributable to owner of the Parent Company 4 287 = 4.4 Average equity for the period attributable to owner of the 97 917 Parent Company excl. the Reserve for cash flow hedges Return on capital employed, % = 100 x EBIT 16 390 = 6.1 Capital employed, average 268 587 Return on capital employed excl. = 100 x Underlying EBIT 24 782 = 9.2 items affecting comparability, % Capital employed, average 268 587 EBIT + financial income excl. return from the Swedish Nuclear EBIT interest cover, (x) = Waste Fund 18 546 = 3.2 Financial expenses excl. discounting effects attributable to 5 777 provisions Underlying EBIT + financial income excl. Return EBIT interest cover excl. Items = from the Swedish Nuclear Waste Fund 26 938 = 4.7 affecting comparability, (x) Financial expenses excl. discounting effects attributable to 5 777 provisions FFO + financial expenses excl. FFO interest cover, (x) = discounting effects attributable to provisions 41 537 = 7.2 Financial expenses excl. discounting effects attributable to 5 777 provisions FFO + financial items net excl. discounting effects attributable FFO interest cover, net, (x) = to provisions and return from the Swedish Nuclear Waste Fund 39 381 = 10.9 Financial items net excl. discounting effects attributable to 3 621 provisions and return from the Swedish Nuclear Waste Fund
- 34. 34 VATTENFALL INTERIM REPORT JANUARY–JUNE 2020 Cash flow from operating activities less maintenance investments + financial expenses excl. Discounting Cash flow interest cover after = effects attributable to provisions and interest components related to pension costs 16 637 = 3.3maintenance investments, (x) Financial expenses excl. discounting effects attributable to 5 078 provisions and interest components related to pension costs FFO/gross debt, % = 100 x FFO 35 760 = 31.2 Interest-bearing liabilities 114 768 FFO/net debt, % = 100 x FFO 35 760 = 49.9 Net debt 71 613 FFO/adjusted net debt, % = 100 x FFO 35 760 = 25.5 Adjusted net debt 140 319 EBITDA/net financial = EBITDA 47 495 = 13.1 items, (x) Financial items net excl. discounting effects attributable to 3 621 provisions and return from the Swedish Nuclear Waste Fund EBITDA excl. items affecting = EBITDA excl. items affecting comparability 43 827 = 12.1 comparability/net financial Financial items net excl. discounting effects attributable to 3 621 items, (x) provisions and return from the Swedish Nuclear Waste Fund KEY RATIOS BASED ON THE BALANCE SHEET PER 30 JUNE 2020 Equity/total assets, % = 100 x Equity 103 383 = 22.8 Balance sheet total 453 083 Gross debt/equity, % = 100 x Interest-bearing liabilities 114 768 = 111.0 Equity 103 383 Net debt/equity, % = 100 x Net debt 71 613 = 69.3 Equity 103 383 Gross debt/gross debt = 100 x Interest-bearing liabilities 114 768 = 52.6 equity, % Interest-bearing liabilities + equity 218 151 Net debt/net debt plus = 100 x Net debt 71 613 = 40.9 equity, % Net debt + equity 174 996 Net debt/EBITDA, (x) = Net debt 71 613 = 1.5 EBITDA 47 495 Adjusted net debt/ = Adjusted net debt 140 319 = 3.0 EBITDA, (x) EBITDA 47 495
- 35. 35 VATTENFALL INTERIM REPORT JANUARY–JUNE 2020 This is information is such that Vattenfall AB is obliged to make public in accordance with the EU Market Abuse Regulation and the Swedish Securities Markets Act. The information was submitted for publication, through the agency of the contact persons set out above, at 08.00 CEST on 21 July 2020. This report has been prepared in both Swedish and English versions. In the event of discrepancies between the two versions, the Swedish version shall govern. Interim report signature The Board of Directors and the President certify that this half-year interim report presents a true and fair overview of the Vattenfall Group’s and the Parent Company Vattenfall AB’s operations, financial position and results of operations, and describes the significant risks and uncertainties facing the Parent Company and the companies belonging to the Group. Solna, 21 July 2020 Financial calendar Interim report January-September, 27 October 2020 Year-end report 2020, 4 February 2021 Lars G. Nordström Chairman of the Board Mats Granryd Ann Carlsson Tomas Kåberger Robert Lönnqvist Jeanette Regin Åsa Söderström Winberg Magnus Hall President and CEO Viktoria Bergman Håkan Erixon Jenny Lahrin Rolf Ohlsson Fredrik Rystedt Contact information Vattenfall AB (publ) 169 92 Stockholm Corporate identity number 556036-2138 T +46 8-739 50 00 www.vattenfall.com www.vattenfall.se Magnus Hall President and CEO T +46 8-739 50 09 Anna Borg CFO T +46 8-739 64 28 Johan Sahlqvist Head of Investor Relations T +46 8-739 72 51 Vattenfall’s press office T +46 8-739 50 10 press@vattenfall.com
- 36. 36 VATTENFALL INTERIM REPORT JANUARY–JUNE 2020 Review report Introduction We have reviewed the condensed interim report for Vattenfall AB (publ) as at 30 June 2020 and for the six month period then ended. The Board of Directors and the CEO are responsible for the preparation and presentation of this interim report in accordance with IAS 34 and the Swedish Annual Accounts Act. Our responsibility is to express a conclusion on this interim report based on our review. Scope of review We conducted our review in accordance with the International Standard on Review Engagements, ISRE 2410 Review of Interim Financial Statements Performed by the Independent Auditor of the Entity. A review consists of making inquiries, primarily of persons responsible for financial and accounting matters, and applying analytical and other review procedures. A review is substantially less in scope than an audit conducted in accordance with International Standards on Auditing and other generally accepted auditing standards in Sweden. The procedures performed in a review do not enable us to obtain assurance that we would become aware of all significant matters that might be identified in an audit. Accordingly, we do not express an audit opinion. Conclusion Based on our review, nothing has come to our attention that causes us to believe that the interim report is not prepared, in all material aspects, in accordance with IAS 34 and the Swedish Annual Accounts Act regarding the Group, and in accordance with the Swedish Annual Accounts Act regarding the Parent Company. Stockholm, 20 July 2020 Ernst & Young AB Staffan Landén Authorised Public Accountant