The document provides information on calculating various financial ratios from a company's financial statements. It includes the formulas and calculations for ratios such as: gross profit ratio, net profit ratio, return on capital employed ratio, return on equity ratio, debt-to-equity ratio, current ratio, and inventory turnover ratio. It also defines key terms needed to compute the ratios, such as determining current assets, current liabilities, equity, assets, gross profit, net profit, and capital employed.
1. hapter: Sin
Financial Statement Analysis
6/2
Total asets tumover Net Sale
Avemge Total Asse
Significance:
ratio measures the efliciency with which a comnpany
u
uses its asscts to generate
the
sales
assets of t
total assets turnover, the larger will be the incone on cach dollar invested in the as r
The
business.
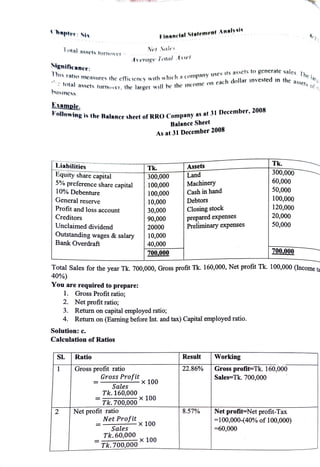
Example.
Follo
' s the Balance sheet ofRROCompany as at 31 December, 2008
Balance Sheet
As at 31 December 2008
Liabilities
Equity share capital
5% preference share capital
10% Debenture
Tk.
300,000
60,000
50,000
100,000
Assets
Tk
300,000
100,000
100,000
10,000
Land
Machinery
Cash in hand
General reserve Debtors
Closing stock
prepared expenses
Preliminary expenses
120,000
20,000
50,000
Profit and loss account 30,000
90,000
Creditors
Unclaimed dividend 20000
Outstanding wages &salary
Bank Overdraft
10,000
40,000
700.000 700.000
Total Sales for the year Tk. 700,000, Gross profit Tk. 160,000, Net profit Tk. 100,000 (ncome ta
40%)
You are required to prepare:
1. Gross Profitratio
2. Net profit ratio;
3. Return on capital employed ratio,
4. Return on (Earning before Int. and tax) Capital employed ratio.
Solution:c.
Calculation of Ratios
SI. Ratio Result Working
Gross profit ratio
Gross Profit
22.86%Gross profit=Tk. 160,000
Sales=Tk. 700,000
x 100
Sales
Tk.160,000
Tk.700,000
x 100
Net profit-Net profit-Tax
-100,000-(40% of 100,000)
=60,000
Net profit ratio 8.57%
Net Profit 10
x 100
Sales
Tk.60,000
x 100
Tk. 700,000
2. hapter: Sin Financinl Statement Analysis 6/23
Retum on Capitalemploycd ratio 12.29%Interest-interest of Debenture
Net profit after tax + interest
3
-
10% of 100,000
Capital employed 10,000
Capital employed=Total Asscts
Current liabilities-Fictitious Asscts
x 100
Tk.60,000 + Tk.10,000
x 100
Tk.490,000 =700,000-160,000-50,000
=4,90,000
Or, Capital employed=Total
liabilities-Current liabilities-|
Fictitious Assets
=700,000-160,000-50,000-490,000
Or, Capital employed=Share
capital+reserve&surplus-Long term
Liabilities-Factitious assets
=(300,000+100,000+(10,000+30,00
0) +100,000-50,000
=Tk. 490,000
Return on Earning before interest | 20.41% Net Profit before interest and tax
and Tax capital employed ratio=
Net profit before interest& tax
Capital employed
=Tk. 10,000
x 100
Tk.100,000
100
Tk.490,000
Activity Gama Company
Balance sheet
December 31, 2012
Assets
Current assets
Tk.10000000
1500000
2500000
Plant assets
Total assets
Liabilities and stock holders
Equity Tk.1000000
750000
Current liabilities
Long term liabilities
Total liabilities
Share holders equity
Total liabilities and stock holder equity
1750000
750000
2500000
Income statement data appear below:
Net sales
Tk. 3750000
40000
Interest expenses
The following account balances existed at December 31,
225000
2011 Tk. 2000000
Total assets 650000
Stockholdersequity
3. 6/24
Chapter: Six Financial Statement Analysis
The tax rate is 35 percent, industry norms as of December,
***
Industry
31 20122 are
standards
1.75
Debt/ equity ratio
Profit margin .12
0.15
Return on total assets 0.30
Return on stock holders equity 1.71
Total asset turnover
yanuate the following ratios for Gama Company as of December 31, 2012:
() Debt/equity ratio,
(i) Profit margin
ii) Return on total assets;
iv) Return on stock holders' equity
(v) Total asset turnover.
Classification ofRatio on the basis of Objective:
Ratio to Test Liquidity or Short Term Solvency: - Standard Rato
1CurrentRatio 2:1
1:1
2 | Liquid Ratio
1:1
WorkingCapitalRatio 8 Times
4 Inventory turnover ratio
4-6 Times
Accounts Receivable Turnover Ratio
4-6 Times
Accounts Payable Turnover Ratio
Cash to CurrentLiabilityRatio (Cash/CL) 0.25:1
2. Ratio to Test Capital Structure or Long TermSolvency:
Debt
Debt Bquity Ratio
2 Equity AssetsRatio
0.33:1
0.75:1
0.25:1
Liabilities Assets Ratio
Interest CoverageRatio
5 FixedAssets &Equity Ratio
6Capital Gearing Ratio 0.5:1
3. Ratio to Test Profitability:
20%-30%
Gross ProfitRatio
2 Net Profit Before Tax Ratio
3 Net ProfitAfterTaxRatio
Return on CapitalEmployed
Return before interest & Tax on Capital Employed
(10%-15%)
(5%-10%)
| (10%-15%6
(15%-20%)
|6 OperatingProf+it Ratio (OP/S)
Formula of Calculating Ratio:
SI. NameofRatio Formula of Ratio
Current Assets
CurrentLiabilities
Liquid Assets
Current ratio
22 Quick ratio
Current Liabilities
4. Chapter: Six
Financial Statement Analysis 6/25
3 Stock/Inventory Turnover ratio Cost of Goods Sold
Average Stock
GrossProfit
Net Sales
Net Profitafter Tax 10
Capital Employed
Net Credit Sales
4 Gross profit ratio
x 100
5 Return on capital employed )x 10
Accounts receivable turnover ratio
Average Receivable
Net Profit
Net profit ratio
x 100
Net Sales
External Liabilities
Debt equity ratio
Owner's Equity
Credit Purchase
9 Accounts payable turnover ratio
Average Payable
Sales
10 Capital turnover ratio
Capital Employed
Net Profit after Tax
11 Net profit ratio
x 100
Net Sales
Net Profit after Tax + Interest
Capital Employed
Credit Sales
12 Return on capital employed
x 100
13 Debtors turnover ratio
Average Debtors & B/R
Owner'sEquity
14 Owner's equity ratio
Fictitious Assets
Total Assets_
Owner's Equity
15 Equity-Asset ratio
Total Assets
External Liabilities
16 Liability -Assetratio
Total Assets
Necessary computation to calculate ratio:
1. Current Assets =
Cash in hand +Cash at Bank + Accounts Receivable +Bill Receivable +
Accrued Income +Short Term Investment + +Prepaid Expenses
Inventory
2. Current Liabilities =
Bank Overdraft + Accounts payable + Bill Payable +
Due/Outstanding
Expenses+Short Term Loan + Dividend Declared + Income Tax
3. Quick or Liquid Assets =
Current Assets-(Closing Inventory +
Prepaid Expenses)
4. Quick or Liquid Liabilities =
Current Liabilities
5. Working Capital =
Current Assets -
Current Liabilities
6. Internal Liabilities or Equity Fund =
Share Capital + Reserve & Surplus +Dividend declared
+Unclaimed Dividend - Fictitious Assets
7. External Liabilities =
Long Term Liabilities + Current Assets +
(Dividend Declared +
Unclaimed Dividend) - Fictitious Assets.
8. Gross Profit =
Net Sales Cost ofGoods Sold or Sales x %
9. Cost ofGoods Sold =
Sales- Gross profit or
(Opening Stock + Net Purchase + Direct Expenses
- Closing Stock)
10.
Operating Profit =
Gross Profit -
Operating Expenses
1. Net Profit Before Tax =
Gross Profit -
Operating Expenses Interest or, (Operating Profit-
Interest)
5. 6/26
Financial Statement Analysis
- - * * * * * *
Income 1ax or, N
Chapter: Six Intcrest
Operating Expenses
12. Net Profit after Tax -
Gross Profit
13. Capital Employed= Total Asscts (Less Fictitious Assets)
Current Liabilities
Or. Fixed Assets +Current Assets -
Current Liabilities
Or,Fixed Assets
Or. Share Capital + Reserve & Surphus + Long Term Debt -
Fictitious Asset
Or. Equity Fund + Long Term Liability
Profit Before Tax Inconme Tax
Working Capital
Check list for Ratio:
Measure of:
Broad Basic Computation
Ratios
Category
Liquidityand CashRatio
Eficiency
Adequacy of available
cash
Short-term debt paying
Cash plus cash equivalents
Current liabilities
Current assets
Current Ratio
ability
Immediate short-term
debtpaying ability
Eficiency
Current Liabilities
Quick assets
Quick Ratio
Current liabilities
Net sales of
Accounts
collection
Receivable Average accounts receivable
Turnover
Days
Uncollected
Days in year Liquidity of
Sales
receivables
Receivable turnover
Cost ofgoods sold Efficiency OT
Inventory Turnover
inventory
Average
inventory
Days in year Liquidity of inventory
Days
Inventory
Sales In
Inventoryturnover
Net sales Eficiency of assets in
generating revenues
Total Assets
Average Total assets
Total liabilities
Turnover
Debt financing (by
creditor) i.e. leverage
Equity financing (by
Solvency Debt Ratio*
Total Assets
Total equityy
Equity Ratio*
owner)
Total assets
Book value ofpledged assets Protection to secured
Pledged assets to
secured liabilities creditors
Book valueofsecuredliabilities
Income before interest and Ability to meet interest
payments (From the
viewofprofit)
Times interest
incometaxes
Interest expense
earned
Cash coverage Cash flows from operatingactivities Ability to meet interest
before interestandtaxes
Interest paid
payments (from the
view ofcash flows)
Ability to generate net
Profitability Profit margin ratio Net income
Net sales
Gross margin
income
Gross margin ratio
Net Sales
Net income -
preferred dividends
Ability to generate
gross margin
Overall profitability of
ROE
Average owners equity assets
ROA Net income
Return on Owner's
Average total assets investment
Financial Leverage|=|ROE-ROOA Eficiency of financial
6. Chapter: Six
Financial Statement Analvsis 6/27
percentage
leverage
Farnings per share Net income Preferred dividends Net ncome on each
Average no. of shares outstanding equity or common
ahares
Rook value per Owners' equity appicable Rook valhue of each
share to commonshares
No. of common shares outstanding
Cash flows from operating
equity share
Quality of income The of
extent
activities company's
by
earnings
Net income generated its
operation
Fixed assets Net sales Revenue generating
turnover
Average net fixed assets capacity by fixed
assets
Market Price canings rati0 Market price per common share Market value relative
to earninggs
EPS
Annual dividends per share
Dividend yicld ratio Cash return to each
common share
Market pricepershare
Sometimes, analyst use debt-equity ratio instead ofcalculating debt and equity ratio separately
The computation is as follows:
Debt-cquity ratio = Total debts/ Total equity capital
6.08 Summary of ratio's
| Profitability Formula
Gross profit
Sales
Gross profit: Revenue
Netprofit aftertax
Sales
Net profit after tax: Revenue
Profit beforeinterestandtax
Total assets-Current liabilities
Return on capital employed
Profit beforetax
Share capital + Reserves
Net profitaftertax
Non-current assets + Working capital
Return on share capital
Net profit after tax: Total assets
Solvency and efficiency ratio
Current ratio
Formula
Current assets
Current liabilities
Current assets-Inventory
Current liabilities
Acid test ratio
Revenue
Total assets-Current liabilities
Asset turnover
7. Chapter: Six Financial Statement Analysis
6/28
- - - -
lnventory turnover -**.
Cost of goodssold
Average inventory
Accounts receivable
Revenue
Accounts receivable days
365
Accounts payable days Accounts payabiex 365
Purchases
Shareholder ratios
Dividend yield
| Formula
Gross dividend pershare
Market price per share
Net profitaftertax-Dividend of prefshare
-
Earnings per share noof ordinary shares
Market price
Earnings per share
Price/earnings ratio
Capital structure Formula
Shareholder's funds
Total assets
Net worth: Total assets
Fixed assets
Shareholder's funds
Non-current assets: Networth
Non-current assets: Net worth + Fixed assets
Shareholder's funds +Long-term liabilities
Total liabilities
Total assets
long-term liabilities
Debt ratio
Prior chargecapital
Total capital
Prior chargecapital
Ordinary share capital and reserves
Total borrowing
Shareholder's funds
Capital gearing ratio
Debt: Equityratio
Borrowing: Net worth
Profit beforeinterestandtax
Interest charges
Interest cover
6.09 SuperTipsofthisChapter
Important Information to Answer the Creative Question:
1. Determinationtheamountof CurrentAssets:
Current Asset All assets under the heading of 'current assets' and loan and advance
expenses'in the assetsideofstatementoffinancial position.
Example
SI Taka
Particulars
Cash inhand
Bank balance/deposit
Stockgoods
Notes receivables
Accounts receivable
Shorttermloan
***
**
***
***
4
8. 6/29
Chapter: Six Pinancial Statement Analysis
- - - -
7 AdvanceExpense
Income reccivable/outstanding incomc
Total current assets
2. Determinationof Current Liability:
Current Liability = All liabilities under the head of 'current liabilities and other
provisions intheliabilitysideofstatementoffinancial position.
Example:
SIParticulars
Accounts payable
Notes payable
Bank overdraft
Shortterm loan
Outstanding expenses
Advance Income/Unearned revenue
Proposed dividend
Provision for incometax
Jnclaimed dividend
Taka
***
***
***
***
***
***
Total currentliabilities
*****
3. DeterminationofLiquid Asset:
Total LiquidAsset =
TotalCurrent Asset -ClosingStock-AdvanceExpenses
Example:
Particulars
|Total CurentAsset
(-)Closing Stock
() Advance Expenses
Total AmountofLiquid Asset
Taka
**
***
***
4. DeterminationofOwner'sEquity/Fund:
Owner's Equity = Share Capital + Reserve and Surplus - Expense not written off
(unadjusted
5. DeterminationofExternalLiability:
External Liability CurrentLiabilitiesandotherProvisions +Longterm Loans.
Example:
Particulars
Current Liabilities
(+) 10% Loan
20% Mortgage Loan etc.
External Liability
Taka
***
***
****
**
6. Determinationof TotalAssets:
Total Asset = Total of Asset side of Statement of Financial Position - Expenses not|
written offi(unadjusted
Example:
Particulars
Total Assets
Preliminary Expense
Taka
**
***
9. Chapter: Six
Financial Statement Analysis
Differed Advertisement
Underwriter's commission
Premium ofshare / dcbentur: ctc._
Amount of TotalAsset
***
***
7. Determinationof GrossProfit/Profit:
Gross Profit =
NetSales -
Cost ofGoodsSold
or, Gross Profit Sales x Percentage of Gross Profit (If the percentage/rate of profiton
sales is given)
or, Gross profit =
Cost of Goods Sold x Rate of Gross Profit (If rate of Gross Profit on
cost ofgoodssoldisgiven)
8. DeterminationofNetProfit:
Net Profit Gross Profit -
Operating Expense + Non-Operating
lncome- Non
Operating Expense
Example:
Particulars
Gross Profit
Taka
***
Operating Expenses ***
***
(+) Non-operatingIncome ***
***
( Non-operatingExpenses
AmountofNetProfit
9. Determinationof CostofGoodsSold:
Cost ofGoodsSold=NetSales-GrossProfit
Or, CostofGoodsSold =
OpeningStock+CostofPurchasedGoods-ClosingStock
Example:
Particulars
Net Sales
Taka
***
***
() Gross Profit
Cost ofGoodsSold
***
Or,
Particulars
Opening Stock
(+) NetPurchase
+) Wages
(+) CarryingCosts etc.
Closing Stock
Cost ofGoodsSold
Taka|
***
***
*** |
***
***)
***
10.DeterminationofInvested Capital:
Invested Capital =
Equity Fund + Long Term Loan
Or, Invested Capital =
Total Asset-Current Liability
Example:
Particulars
Equity Fund
(+) Long term Loan
Amount ofInvestedCapital
Taka
**
***
10. Chapter: Six
Financial Statement Analysis 6/31
- a - - - ~
Or,
Particulars
Net Asscts (Total Asset -
Expense not written off)
(-)CurrentLiability
Cost ofGoodsSold
Taka
**
11. Determinationof AverageStock:
Average Stock =PenngStock +ClosingStock
Example:
Value of opening stock Tk. 52,000 and Closing Stock TK. 44,000.
52000+44000
Average Stock =
Tk. 48,00o
12. Determinationof Working / Current Capital:
Working/ CurrentCapital =
CurrentAsset-CurrentLiability
Example:
Particulars Taka
Total Current Asset ***
(Total CurrentLiability
Amount ofworkingcapital:
13.Determination of FixedCost Fund:
Fixed Cost Fund =
PreferredShare Capital+Long Term Loan
***
Example:
Particulars
Preferred Share Capital
(+) 10% Debenture
Amount ofFixed CostFund:
Taka
***
***
14.DeterminationofNetProfitbeforeTaxandInterest:
Net Profit before Tax and Interest= Net Profit afterDeducting Tax + Interest Expense
(Interest ofLoan)+IncomeTaxExpense
Example:
Particulars
Net Profit after Deducting Tax
(+) 10% Debenture
(+) Income Tax Expense
Amountof NetProfitbeforeTaxandInterest:
Taka |
***
***