SlideShare ist ein Scribd-Unternehmen logo
1 von 23
Downloaden Sie, um offline zu lesen
Currently there appears to be four headwinds facing equities: firm oil prices, mighty dollar, rising
pressure on prices and wages in developed economies, and The Donald. We also can add the fact that
equities globally have been in an uptrend for nine years: a long cycle. On the positive side, real rates are
negative in most developed economies and valuations are more reasonable following the recent
correction, but still not ‘that cheap’.
Vietnamese equities are still pricey. The market is supported by rising RoE (19% in 2018F versus 15% in
2017) and high Ebitda margins (26%). Will it be enough? P/E’s have expanded for the past seven years.
We expect a period of consolidation for the VN Index in 3Q. Our target range is 900 to 1000 with a
preference for a re-test of 900. A break below 900 would take the Index to around 840, the lower bound
of the upward channel in place for the past two years. It is possible that the market tries to break the
1027-40 level but that would only be possible in a risk-on environment. Overall, we remain bearish on
the VN Index for the next few months. There will be better buying opportunities as this time-correction
fazes out.
PE movement of the VNIndex during 2015 - now
Strategy Board
Bernard Lapointe – Head of Research
bernard.lapointe@vdsc.com.vn
Lam Nguyen
lam.ntp@vdsc.com.vn
Hieu Nguyen
hieu.nd@vdsc.com.vn
Quang Vo
quang.vv@vdsc.com.vn
SonTran
son.tt@vdsc.com.vn
Tu Vu
tu.va@vdsc.com.vn
Ha Tran
ha.ttn@vdsc.com.vn
Please see penultimate page for
additional important disclosure
10
12
14
16
18
20
22
24
01/2015
03/2015
05/2015
07/2015
09/2015
11/2015
01/2016
03/2016
05/2016
07/2016
09/2016
11/2016
01/2017
03/2017
05/2017
07/2017
09/2017
11/2017
01/2018
03/2018
05/2018
PE_RATIO P/E average 3 years
05/07/2018
Investment Strategy July 2018
STOCK PICKING
Rong Viet Securities Corporation – Investment Strategy Report July 2018 2
CONTENTS
VIETNAM MACRO ...................................................................................................................................................................................................................................3
 Highest GDP growth for the first six months since 2011 ...........................................................................................................................3
 FDI flow into manufacturing sector slow down............................................................................................................................................6
 Monetary policy adjusting to market movements.......................................................................................................................................7
VIETNAM’S STOCK MARKET IN JUNE: ANOTHER GLOOMY MONTH ...................................................................................................................................8
QUARTER 3 STOCK MARKET OUTLOOK .......................................................................................................................................................................................11
INVESTMENT STRATEGY AND IDEAS: STOCK PICKING...........................................................................................................................................................16
Despite rising external risks caused in part by the US – China trade war, Vietnam’s economy showed its best performance since 2011 in the
first six months of 2018.
In the stock market, VNIndex’s PE decreased to around 16x, equivalent to that of mid-2017 after more than three consecutive months of a
deep price correction. Meanwhile, the market’s NPAT growth was 24% YoY in Q1 2018, implying a less-than-1 PEG ratio.
However, Vietnam’s stock market still faces more risks from external factors (FED rates hike, trade war, Renminbi depreciation) which can
put more pressure on a potential devaluation of the Dong and outflows of “fast money” (from hedge funds).
Although we believe that the SBV’s resources are strong enough to control FX fluctuations within its target range, we think monetary policy
will be tighter in the second half of 2018, implying less liquidity for risky sectors like the stock market and real estate.
For these reasons, along with oncoming business earnings results, we think that good buying opportunities will occur while the market
drops a bit more. However, an uptrend trend will not come within all stocks/sectors. Smart money will carefully choose companies with
good business results and not be invested across the board. For this month, we would like to introduce our two picks, NLG and FPT.
Finally, Rong Viet’s Research Department unveils its portfolio made up of Vietnamese stocks under coverage. This is a long-only
absolutereturn portfolio. See page 17 of this report.
HIGHLIGHT STOCKS.............................................................................................................................................................................................................................18
Analysis of 54 stocks of RongViet Research, discussion with companies and specific evaluation in the “Company Report” or “Analyst
Pinboard”
Rong Viet Securities Corporation – Investment Strategy Report July 2018 3
VIETNAM MACRO
• Highest GDP growth in the first six months of the year since 2011
• Foreign direct investment in the manufacturing sector slowed down
• Tighter monetary policy
Highest GDP growth for the first six months since 2011
According to GSO’s newly published data, Vietnam’s economy grew at an annual pace of 6.8% in
the second quarter. In 1H2018, GDP growth reached 7.1%, a level not seen since 2011. The
agriculture, forestry and fishery sectors recovered and rose by 3.9% YoY while the growth rate of
the manufacturing/ construction and service sectors was 9.1% YoY and 7.0% YoY, respectively.
Three highlights:
• Agriculture, forestry and fishery, a buffer for the economy, has been strongly recovering
as export turnover rose. Exports to China picked up substantially (+ 36% y/y in 2017) as
the negative impact of environmental problems faded out.
• The manufacturing sector is at a turning point as Vietnamese conglomerates are investing
while FDI by large-scale companies is holding well.
• High consumer confidence has been supportive for the economy, one of the fastest
growing in the world.
Figure 1: Contribution to GDP Growth, 1H 2018 (% YoY)
Source: GSO, RongViet Securities
The recovery of the agriculture, forestry and fishery sectors, a buffer for the economy, is worth
noting. Agriculture grew by 3.3% YoY, contributing 0.45 percentage to the general growth while
the fishery sector grew by 6.4% YoY, an eight-year high. Export revenues of key goods, including
fish, fruits and rice, rose and stood at USD 3.2 Billion; USD 1.7 Billion and USD 1.5 Billion in the first
five months of 2018. Notably, rice export turnover climbed by 40% YoY due to better prices and
wining auctions in Indonesia, Philippines.
-2%
0%
2%
4%
6%
8%
2011 2012 2013 2014 2015 2016 2017 2018
Agriculture Manufacturing Services Tax and subsides
Rong Viet Securities Corporation – Investment Strategy Report July 2018 4
Figure 2: Agriculture’s 1H growth (% YoY) Figure 3: Export turnover of agriculture goods (Bn USD)
Source: GSO, RongViet Securities Source: Customs, RongViet Securities
Meanwhile, the core of Vietnam’s economy, the industrial sector, grew by 9.3% YoY in the first
half, better than the 7.0% YoY and 5.4% YoY in 2016 and 2017. Manufacturing still made the
biggest contribution to the sector and surged 13.0% YoY, a seven year high.
Meanwhile, the consumption index rose 11.9% YoY, higher than the growth of 8.4% YoY in
1H2017. The manufacturers of steel, motor vehicles, petroleum products, pharmaceutical,
beverages, textiles and clothes performed well versus a year ago. We emphasize that some of
these sectors benefited from tariff barriers put up by the government in 2018 against imported
goods.
Stronger demand and improved business conditions explained why Vietnam’s PMI
manufacturing rose to 55.7 points in June from 53.9 in May. The Nikkei survey showed an
acceleration of output and new orders, which resulted in fast job creation.
We assess that Vietnam’s manufacturing industry is in a changing phase and its momentum will
be strong in the next two years. In addition to the important role of FDI, domestic conglomerates
have been investing in manufacturing to replace imported products. For example, Nghi Son and
Dung Quat refineries will supply 60% of domestic demand of gasoline and petroleum. The Hoa
Phat Dung Quat steel complex’s first and second phases will start operating in January and August
of 2019, creating a huge supply of higher-level steel, besides Formosa’s products. The well-known
project, Vinfast, is likely to launch its first product at the end of 2018.
Figure 4: Industrial production index (% YoY) Figure 5: ASEAN manufacturing PMI
Source: GSO, RongViet Securities Source: Nikkei, RongViet Securities
-1%
0%
1%
2%
3%
4%
5%
2011 2012 2013 2014 2015 2016 2017 2018
0
1
2
3
4
5M2018 5M2017 5M2016
Fish Fruit Rice
100
104
108
112
116
2014 2015 2016 2017 2018
Industrial Production Manufacturing
45
47
49
51
53
55
57
04/2018 05/2018 06/2018
Vietnam Thailand Singapore Philippines
Myanmar Malaysia Indonesia
Rong Viet Securities Corporation – Investment Strategy Report July 2018 5
Figure 6: Industry consumption index Figure 7: Other sectors’ consumption indices
Source: GSO, RongViet Securities Source: Nikkei, RongViet Securities
Vietnam’s economy will keep expanding in 2019-2020 thanks to the strategy of focusing on the
domestic market. Currently, consumer consumption accounts for over 60% of GDP. In 1H2018,
wholesale and retail sales increased by 8.2% YoY and became the fastest growing services sector.
More and more bankers and insurers focus on the retail segment while mortgage loans support
the growth of property developers. According to a survey by Nielsen, Vietnamese consumers are
growing more and more confident about their future income. After saving for the long term,
Vietnam’s residents are willing to buy premium healthcare insurance packages, repairing houses
and traveling.
Figure 8: Consumer confidence index
Source: GSO, RongViet Securities
Our view
The economy is experimenting with two fairly new elements; 1) the development of non-state
sectors and 2) higher and higher consumer confidence. The privatization of SoE’s has been
pushing up the percentage of private investment capital which accounts for over 41% of total
investment in 1H2018, an all-time high. Vietnamese conglomerates are willing to invest in the
manufacturing sector whose products are to be substitute for imported goods. Most of these
projects are at a “building phase”, therefore will have an impact for many years. Meanwhile, there
is a gap to fulfill the aggregate demand as the Vietnamese’s income and consumer confidence
brightens. Under these circumstances, we are confident that 2H2018 GDP growth could be
around 6.6% - 6.9% YoY.
-10%
-5%
0%
5%
10%
15%
20%
25%
1H2013 1H2014 1H2015 1H2016 1H2017 1H2018
Other non-metallic mineral products
Basic metals
Prefabricated metal products
Industry Consumption
0%
4%
8%
12%
16%
1H2013 1H2014 1H2015 1H2016 1H2017 1H2018
Beverages Textiles Clothes
80
90
100
110
120
130
140
Philippines Indonesia Vietnam Thailand Singapore Malaysia SEA*
Q2 2017 Q3 2017 Q4 2017 Q1 2018
Rong Viet Securities Corporation – Investment Strategy Report July 2018 6
Figure 9: Realized social investment capital (% of total investment)
Source: GSO, RongViet Securities
FDI flow into manufacturing sector slow down
The economy’s prospect will be affected by global changes. In our special report of the impact of
US trade policies and warning point for KORUS FTA’s negotiations, we are concerned about lower-
than-expected FDI in upcoming years.
In 1H2018, there were signals of a slow-down of growth of foreign direct investment in the
manufacturing sector as the total of newly registered capital and additional capital flows dropped
nearly by 20% YoY. During the past four years, such investment significantly depended on South
Korean Chaebols, including Samsung and LG. However, there are lesser big-scale manufacturing
projects. Instead, Vietnam recorded billion-dollar projects in power generation and real estate.
From our point of view, one of the most important momentum of FDI inflow into Vietnam is
“efficiency-seeking investment” to take advantage of low manufacturing costs. Therefore,
changes in the global trade picture caused by populism around the world is likely to make some
people reconsider their investment plans in Vietnam. Better ASEAN integration, effectively
exploiting Chinese market and urgently signing the EU-Vietnam FTA should be a priority for
lawmakers.
Figure 10: FDI (Billion USD)
Source: GSO, RongViet Securities
0%
10%
20%
30%
40%
50%
1H2008 1H2013 1H2018
State capital Private capital Foreign capital
0
2
4
6
8
10
12
14
16
18
1H2014 1H2015 1H2016 1H2017 1H2018
Manufacturing Construction and Real estate Scientific activities
Electricity and gas production Wholesale and retail trade Mining and quarrying
Others
Rong Viet Securities Corporation – Investment Strategy Report July 2018 7
Monetary policy adjusting to market movements
Up to the middle of June 2018, total outstanding liquidity (M2) and deposit increased 8% YTD and
7.8% YTD, higher than those of 5.7% YTD and 5.9% YTD from the similar period in 2017. The
surging growth of M2 is obviously to absorb large foreign indirect investment.
However, the year-to-date growth of credit was just 6.4% in compared with 2017’s 7.5%. The gap
between M2 growth and credit growth implies abundant liquidity, which keeps the VND
overnight interest rate very low.
Interest rates differentials between USD and VND overnight rates keeps pressure on the Dong/
USD exchange rate. The negative gap between VND and USD overnight interest rates has
encouraged FX participants to keep buying dollars. Such a response can result in speculation and
pressure on FX rates.
Figure 11: Indicators of monetary policy Figure 12: Overnight interest rate
Source: SBV, RongViet Securities Source: SBV, RongViet Securities
There is no doubt that the monetary policy operations of the State Bank of Vietnam (SBV) has
improved over the past ten years. During the past two months, we strongly think that SBV’s was
aggressive to withdraw money via T-Bill issuances. There were lots of failed auctions during the
first half of June which might explain the increase in T-Bills’ interest rates and the appearance of T-
Bill’s of 91-day maturity.
Recently, SBV’s governor, Mr. Nguyen Minh Hung, has spoken of Vietnam’s FX reserve of USD 63.5
Billion to calm down investors’ worries about the VND’s depreciation. In our point of view, the Dong
is overvalued by 4-6% and the Yuan’s current depreciation against the greenback will put pressure
on Vietnamese lawmakers.
Figure 13: OMO market (Billion VND)
Source: SBV, RongViet Securities
8.0%
6.4%
7.8%
0%
2%
4%
6%
8%
10%
1H2014 1H2015 1H2016 1H2017 1H2018
M2 growth Credit growth Deposit growth
0%
1%
2%
3%
4%
5%
01/2017 05/2017 09/2017 01/2018 05/2018
VND Overnight Interest Rate
USD Overnight Interest Rate
-300,000
-200,000
-100,000
0
100,000
200,000
300,000
06/12 06/13 06/14 06/15 06/16 06/17 06/18
Reverse repo Notes Net flow
Rong Viet Securities Corporation – Investment Strategy Report July 2018 8
VIETNAM’S STOCK MARKET IN JUNE: ANOTHER GLOOMY MONTH
The uptrend only lasted for the first week of June; after that, sellers took control. The HNXIndex
fell by 6.8%, which worsened due to poor performances of ACB (-11.0%), VCS (-17.1%) and VGC (-
10.8%). The VNIndex, supported from VIC (+12.1%), VCB (+7.2%) and VNM (+4.4%), saw a less
severe outcome with a loss of only 1.4%.
Figure 14: VNIndex movement in June Figure 15: HNXIndex movement in June
Source: RongViet Securities Source: RongViet Securities
Hot listed stocks in June are TCB (a leader in bancassurance and corporate bond issuance) and
YEG (the first local entertainment company to list on the stock market). Their appearances could
not help to improve investors’ sentiment.
The trend of liquidity declining on the underlying markets and surging on the futures ones has
been still valid.
Figure 16: Matching trading value on the HSX and the futures market (Bn VND)
Source: FiinPro, RongViet Securities (*) Real cash with assumption of 30% leverage
MSCI’s 2018 reclassification result: not surprising
Vietnam has yet to qualify for the MSCI’s Review list from Frontier Market to Emerging Market.
MSCI will reclassify the MSCI Argentina Index to Emerging Markets status and consult on the
potential reclassification of the MSCI Kuwait Index to Emerging Markets status.
900
950
1,000
1,050
1,100
1,150
1,200
1,250
0
50
100
150
200
250
300
28/03 11/04 26/04 14/05 28/05 11/06 25/06
Trading Volume (mil. shares) VNINdex (right axis)
104
108
112
116
120
124
128
132
136
140
0
10
20
30
40
50
60
70
80
28/03 11/04 26/04 14/05 28/05 11/06 25/06
Trading Volume (mil. shares) HNXIndex (right axis)
-
4,000
8,000
12,000
16,000
01/18 02/18 03/18 04/18 05/18 06/18
HSX Futures(*)
Rong Viet Securities Corporation – Investment Strategy Report July 2018 9
Figure 17: MSCI’s reclassification process
Vietnam has completely met all the quantitative criteria, but the qualitative criteria is still a
challenge.
• Kuwait: only 5/17 criteria that “need improvement”.
• Vietnam: 9 criteria that “need improvement”: foreign ownership limit level, foreign room
level, equal rights to foreign investors, foreign exchange market liberalization level,
information flow, clearing and settlement, transferability, stock lending and short selling.
• In the 2015-2018 period, Vietnam only made one improvement on “investor registration
& account set up”.
Vietnam still has a long way to go.
On the positive side, Vietnam stocks’ weights in the MSCI Frontier Markets 100 Index will increase
from 17.4% to 21.5% (or 27.5% if Kuwait is reclassified to emerging market). Number of Vietnam
stocks thereby will increase from 17 to 30.
For now, there is only one considerable fund that is tracking the MSCI Frontier Market: Blackrock’s
iShares MSCI Frontier 100 ETF, with a NAV of USD 565 Mn. Accordingly, even if Vietnam’s weight
increased to 27.5%, MSCI Frontier tracking funds would just allocate another (27.5% - 17.4%) x 565
= USD 57 Mn into Vietnam, not a significant amount.
Price down, how about earnings?
The Index declined has led to the concern about the sustainability of corporate earnigns. In our
last month’s strategy report, we have noted that financial sector (banks, real estate, and
brokerages) has contributed a large amount to the earnings growth of the market. Excluding that
sector, we arrive at a NPAT growth of 10% in Q1 for non-financial sector. It was neither great nor
terrible, but promise to be higher in the remaining of the year.
Figure 18: Revenue and NPAT growth in Q1 2018 by sectors
Source: RongViet Securities
Year 1: Adding the
market to the review
list
Year 2: Consulting on the
potential reclassification
and giving one year of
testing period
Year 3:
Announcement of
reclassification
Year 4: Official
reclassification
14%
20%
10%
24%
-50%
-40%
-30%
-20%
-10%
0%
10%
20%
30%
40%
50%
Technology
Industrial
Oil&Gas
ConsumerServices
HealthCare
ConsumerGoods
BasicMaterial
Utilities
Marketwithout
financialsectors
Marketwith
financialsectors
Revenue growth NPAT growth
Rong Viet Securities Corporation – Investment Strategy Report July 2018 10
Foreign investors trading
Figure 19: Net trading value of Foreign Investors
Source: FiinPro, RongViet Securities
Foreign investors net sold VND 140 bn on both exchanges in June, however if we exclude YEG
(Yeah1)’s put-through transaction of VND 2,400 bn, they would have net sold over VND 2,500 bn.
Noticeably, foreign investors were selling more relentlessly in the correction period, which was
after the strong recovery in early June. While the VNIndex lost nearly 8% in value, foreign investors
also net sold up to VND 2,100 bn, accounting for most of the net-sold value in the month.
Accumulating since the beginning of this year, foreign investors have net bought VND 34,668 bn
on both exchanges. The last 6 months also witnessed some huge put-through deals of NVL (VND
3,400 bn), VHM (VND 30,000 bn) and YEG (VND 2,300 bn).
Second quarter exclusively, on the HOSE, foreign investors net bought VND 35,930 in put-through
value but only focused on several big deals, while net sold VND 11,348 through order-matching
method. This had a significant impact on the market’s negative sentiment recently.
Table 1: Foreign investor’s net trading by sector in both exchanges
Sector
HSX HNX
Net volume
(thousand
shares)
Net value (VND
Bn)
Net volume
(thousand
shares)
Net value (VND
Bn)
Oil & Gas -1,891 21 4,547 76
Chemicals -960 -19 -1,065 -17
Basic resources -16,622 -401 -244 0
Construction and building
materials
1,154 413 -10,425 -376
Industrial goods & services -324 15 527 17
Automobile & parts -1,991 -40 6 0
Food & beverage -30,139 92 -422 -7
Personal & household goods 172 3 -91 -1
Healthcare -613 -48 -59 -2
Retail 677 58 1 0
Communication 8,044 2,415 -358 -8
Travel & leisure -725 97 -86 -2
Utilities -2,177 -74 34 -0
Bank -79 298 -901 -8
Insurance -70 17 -7 -0
Real estate -30,666 -2,479 -1,879 -22
Financial services -17,357 -165 753 11
Technology -114 -2 -29 -0
Source: FiinPro, RongViet Securities
0
5,000
10,000
15,000
20,000
25,000
30,000
35,000
40,000
45,000
-5,000
0
5,000
10,000
15,000
20,000
25,000
30,000
02/01 20/03 01/06
Net bought/sold (LHS, VND Bn) Accumulated Value (RHS, VND Bn)
Rong Viet Securities Corporation – Investment Strategy Report July 2018 11
QUARTER 3 STOCK MARKET OUTLOOK
• Markets should get used to a new, hostile normal
• Currencies have been in the limelight recently because of the potential ‘trade war(s)’
• There will be better buying opportunities as this time-correction fazes out.
Markets should get used to a new, hostile normal
The supreme art of war is to subdue the enemy without fighting - Sun Tzu
Over the past 20 years, the world has been through one of the greatest asset inflation story of
modern times. One could argue that it begun way back in the 1980s when US bond yields went
from double digits to close to below two percent in the mid 2010s. The psychological implications
have been enormous, affecting the behavior of not only financial markets investors but ‘ordinary’
people. Free money claimed some.
Where are we going now? Stagflation? Is the current bull run over?
Let us just start by unequivocally rejecting, for now, the probability that the world is entering a
period of stagflation. Global GDP growth for 2018-2019 will stay robust and even though some
prices are rising due to supply constraints and tariffs, we are not seeing global inflation being a
major impediment at this point. Watch this space as things could change quickly if a full blown
out trade war arises. Tail risks are rising and the literature suggests that a major global trade
confrontation would likely push the US in a recession and the rest of the world to the brink of a
recession.
The larger global risk, apart from the rhetoric about trade war (s), is clearly the possibility that yield
curves may invert. In other words short-term rates moving higher than long-term ones. The
spread between 10-year and 2-year yields on US bonds has been narrowing for some time and
now stands at just 35 basis points compared to 200 bps five-years ago. Historically, inversions
precede recessions and are not a great backdrop for bank stocks.
Figure 20: US 10-year yields minus 2-year, basis points
Data as of June 28
Source: Bloomberg
There is wide disagreement over whether equity markets have further to climb or whether we will
see a spectacular market correction.
Well for one, if you believe that there is still some ‘juice’ to extract from equities, stay long cyclicals
and industrials. If you think that the run is over, switch into defensive stocks like utilities,
0
50
100
150
200
250
300
06/2013
12/2013
06/2014
12/2014
06/2015
12/2015
06/2016
12/2016
06/2017
12/2017
Rong Viet Securities Corporation – Investment Strategy Report July 2018 12
telecommunications and pharmaceuticals. These last three sectors have been losing out in the
past few quarters. Dispersion levels have been rising: people sold the losers to buy the winners.
Currently there appears to be four headwinds facing equities:
• Firm oil prices
• Mighty dollar
• Rising pressure on prices and wages in developed economies
• The Donald
We also can add the fact that equities globally have been in an uptrend for nine years: a long cycle.
On the positive side, real rates are negative in most developed economies and valuations are more
reasonable following the recent correction, but still not ‘that cheap’ ( table2). The P/CF of the MSCI
World and the S&P 500 are currently 11.4x and 14.1x, much higher that their 10-year average of
8.9x and 9.6x, respectively.
Table 2: MSCI Indices and VN Index Valuations
P/E
Current
P/E
End 2017
P/E
10- year
average
P/BV
Current
P/BV
End 2017
MSCI World 18.7x 19.5x 18.2x 2.4x 2.4x
MSCI EM 13.6x 15.1x 13.8x 1.6x 2.4x
MSCI ASEAN1
14.8x 17.3x 15.3x 1.6x 1.9x
VN Index 18.5x 18.1x 12.9x 2.7x 2.8x
Source: MSCI, Rong Viet Securities
Currencies have been in the limelight recently because of the potential ‘trade war(s)’
The key is the Renminbi. A sharply weaker Chinese currency could destabilize already vulnerable
ones around the world, especially in the ASEAN region. The RMB is down 6% against the
greenback since mid-April. However, we put a very low probability that the Chinese authorities
would respond to this ill-prepared trade war by resorting to a devaluation of the Renminbi. China
wants to make its currency a global one; hence devaluing it would send the wrong message.
Moreover, the country does not need it from a macroeconomic standpoint. Repo rates (Figure 21)
have been steady for the pas two years, implying that there is very little stress in the system.
Figure 21: Renminbi/ USD, quarterly
Source: Bloomberg, Rong Viet Securities
1
Indonesia, Malaysia, Philippines, Singapore and Thailand.
4.0
4.5
5.0
5.5
6.0
6.5
7.0
7.5
8.0
8.5
9.0
03/1990
03/1992
03/1994
03/1996
03/1998
03/2000
03/2002
03/2004
03/2006
03/2008
03/2010
03/2012
03/2014
03/2016
03/2018
Rong Viet Securities Corporation – Investment Strategy Report July 2018 13
Figure 22: China 7-day Repo Rate, %
Source: Bloomberg, Rong Viet Securities
Vietnamese and ASEAN equities and currencies have not been immune to the steep correction
that started globally in February/ March. Ceteris paribus, Vietnam’s economy should continue to
grow at a healthy pace for the foreseeable future (see our Economist comments in the next
section). Note that on the currency front, among ASEAN, the VND has outperformed in 2Q.
Figure 23: VN Index and VND, 2000-current
Source: Bloomberg, Rong Viet Securities
The VN Index has lately become more correlated to the MSCI Emerging Index. This is most likely
due to investors’ expectations of an inclusion of Vietnam in the index.
Figure 24: VN Index & MSCI Emerging Markets correlation
Source: Bloomberg
1
2
3
4
5
6
7
8
06/2013 12/2013 06/2014 12/2014 06/2015 12/2015 06/2016 12/2016 06/2017 12/2017
100
300
500
700
900
1,100
1,300
13,000
15,000
17,000
19,000
21,000
23,000
DONG/ USD (lhs)
VN Index
Rong Viet Securities Corporation – Investment Strategy Report July 2018 14
Bottom Line
• Equity markets globally are most likely to go nowhere for the next few months, except
for small rallies here and there. Seasonality does not help. The Tech sector, up 13 percent year
to date, now accounts for 25% of the S&P 500. Kind of reminds us of the pre-Nasdaq crash
period of 1999-2000…
Our target for the S&P 500 Index is around 2300, 15% lower from its current level
Figure 25: Performance of some major global stock market indexes in June
Source: Bloomberg, RongViet Securities
• Vietnamese equities are still pricey (Table 2). The market is supported by rising RoE (19%
in 2018F versus 15% in 2017) and high EBITDA margins (26%). Will it be enough? P/E’s have
expanded for the past seven years (Table 3).
Table 3: VN Index P/E
2011 2012 2013 2014 2015 2016 2017
P/E 8.8x 11.7x 12.4x 12.9x 12.5x 15.6x 18.1x
Source: Bloomberg
• We expect a period of consolidation for the VN Index in 3Q. Our target range is 900 to
1000 with a preference for a re-test of 900.
A couple of things to notice from the price action in 2Q2
:
• On April 5, the VN Index peaked at 1207, 34% above its 200-day moving average.
• The Index has currently retreated to its 200-day moving average at around 983-986.
• From the bottom at 916 in early June, the Index has recovered to 1027, a 38%
retracement from the 1207 level. Since then it has stalled.
A break below 900 would take the Index to around 840, the lower bound of the upward channel
in place for the past two years. It is possible that the market tries to break the 1027-40 level but
that would only be possible in a risk-on environment. Overall, we remain bearish on the VN Index
for the next few months. There will be better buying opportunities as this time-correction fazes
out.
2
Prices as of June 28
-2%
2%
10%
-1%
0%
-5%
-2%
-13%
-3%
2%
-6%
-9%
-11%
-2%
-9%
-4%
23%
-17%
-7%
3%
13%
23%
DowJones
S&P500
Nasdaq
FTSE100
CAC40
DAX
Nikkei225
SSE(Shanghai)
HangSeng(Hongkong)
TSEC(Taiwan)
Kospi(Korean)
JKSE(Indonesia)
KLSE(Malaysia)
VNIndex(Vietnam)
HNX-Index(Vietnam)
Gold
Oil
From 31/05/2018 to 29/06/2018 From 31/12/2017 to 29/06/2018
Rong Viet Securities Corporation – Investment Strategy Report July 2018 15
Rong Viet Securities Corporation – Investment Strategy Report July 2018 16
INVESTMENT STRATEGY AND IDEAS: STOCK PICKING
Despite rising external risks caused in part by the US – China trade war, Vietnam’s economy
showed its best performance since 2011 in the first six months of 2018:
• Vietnam’s GDP growth grew by 7.1% YoY in H1 2018 with the recovery of agriculture, and
the faster growth of manufacturing and services.
• Vietnam’s PMI reached 55.7 in June from 53.9 in May, driven by increasing output and
more new orders.
• Total retail and services sales grew 8.3% YoY (inflation adjusted), higher than the growth
of 7.9% in H1 2017.
• The confidence of consumer as well as investors has been rising: Vietnamese consumers
are willing to pay more for premium goods such as healthcare insurance and
discretionary consumption goods. Following the Government’s support, domestic
investors have been investing more in manufacturing substitute goods enterprises.
In the stock market, VNIndex’s PE decreased to around 16x, equivalent to the level of mid-2017
after more than three consecutive months of a deep price correction. Meanwhile, the market’s
NPAT growth was 24% YoY in Q1 2018, implying a less-than-1 PEG ratio.
However, Vietnam’s stocks still face more risks from external factors (FED rates hike, trade war,
and Renminbi depreciation) which can put more pressure on a potential devaluation of the Dong
and an outflow of “fast money”.
Although we believe that the SBV’s resources are strong enough to control FX fluctuations within
its target range, we think monetary policy will be tighter in the H2 2018, implying less liquidity for
risky sectors like the stock market and real estate.
Due to these reasons, along with coming business earnings results coming out, we think that
good buying opportunities will occur during the deep correction of the market. However, an
uptrend trend will not come within all stocks/sectors. Smart money will carefully choose
companies with good business results and not be invested across the board. For this month, we
would like to introduce our two picks, NLG and FPT.
HSX:NLG – TP: VND 40,200. After a long period of accumulating land bank, in 2018, Nam Long
has come into the final step of implementing the Waterpoint project - the largest project in NLG’s
land bank. In addition, after the successful launch of the Mizuki Park project, the company will be
busy on developing other new projects such as Akari City and Flora Keshi, creating momentum
for Nam Long in the coming years. Given that the company has specific plan for its biggest project,
i.e. Waterpoint, we revise up our target price to VND 40,200 per share.
HSX:FPT – TP: VND 63,600. After divesting from its trading and retail subsidiaries, FPT “lost” half
of its consolidated revenue, nevertheless it managed to grow its profits by over 20%, which
emphasizes the contrast between the core business (IT and telecom) and the ex-subsidiaries. Like
for like comparison, FPT’s profit achieved higher growth rate than its revenues did, which means
an improvement in operating efficiency. For 5M2018, the company’s revenue and PBT were VND
8,290 Bn (-49% YoY) and VND 1,408 Bn (+21% YoY), fulfilled 37.9% and 40.4% its guidance for 2018
respectively.
Finally, Rong Viet’s Research Department unveils its portfolio made up of Vietnamese stocks
under coverage. This is a long-only absolute-return portfolio as shown below:
Rong Viet Securities Corporation – Investment Strategy Report July 2018 17
Table 4: Vietnam thematic portfolio for long-term absolute-return investors
Sector Name Ticker
Weight Purchase Current Gain/ Loss
(%) Price Price (%)
Cons Services VietJet Air VJC 10 131,000 131,000 0.0
Cons Goods Quang Ngai Sugar QNS 10 35,600 35,600 0.0
Cons Goods Vinh Hoan VHC 10 56,500 56,500 0.0
Basic Materials Phuoc Hoa Rubber PHR 10 19,000 19,000 0.0
Industrials Taseco Air Services AST 10 62,400 62,400 0.0
Industrials Airport Corp Vietnam ACV 10 86,000 86,000 0.0
Basic Materials Nam Kim Steel NKG 10 14,400 14,400 0.0
Financials Dat Xanh DXG 5 24,900 24,900 0.0
Utilities Central Hydro Power CHP 10 23,000 23,000 0.0
Cash 15
Total 100
Readers should refer to the relevant Rong Viet research reports for detailed analysis and disclosures.
Prices as of July 04
Source: Rong Viet Securities
Rong Viet Securities Corporation – Investment Strategy Report July 2018 18
Ticker Exchange
Market
cap
(USD
mn)
Total
Return
Rating
2017 2018F 2019F
PER
Trailing
(x)
PER
2018F
(x)
PBR Cur.
(x)
Div Yield
(%)
+/- Price
1y (%)
3-month
avg. daily
turnover
(USD
thousand)
Foreign
remaining
room
(%)
Target
price
(VND)
Price @
July 04
(VND)
+/- Rev.
(%)
+/- NPAT
(%)
+/- Rev.
(%)
+/- NPAT
(%)
+/- Rev.
(%)
+/- NPAT
(%)
ACB HNX 1,504.0 44,000 32,000 37.5% Buy 4,531.6 81.0 59.8 16.3 119.1 17.6 12.5 8.0 1.9 0.0 34.3 8,246.4 0.0
ACV UPCOM 8,113.2 124,000 86,000 45.2% Buy 3,207.0 -5.5 -18.1 38.8 58.9 13.4 42.6 30.1 6.6 1.0 71.3 503.5 45.4
AST HOSE 97.4 80,000 62,400 34.6% Buy 4,673.0 108.0 236.1 28.4 12.0 13.2 15.8 16.7 4.5 6.4 0.0 335.0 25.4
BFC HOSE 63.7 40,500 25,700 73.2% Buy 6,173.0 6.1 0.2 8.2 10.6 14.7 5.8 4.8 1.5 15.6 -29.6 45.3 35.1
CHP HOSE 138.1 29,000 23,000 32.6% Buy 2,289.3 32.5 59.2 -26.1 -38.4 12.1 16.2 13.2 1.7 6.5 -2.4 60.8 45.3
CTD HOSE 469.9 160,100 138,500 19.2% Accumulate 17,530.5 30.7 16.2 5.0 -5.7 0.0 6.5 8.0 1.4 3.6 -33.6 1,683.7 7.2
CTG HOSE 3,533.8 31,900 21,900 48.9% Buy 2,719.3 23.3 9.2 10.5 33.7 13.2 10.4 10.5 1.2 3.2 11.6 7,402.7 0.0
CTI HOSE 78.6 31,500 28,800 14.9% Accumulate 1,344.0 7.1 39.2 131.3 214.9 -44.0 11.7 10.0 1.5 5.6 0.4 410.6 21.2
DHG HOSE 566.0 102,000 99,900 5.1% Accumulate 5,767.0 7.4 -9.5 15.2 31.8 9.3 20.4 17.6 4.7 3.0 -15.1 1,132.3 2.1
DIG HOSE 149.7 22,500 14,500 55.2% Buy 1,846.5 68.4 31.7 25.7 24.9 66.9 30.7 14.1 1.2 0.0 -4.7 1,775.8 8.6
DPM HOSE 281.5 22,400 16,600 47.0% Buy 2,194.0 0.9 -39.1 35.1 -13.1 7.4 10.0 12.7 0.8 12.0 -22.1 641.0 28.8
DRC HOSE 114.8 29,500 22,300 40.4% Buy 2,367.0 9.2 -59.1 3.1 87.7 4.5 23.7 9.5 1.7 8.1 -26.0 425.1 25.5
DXG HOSE 369.4 36,106 24,900 45.0% Buy 3,149.9 14.9 39.8 56.2 37.7 1.0 9.2 8.2 1.8 0.0 72.8 5,352.8 5.2
FPT HOSE 1,063.6 63,600 40,000 64.0% Buy 4,487.5 8.0 47.0 -47.7 -28.7 13.5 8.1 10.3 2.0 5.0 3.4 3,931.2 0.0
GAS HOSE 6,594.1 125,900 79,500 63.4% Buy 5,589.0 9.3 36.4 14.3 15.9 10.6 15.2 13.9 3.5 5.0 41.6 3,467.1 45.6
HAX HOSE 24.3 30,000 16,000 87.5% Buy 4,282.4 33.1 8.1 34.1 34.2 30.3 9.6 5.0 1.0 0.0 -46.3 69.7 37.8
HDG HOSE 111.9 39,200 34,000 16.8% Accumulate 5,825.3 14.1 -16.0 N/a N/a -0.2 12.2 7.1 2.1 1.5 7.4 328.5 35.2
HPG HOSE 3,414.8 51,400 37,100 38.5% Buy 6,794.0 38.7 21.3 25.5 682.4 44.7 9.2 7.8 1.6 0.0 57.4 11,593.7 9.8
HTM UPCOM 88.2 15,500 9,200 70.7% Buy 851.0 -5.8 -20.0 26.2 136.3 11.3 63.8 23.8 0.7 2.2 0.0 710.6 34.3
IDC UPCOM 280.6 33,500 22,500 51.1% Buy 1,162.6 N/a N/a N/a N/a 5.7 2.7 23.5 0.4 2.2 0.0 180.5 0.0
IMP HOSE 112.0 67,100 52,300 29.3% Buy 3,050.0 15.4 16.0 20.4 21.6 21.2 20.8 20.6 1.6 1.0 -4.1 87.1 0.0
KBC HOSE 238.2 16,270 11,700 47.6% Buy 1,433.0 -36.0 4.9 84.5 23.3 -5.7 8.9 9.3 0.6 8.5 -31.6 1,857.1 31.5
LTG UPCOM 112.3 57,100 39,000 54.1% Buy 6,042.0 11.6 23.9 7.1 1.4 8.3 6.0 7.0 1.1 7.7 0.0 62.7 4.2
MBB HOSE 1,880.4 36,300 23,900 54.0% Buy 1,907.4 40.7 39.7 15.0 73.6 6.9 10.5 13.2 1.5 2.1 16.5 7,896.3 0.0
MKP UPCOM 53.2 94,000 62,000 54.0% Buy 7,200.0 8.3 -4.2 -0.5 20.0 15.2 10.6 9.5 1.2 2.4 0.0 4.8 1.4
NCS UPCOM 28.6 60,000 37,000 67.6% Buy 4,365.0 15.4 24.2 10.4 -15.5 14.0 7.9 10.3 2.8 5.4 -3.5 10.0 47.2
NKG HOSE 113.6 28,500 14,400 104.9% Buy 3,824.0 41.2 36.6 45.9 16.7 32.9 3.5 3.9 0.6 6.9 -40.3 334.9 59.2
NLG HOSE 256.5 40,200 28,200 42.6% Buy 3,375.3 24.8 55.0 11.9 61.0 -60.5 9.6 8.2 1.7 0.0 23.9 680.4 0.0
NT2 HOSE 378.0 37,600 30,300 36.6% Buy 3,412.9 -15.3 -25.3 13.7 21.8 13.9 11.2 9.3 1.7 12.5 13.8 583.1 28.0
OIL UPCOM 693.9 18,232 15,400 18.4% Accumulate 493.0 52.0 -13.6 -3.7 -7.2 14.2 39.4 37.0 1.7 0.0 0.0 664.6 0.0
PC1 HOSE 160.1 37,000 32,000 15.6% Accumulate 4,030.2 5.1 -22.1 55.2 130.3 3.3 13.9 8.5 1.3 0.0 -8.6 170.4 11.2
PGI HOSE 71.1 24,900 18,500 41.1% Buy 2,448.0 0.0 24.9 10.7 7.7 11.2 11.8 9.6 1.2 6.5 -5.5 4.3 28.1
PHR HOSE 111.6 30,200 19,000 69.5% Buy 5,210.7 40.4 48.5 2.3 92.4 13.3 7.2 N/a 0.6 10.5 -3.2 474.5 40.1
PME HOSE 229.5 106,100 70,600 53.1% Buy 5,264.0 7.6 19.7 25.1 20.3 17.0 18.1 15.5 2.8 2.8 0.0 33.0 0.0
PNJ HOSE 571.3 103,000 81,300 30.4% Buy 7,250.0 28.2 61.1 31.7 28.6 13.4 15.9 14.1 2.7 3.7 20.4 2,996.5 0.0
POW UPCOM 1,240.7 18,400 12,400 48.4% Buy 1,118.7 5.4 82.1 20.0 7.9 7.9 11.8 14.2 1.0 0.0 0.0 933.7 -16.6
PPC HOSE 241.1 22,000 17,350 35.4% Buy 1,916.9 4.3 52.4 4.1 -5.9 1.2 6.3 7.6 1.0 8.6 -2.2 184.6 33.5
HIGHLIGHT STOCKS
Rong Viet Securities Corporation – Investment Strategy Report July 2018 19
Ticker Exchange
Market
cap
(USD
mn)
Total
Return
Rating
2017 2018F 2019F
PER
Trailing
(x)
PER
2018F
(x)
PBR Cur.
(x)
Div Yield
(%)
+/- Price
1y (%)
3-month
avg. daily
turnover
(USD
thousand)
Foreign
remaining
room
(%)
Target
price
(VND)
Price @
July 04
(VND)
+/- Rev.
(%)
+/- NPAT
(%)
+/- Rev.
(%)
+/- NPAT
(%)
+/- Rev.
(%)
+/- NPAT
(%)
PVS HNX 307.8 22,500 15,900 47.2% Buy 1,738.0 -10.5 -22.9 -11.7 0.4 -0.8 8.9 9.5 0.7 5.7 -3.7 3,350.6 30.7
PVT HOSE 176.9 18,100 14,500 38.6% Buy 1,438.0 -9.0 0.7 9.4 -1.1 4.6 9.2 10.5 1.1 13.8 -0.3 321.5 15.5
QNS UPCOM 451.6 61,800 35,700 77.3% Buy 5,294.0 9.6 -27.9 7.8 19.6 5.2 10.6 7.4 1.9 4.2 -47.9 432.0 39.0
REE HOSE 403.1 48,400 30,000 66.7% Buy 5,535.2 36.5 26.0 13.3 23.3 4.6 6.5 5.5 1.2 5.3 -15.3 1,070.4 0.0
SHP HOSE 87.3 25,400 21,500 25.1% Buy 2,128.6 20.3 88.9 -1.9 -7.1 3.0 11.8 11.7 1.7 7.0 4.4 11.7 44.3
STK HOSE 37.7 21,500 14,500 51.7% Buy 2,419.0 46.6 242.3 2.0 27.7 7.9 7.7 7.0 1.1 3.4 -10.2 17.1 39.6
TCM HOSE 42.2 30,500 18,000 75.0% Buy 3,276.0 4.5 67.8 -0.9 -9.1 8.8 5.1 5.7 0.9 5.6 -37.4 195.6 0.0
VCB HOSE 8,668.9 60,000 55,600 9.4% Accumulate 2,568.7 18.2 33.0 8.7 17.4 12.0 19.3 23.6 3.6 1.4 46.8 8,406.7 9.4
VGC HNX 398.3 30,200 20,500 52.2% Buy 2,682.4 11.4 23.7 14.4 41.8 15.6 15.1 9.7 1.4 4.9 12.3 2,258.7 25.7
VGS HNX 17.3 15,500 10,600 57.5% Buy 2,434.1 31.4 -12.3 27.9 37.8 3.2 5.2 4.8 0.7 11.3 1.9 78.8 42.4
VHC HOSE 226.0 61,100 56,500 11.7% Accumulate 10,168.0 11.6 4.7 15.8 20.3 11.7 8.8 7.4 1.8 3.5 0.3 1,004.8 8.8
VIC HOSE 14,523.1 95,041 105,000 -9.5% Reduce 3,414.3 68.4 74.1 39.2 74.7 27.1 78.3 44.8 8.3 0.0 202.5 18,206.7 40.5
VJC HOSE 3,074.8 159,100 131,000 23.7% Buy 11,926.0 54.0 81.0 17.7 26.6 25.8 12.9 10.3 5.1 2.3 81.0 6,072.3 5.4
VNM HOSE 10,503.1 215,323 167,000 31.9% Buy 8,683.0 9.1 10.1 17.0 18.4 15.0 24.1 22.1 9.4 3.0 9.9 8,501.2 40.4
VRE HOSE 3,180.1 51,200 38,600 32.6% Buy 1,712.4 -13.6 -17.2 73.5 44.0 -7.3 39.8 25.3 2.8 0.0 0.0 5,426.6 17.0
VSH HOSE 151.9 22,100 17,000 35.9% Buy 1,505.3 17.5 10.8 3.2 -3.1 112.7 11.1 12.7 1.1 5.9 4.6 24.8 34.7
(*) Total Return = Stocks’ Upside plus dividend yield
Rong Viet Securities Corporation – Investment Strategy Report July 2018 20
MACRO WATCH IN JUNE
FX rate in free market FX rate in interbank market
Source: SBV, RongViet Securities Source: SBV, RongViet Securities
Contribution to CPI in June Inflation changes
Source: GSO, RongViet Securities Source: GSO, RongViet Securities
Government Bond Auctions Government Bond Yields
Source: HNX, Customs, RongViet Securities Source: Bloomberg, RongViet Securities
22,200
22,400
22,600
22,800
23,000
23,200
01/2018 03/2018 05/2018 07/201
USDVND Free Market
Central FX rate
Trading FX rate
22,500
22,700
22,900
23,100
23,300
23,500
01/2018 03/2018 05/2018 07/201
SBV selling rate 1 Week
2 Weeks 1 Month
0%
1%
2%
3%
4%
5%
6%
10/2016 04/2017 10/2017 04/2018
Headline inflation Core inflation
0
20
40
60
80
100
120
0
10
20
30
40
50
60
70
06/15 06/16 06/17 06/18
VST
VBSP
VDB
Winning-to-Offering ratio (RHS)
(Trillion VND) (%)
0
1
2
3
4
5
6
01/2018 03/2018 05/2018 07/2018
VGB yield - 1Y VGB yield - 3Y VGB yield - 10Y
Rong Viet Securities Corporation – Investment Strategy Report July 2018 21
INDUSTRY INDEX
Level 1 industry movement Level 2 industry movement
Source: RongViet Securities Source: RongViet Securities
Industry PE comparison Industry PB comparison
Source: RongViet Securities Source: RongViet Securities
-8%
-7%
-1%
10%
0% -1%
-3%
-2%
1% 0%
-10%
-5%
0%
5%
10%
15%
Technology
Industrials
Oil&Gas
ConsumerServices
HealthCare
ConsumerGoods
Banks
BasicMaterials
Financials
Utilities
4%
-5%
2%
-8%
-1%
-8%
0%
13%
0%
-11%
0%
-3%
-12%
-3%
0%
2%
-11%
0%
-20% 0% 20%
Retail
Insurance
Real Estate
Technology
Oil & Gas
Financial Services
Utilities
Travel & Leisure
Industrial Goods & Services
Personal & Household Goods
Chemicals
Banks
Automobiles & Parts
Basic Resources
Food & Beverage
Media
Construction & Materials
Health Care
09
12
18
13
18
22
16
09
22
16
18
11
Technology
Industrials
Oil&Gas
ConsumerServices
HealthCare
ConsumerGoods
Banks
BasicMaterials
Financials
Utilities
HSX
HNX
02 02
03
04
03
06
02
01
06
03
04
02
Technology
Industrials
Oil&Gas
ConsumerServices
HealthCare
ConsumerGoods
Banks
BasicMaterials
Financials
Utilities
HSX
HNX
Rong Viet Securities Corporation – Investment Strategy Report July 2018 22
ANALYSIS & INVESTMENT ADVISORY DEPARTMENT
Bernard Lapointe
Head of Research
bernard.lapointe@vdsc.com.vn
+ 84 28 62992006 (1525)
Lam Nguyen
Senior Strategist
lam.ntp@vdsc.com.vn
+ 84 28 6299 2006 (1313)
• Banking
• Conglomerates
Hieu Nguyen
Senior Analyst
hieu.nd@vdsc.com.vn
+ 84 28 6299 2006 (1514)
• Market Strategy
• Pharmaceuticals
• Aviation
Duong Lai
Senior Analyst
duong.ld@vdsc.com.vn
+ 84 28 6299 2006 (1522)
• Real Estate
• Building Materials
Vu Tran
Senior Analyst
vu.thx@vdsc.com.vn
+ 84 28 6299 2006 (1518)
• Oil & Gas
• Food & Beverage
Trinh Nguyen
Analyst
trinh.nh@vdsc.com.vn
+ 84 28 6299 2006 (1331)
• Steel
• Construction
• Technology
Quang Vo
Analyst
quang.vv@vdsc.com.vn
+ 84 28 6299 2006 (1517)
• Market Strategy
• Basic Materials
• Personal Goods
Son Phan
Analyst
son.pnt@vdsc.com.vn
+ 84 28 6299 2006 (1519)
• Utilities
• Natural Rubber
Tu Vu
Analyst
tu.va@vdsc.com.vn
+ 84 28 6299 2006 (1511)
• Macroeconomics
Son Tran
Analyst
son.tt@vdsc.com.vn
+ 84 28 6299 2006 (1527)
• Market Strategy
• Retails
• Consumer chemicals
Tung Do
Analyst
tung.dt@vdsc.com.vn
+ 84 28 6299 2006 (1521)
• Logistics
• Aviation
Thu Pham
Analyst
thu.pa@vdsc.com.vn
+ 84 28 6299 2006 (1520)
• Industrial Real Estate
Thao Dang
Analyst
thao.dtp@vdsc.com.vn
+ 84 28 6299 2006 (1529)
• Food & Beverage
• Fishery
Tam Pham
Analyst
tam.ptt@vdsc.com.vn
+ 84 28 6299 2006 (1530)
• Banking
• Insurance
Anh Nguyen
Analyst
anh2.ntt@vdsc.com.vn
+ 84 28 6299 2006 (1531)
• Banking
Ha Tran
Assistant
ha.ttn@vdsc.com.vn
+ 84 28 6299 2006 (1526)
RONG VIET SECURITIES
CORPORATION
Floor 1-2-3-4, Viet Dragon Tower,
141 Nguyen Du St. - Dist 1 – HCMC
Tel: (84 28) 6299 2006
Fax: (84 28) 6291 7986
Email: info@vdsc.com.vn
Website: www.vdsc.com.vn
Hanoi Branch
2C Thai Phien St., Hai Ba Trung Dist,
Hanoi
Tel: (84 24) 6288 2006
Fax: (84 24) 6288 2008
Can Tho Branch
95-97-99 Vo Van Tan – Ninh
Kieu - Can Tho
Tel: (84 292) 381 7578
Fax: (84 292) 381 8387
Nha Trang Branch
50Bis Yersin St, Nha Trang
Tel: (84 258) 382 0006
Fax: (84 258) 382 0008
Rong Viet Securities Corporation – Investment Strategy Report July 2018 23
DISCLAIMERS
This report is prepared in order to provide information and analysis to clients of Rong Viet Securities only. It is and should not be construed as an offer to
sell or a solicitation of an offer to purchase any securities. No consideration has been given to the investment objectives, financial situation or particular
needs of any specific. The readers should be aware that Rong Viet Securities may have a conflict of interest that can compromise the objectivity this
research. This research is to be viewed by investors only as a source of reference when making investments. Investors are to take full responsibility of their
own decisions. VDSC shall not be liable for any loss, damages, cost or expense incurring or arising from the use or reliance, either full or partial, of the
information in this publication.
The opinions expressed in this research report reflect only the analyst's personal views of the subject securities or matters; and no part of the research
analyst's compensation was, is, or will be, directly or indirectly, related to the specific recommendations or opinions expressed in the report.
The information herein is compiled by or arrived at Rong Viet Securities from sources believed to be reliable. We, however, do not guarantee its accuracy
or completeness. Opinions, estimations and projections expressed in this report are deemed valid up to the date of publication of this report and can be
subject to change without notice.
This research report is copyrighted by Rong Viet Securities. All rights reserved. Therefore, copy, reproduction, republish or redistribution by any person
or party for any purpose is strictly prohibited without the written permission of VDSC. Copyright 2016 Viet Dragon Securities Corporation.
IMPORTANT DISCLOSURES FOR U.S. PERSONS
This research report was prepared by Viet Dragon Securities Corp. (“VDSC”), a company authorized to engage in securities activities in Vietnam. VDSC is
not a registered broker-dealer in the United States and, therefore, is not subject to U.S. rules regarding the preparation of research reports and the
independence of research analysts. This research report is provided for distribution to “major U.S. institutional investors” in reliance on the exemption
from registration provided by Rule 15a-6 of the U.S. Securities Exchange Act of 1934, as amended (the “Exchange Act”).
Additional Disclosures
This research report is for distribution only under such circumstances as may be permitted by applicable law. This research report has no regard to the
specific investment objectives, financial situation or particular needs of any specific recipient, even if sent only to a single recipient. This research report
is not guaranteed to be a complete statement or summary of any securities, markets, reports or developments referred to in this research report. Neither
VDSC nor any of its directors, officers, employees or agents shall have any liability, however arising, for any error, inaccuracy or incompleteness of fact or
opinion in this research report or lack of care in this research report’s preparation or publication, or any losses or damages which may arise from the use
of this research report.
VDSC may rely on information barriers, such as “Chinese Walls” to control the flow of information within the areas, units, divisions, groups, or affiliates of
VDSC.
Investing in any non-U.S. securities or related financial instruments (including ADRs) discussed in this research report may present certain risks. The
securities of non-U.S. issuers may not be registered with, or be subject to the regulations of, the U.S. Securities and Exchange Commission. Information
on such non-U.S. securities or related financial instruments may be limited. Foreign companies may not be subject to audit and reporting standards and
regulatory requirements comparable to those in effect within the United States.
The value of any investment or income from any securities or related financial instruments discussed in this research report denominated in a currency
other than U.S. dollars is subject to exchange rate fluctuations that may have a positive or adverse effect on the value of or income from such securities
or related financial instruments.
Past performance is not necessarily a guide to future performance and no representation or warranty, express or implied, is made by VDSC with respect
to future performance. Income from investments may fluctuate. The price or value of the investments to which this research report relates, either directly
or indirectly, may fall or rise against the interest of investors. Any recommendation or opinion contained in this research report may become outdated
as a consequence of changes in the environment in which the issuer of the securities under analysis operates, in addition to changes in the estimates and
forecasts, assumptions and valuation methodology used herein.
No part of the content of this research report may be copied, forwarded or duplicated in any form or by any means without the prior.

Weitere ähnliche Inhalte

Was ist angesagt?

Special report-27-feb-2019-epic-research
Special report-27-feb-2019-epic-researchSpecial report-27-feb-2019-epic-research
Special report-27-feb-2019-epic-researchEpic Research Limited
 
Special report-15-june-2018-epic-research
Special report-15-june-2018-epic-researchSpecial report-15-june-2018-epic-research
Special report-15-june-2018-epic-researchEpic Research Limited
 
Special report-12-feb-2019-epic-research
Special report-12-feb-2019-epic-researchSpecial report-12-feb-2019-epic-research
Special report-12-feb-2019-epic-researchEpic Research Limited
 
Weekly review 3 june 2016
Weekly review 3 june 2016Weekly review 3 june 2016
Weekly review 3 june 2016Charne Smith
 
Special report-28-august-2018-epic-research
Special report-28-august-2018-epic-researchSpecial report-28-august-2018-epic-research
Special report-28-august-2018-epic-researchEpic Research Limited
 
Angel Broking Strategy - April 2010
Angel Broking Strategy - April 2010Angel Broking Strategy - April 2010
Angel Broking Strategy - April 2010Angel Broking
 
Forex & comex daily report 1 june 16
Forex & comex daily report 1 june 16Forex & comex daily report 1 june 16
Forex & comex daily report 1 june 16vanessa semos
 
Special report-15-mar-2019-epic-research
Special report-15-mar-2019-epic-researchSpecial report-15-mar-2019-epic-research
Special report-15-mar-2019-epic-researchEpic Research Limited
 
IDX Capital Market Investment Outlook 2018 - Dr. Tito Sulistio
IDX Capital Market Investment Outlook 2018   - Dr.  Tito SulistioIDX Capital Market Investment Outlook 2018   - Dr.  Tito Sulistio
IDX Capital Market Investment Outlook 2018 - Dr. Tito SulistioBambang Muliyadi
 
Fundamental Analysis: Oil India, IDFC Limited - SMC
Fundamental Analysis: Oil India, IDFC Limited - SMCFundamental Analysis: Oil India, IDFC Limited - SMC
Fundamental Analysis: Oil India, IDFC Limited - SMCIndiaNotes.com
 
08 weekly saturday report
08 weekly saturday report08 weekly saturday report
08 weekly saturday reportstockquint
 
Choice Broking Research-UltraTech Cement.
 Choice Broking Research-UltraTech Cement. Choice Broking Research-UltraTech Cement.
Choice Broking Research-UltraTech Cement.choice broking
 
Special report-05-september-2018-epic-research
Special report-05-september-2018-epic-researchSpecial report-05-september-2018-epic-research
Special report-05-september-2018-epic-researchEpic Research Limited
 
asia pacific 2020, the economy military global stage
asia pacific 2020, the economy military global stageasia pacific 2020, the economy military global stage
asia pacific 2020, the economy military global stageTASNIM ILMIARDHI
 
Special report-15-feb-2019-epic-research
Special report-15-feb-2019-epic-researchSpecial report-15-feb-2019-epic-research
Special report-15-feb-2019-epic-researchEpic Research Limited
 
Special report-26-feb-2019-epic-research
Special report-26-feb-2019-epic-researchSpecial report-26-feb-2019-epic-research
Special report-26-feb-2019-epic-researchEpic Research Limited
 
Special report-01-june-2018-epic-research
Special report-01-june-2018-epic-researchSpecial report-01-june-2018-epic-research
Special report-01-june-2018-epic-researchEpic Research Limited
 
Weekly media update 20 08_2018
Weekly media update 20 08_2018Weekly media update 20 08_2018
Weekly media update 20 08_2018BalmerLawrie
 

Was ist angesagt? (20)

Special report-27-feb-2019-epic-research
Special report-27-feb-2019-epic-researchSpecial report-27-feb-2019-epic-research
Special report-27-feb-2019-epic-research
 
Special report-15-june-2018-epic-research
Special report-15-june-2018-epic-researchSpecial report-15-june-2018-epic-research
Special report-15-june-2018-epic-research
 
Special report-12-feb-2019-epic-research
Special report-12-feb-2019-epic-researchSpecial report-12-feb-2019-epic-research
Special report-12-feb-2019-epic-research
 
Weekly review 3 june 2016
Weekly review 3 june 2016Weekly review 3 june 2016
Weekly review 3 june 2016
 
Special report-28-august-2018-epic-research
Special report-28-august-2018-epic-researchSpecial report-28-august-2018-epic-research
Special report-28-august-2018-epic-research
 
Angel Broking Strategy - April 2010
Angel Broking Strategy - April 2010Angel Broking Strategy - April 2010
Angel Broking Strategy - April 2010
 
Forex & comex daily report 1 june 16
Forex & comex daily report 1 june 16Forex & comex daily report 1 june 16
Forex & comex daily report 1 june 16
 
Special report-15-mar-2019-epic-research
Special report-15-mar-2019-epic-researchSpecial report-15-mar-2019-epic-research
Special report-15-mar-2019-epic-research
 
IDX Capital Market Investment Outlook 2018 - Dr. Tito Sulistio
IDX Capital Market Investment Outlook 2018   - Dr.  Tito SulistioIDX Capital Market Investment Outlook 2018   - Dr.  Tito Sulistio
IDX Capital Market Investment Outlook 2018 - Dr. Tito Sulistio
 
Fundamental Analysis: Oil India, IDFC Limited - SMC
Fundamental Analysis: Oil India, IDFC Limited - SMCFundamental Analysis: Oil India, IDFC Limited - SMC
Fundamental Analysis: Oil India, IDFC Limited - SMC
 
Hanoi Quarterly Knowledge Report | Q2 2016
Hanoi Quarterly Knowledge Report | Q2 2016 Hanoi Quarterly Knowledge Report | Q2 2016
Hanoi Quarterly Knowledge Report | Q2 2016
 
08 weekly saturday report
08 weekly saturday report08 weekly saturday report
08 weekly saturday report
 
Choice Broking Research-UltraTech Cement.
 Choice Broking Research-UltraTech Cement. Choice Broking Research-UltraTech Cement.
Choice Broking Research-UltraTech Cement.
 
Special report-05-september-2018-epic-research
Special report-05-september-2018-epic-researchSpecial report-05-september-2018-epic-research
Special report-05-september-2018-epic-research
 
asia pacific 2020, the economy military global stage
asia pacific 2020, the economy military global stageasia pacific 2020, the economy military global stage
asia pacific 2020, the economy military global stage
 
Special report-15-feb-2019-epic-research
Special report-15-feb-2019-epic-researchSpecial report-15-feb-2019-epic-research
Special report-15-feb-2019-epic-research
 
Vietnam Quarterly Knowledge Report | Q4 2015
Vietnam Quarterly Knowledge Report | Q4 2015 Vietnam Quarterly Knowledge Report | Q4 2015
Vietnam Quarterly Knowledge Report | Q4 2015
 
Special report-26-feb-2019-epic-research
Special report-26-feb-2019-epic-researchSpecial report-26-feb-2019-epic-research
Special report-26-feb-2019-epic-research
 
Special report-01-june-2018-epic-research
Special report-01-june-2018-epic-researchSpecial report-01-june-2018-epic-research
Special report-01-june-2018-epic-research
 
Weekly media update 20 08_2018
Weekly media update 20 08_2018Weekly media update 20 08_2018
Weekly media update 20 08_2018
 

Ähnlich wie Rong Viet Securities - Investment Strategy July 2018

Why so idle wages and employment in a crowded labor market
Why so idle wages and employment in a crowded labor marketWhy so idle wages and employment in a crowded labor market
Why so idle wages and employment in a crowded labor marketNtalemu
 
Rong Viet Securities - Investment Strategy June 2018
Rong Viet Securities - Investment Strategy June 2018Rong Viet Securities - Investment Strategy June 2018
Rong Viet Securities - Investment Strategy June 2018Thomas Farthofer
 
Rong Viet Securities - Investment Strategy Report May 2017
Rong Viet Securities - Investment Strategy Report May 2017Rong Viet Securities - Investment Strategy Report May 2017
Rong Viet Securities - Investment Strategy Report May 2017Thomas Farthofer
 
MSFCap2016FP_Group6
MSFCap2016FP_Group6MSFCap2016FP_Group6
MSFCap2016FP_Group6Gavin Yeh
 
Vivek Tulpule Analyst Roundtable April 2010
Vivek Tulpule Analyst Roundtable April 2010Vivek Tulpule Analyst Roundtable April 2010
Vivek Tulpule Analyst Roundtable April 2010Rio Tinto plc
 
An overview of india japan trade relation today and tomorrow
An overview of india japan trade relation today and tomorrowAn overview of india japan trade relation today and tomorrow
An overview of india japan trade relation today and tomorrowmarketxceldata
 
Industrial Market Report 2019
Industrial Market Report 2019Industrial Market Report 2019
Industrial Market Report 2019TMS_Consultancy
 
Textile Industry in India v2.0
Textile Industry in India v2.0Textile Industry in India v2.0
Textile Industry in India v2.0Saqib Shakil
 
Economiic Analysis of IT and ITEs sector
Economiic Analysis of IT and ITEs sectorEconomiic Analysis of IT and ITEs sector
Economiic Analysis of IT and ITEs sectorVivaswan Pathak
 
N morocco profile
N morocco profileN morocco profile
N morocco profilemonendrak1
 
Paper on Inter-Asian Trade (delivered on 291009 in Bangkok, at the Thai Ports...
Paper on Inter-Asian Trade (delivered on 291009 in Bangkok, at the Thai Ports...Paper on Inter-Asian Trade (delivered on 291009 in Bangkok, at the Thai Ports...
Paper on Inter-Asian Trade (delivered on 291009 in Bangkok, at the Thai Ports...China Intelligence Online
 
U.S. Seafood Market. Analysis And Forecast to 2020
U.S. Seafood Market. Analysis And Forecast to 2020U.S. Seafood Market. Analysis And Forecast to 2020
U.S. Seafood Market. Analysis And Forecast to 2020IndexBox Marketing
 
U.S. Seafood Product Market. Analysis And Forecast to 2020
U.S. Seafood Product Market. Analysis And Forecast to 2020U.S. Seafood Product Market. Analysis And Forecast to 2020
U.S. Seafood Product Market. Analysis And Forecast to 2020IndexBox Marketing
 
Economic Analysis of Malaysia
Economic Analysis of MalaysiaEconomic Analysis of Malaysia
Economic Analysis of MalaysiaRahul Mandre
 

Ähnlich wie Rong Viet Securities - Investment Strategy July 2018 (20)

HCMC Quarterly Knowledge Report | Q4 2016
HCMC Quarterly Knowledge Report | Q4 2016 HCMC Quarterly Knowledge Report | Q4 2016
HCMC Quarterly Knowledge Report | Q4 2016
 
Hanoi Quarterly Knowledge Report | Q4 2015
Hanoi Quarterly Knowledge Report | Q4 2015 Hanoi Quarterly Knowledge Report | Q4 2015
Hanoi Quarterly Knowledge Report | Q4 2015
 
HCMC Quarterly Knowledge Report | Q3 2016
HCMC Quarterly Knowledge Report | Q3 2016 HCMC Quarterly Knowledge Report | Q3 2016
HCMC Quarterly Knowledge Report | Q3 2016
 
Hanoi Quarterly Knowledge Report | Q3 2016
Hanoi Quarterly Knowledge Report | Q3 2016 Hanoi Quarterly Knowledge Report | Q3 2016
Hanoi Quarterly Knowledge Report | Q3 2016
 
Why so idle wages and employment in a crowded labor market
Why so idle wages and employment in a crowded labor marketWhy so idle wages and employment in a crowded labor market
Why so idle wages and employment in a crowded labor market
 
Rong Viet Securities - Investment Strategy June 2018
Rong Viet Securities - Investment Strategy June 2018Rong Viet Securities - Investment Strategy June 2018
Rong Viet Securities - Investment Strategy June 2018
 
HCMC Quarterly Knowledge Report | Q4 2015
HCMC Quarterly Knowledge Report | Q4 2015 HCMC Quarterly Knowledge Report | Q4 2015
HCMC Quarterly Knowledge Report | Q4 2015
 
Rong Viet Securities - Investment Strategy Report May 2017
Rong Viet Securities - Investment Strategy Report May 2017Rong Viet Securities - Investment Strategy Report May 2017
Rong Viet Securities - Investment Strategy Report May 2017
 
MSFCap2016FP_Group6
MSFCap2016FP_Group6MSFCap2016FP_Group6
MSFCap2016FP_Group6
 
Vivek Tulpule Analyst Roundtable April 2010
Vivek Tulpule Analyst Roundtable April 2010Vivek Tulpule Analyst Roundtable April 2010
Vivek Tulpule Analyst Roundtable April 2010
 
An overview of india japan trade relation today and tomorrow
An overview of india japan trade relation today and tomorrowAn overview of india japan trade relation today and tomorrow
An overview of india japan trade relation today and tomorrow
 
Industrial Market Report 2019
Industrial Market Report 2019Industrial Market Report 2019
Industrial Market Report 2019
 
Textile Industry in India v2.0
Textile Industry in India v2.0Textile Industry in India v2.0
Textile Industry in India v2.0
 
Economiic Analysis of IT and ITEs sector
Economiic Analysis of IT and ITEs sectorEconomiic Analysis of IT and ITEs sector
Economiic Analysis of IT and ITEs sector
 
Hanoi Quarterly Knowledge Report | Q4 2016
Hanoi Quarterly Knowledge Report | Q4 2016 Hanoi Quarterly Knowledge Report | Q4 2016
Hanoi Quarterly Knowledge Report | Q4 2016
 
N morocco profile
N morocco profileN morocco profile
N morocco profile
 
Paper on Inter-Asian Trade (delivered on 291009 in Bangkok, at the Thai Ports...
Paper on Inter-Asian Trade (delivered on 291009 in Bangkok, at the Thai Ports...Paper on Inter-Asian Trade (delivered on 291009 in Bangkok, at the Thai Ports...
Paper on Inter-Asian Trade (delivered on 291009 in Bangkok, at the Thai Ports...
 
U.S. Seafood Market. Analysis And Forecast to 2020
U.S. Seafood Market. Analysis And Forecast to 2020U.S. Seafood Market. Analysis And Forecast to 2020
U.S. Seafood Market. Analysis And Forecast to 2020
 
U.S. Seafood Product Market. Analysis And Forecast to 2020
U.S. Seafood Product Market. Analysis And Forecast to 2020U.S. Seafood Product Market. Analysis And Forecast to 2020
U.S. Seafood Product Market. Analysis And Forecast to 2020
 
Economic Analysis of Malaysia
Economic Analysis of MalaysiaEconomic Analysis of Malaysia
Economic Analysis of Malaysia
 

Mehr von Thomas Farthofer

Rong Viet Securities - Investment Outlook 2019
Rong Viet Securities - Investment Outlook 2019Rong Viet Securities - Investment Outlook 2019
Rong Viet Securities - Investment Outlook 2019Thomas Farthofer
 
Rong Viet Securities - Investment Strategy May 2018
Rong Viet Securities - Investment Strategy May 2018Rong Viet Securities - Investment Strategy May 2018
Rong Viet Securities - Investment Strategy May 2018Thomas Farthofer
 
Rong Viet Securities - Investment Strategy April 2018
Rong Viet Securities - Investment Strategy April 2018Rong Viet Securities - Investment Strategy April 2018
Rong Viet Securities - Investment Strategy April 2018Thomas Farthofer
 
Rong Viet Securities - Investment Strategy Report Outlook 2018
Rong Viet Securities - Investment Strategy Report Outlook 2018Rong Viet Securities - Investment Strategy Report Outlook 2018
Rong Viet Securities - Investment Strategy Report Outlook 2018Thomas Farthofer
 
Rong Viet Securities - Investment Strategy Report November 2017
Rong Viet Securities - Investment Strategy Report November 2017Rong Viet Securities - Investment Strategy Report November 2017
Rong Viet Securities - Investment Strategy Report November 2017Thomas Farthofer
 
Rong Viet Securities - Investment Strategy Report October 2017
Rong Viet Securities - Investment Strategy Report October 2017Rong Viet Securities - Investment Strategy Report October 2017
Rong Viet Securities - Investment Strategy Report October 2017Thomas Farthofer
 
Rong Viet Securities - Investment Strategy Report September 2017
Rong Viet Securities - Investment Strategy Report September 2017Rong Viet Securities - Investment Strategy Report September 2017
Rong Viet Securities - Investment Strategy Report September 2017Thomas Farthofer
 
Rong Viet Securities - Investment Strategy Report August 2017
Rong Viet Securities - Investment Strategy Report August 2017Rong Viet Securities - Investment Strategy Report August 2017
Rong Viet Securities - Investment Strategy Report August 2017Thomas Farthofer
 
Rong Viet Securities - Investment Strategy Report July 2017
Rong Viet Securities - Investment Strategy Report July 2017Rong Viet Securities - Investment Strategy Report July 2017
Rong Viet Securities - Investment Strategy Report July 2017Thomas Farthofer
 
Rong Viet Securities - Investment Strategy Report June 2017
Rong Viet Securities - Investment Strategy Report June 2017Rong Viet Securities - Investment Strategy Report June 2017
Rong Viet Securities - Investment Strategy Report June 2017Thomas Farthofer
 
Rong Viet Securities - Investment Strategy Report April 2017
Rong Viet Securities - Investment Strategy Report April 2017Rong Viet Securities - Investment Strategy Report April 2017
Rong Viet Securities - Investment Strategy Report April 2017Thomas Farthofer
 
Rong Viet Securities - The odds favour the bold
Rong Viet Securities - The odds favour the boldRong Viet Securities - The odds favour the bold
Rong Viet Securities - The odds favour the boldThomas Farthofer
 
RongViet Securities - A First Look at 2017
RongViet Securities - A First Look at 2017RongViet Securities - A First Look at 2017
RongViet Securities - A First Look at 2017Thomas Farthofer
 

Mehr von Thomas Farthofer (13)

Rong Viet Securities - Investment Outlook 2019
Rong Viet Securities - Investment Outlook 2019Rong Viet Securities - Investment Outlook 2019
Rong Viet Securities - Investment Outlook 2019
 
Rong Viet Securities - Investment Strategy May 2018
Rong Viet Securities - Investment Strategy May 2018Rong Viet Securities - Investment Strategy May 2018
Rong Viet Securities - Investment Strategy May 2018
 
Rong Viet Securities - Investment Strategy April 2018
Rong Viet Securities - Investment Strategy April 2018Rong Viet Securities - Investment Strategy April 2018
Rong Viet Securities - Investment Strategy April 2018
 
Rong Viet Securities - Investment Strategy Report Outlook 2018
Rong Viet Securities - Investment Strategy Report Outlook 2018Rong Viet Securities - Investment Strategy Report Outlook 2018
Rong Viet Securities - Investment Strategy Report Outlook 2018
 
Rong Viet Securities - Investment Strategy Report November 2017
Rong Viet Securities - Investment Strategy Report November 2017Rong Viet Securities - Investment Strategy Report November 2017
Rong Viet Securities - Investment Strategy Report November 2017
 
Rong Viet Securities - Investment Strategy Report October 2017
Rong Viet Securities - Investment Strategy Report October 2017Rong Viet Securities - Investment Strategy Report October 2017
Rong Viet Securities - Investment Strategy Report October 2017
 
Rong Viet Securities - Investment Strategy Report September 2017
Rong Viet Securities - Investment Strategy Report September 2017Rong Viet Securities - Investment Strategy Report September 2017
Rong Viet Securities - Investment Strategy Report September 2017
 
Rong Viet Securities - Investment Strategy Report August 2017
Rong Viet Securities - Investment Strategy Report August 2017Rong Viet Securities - Investment Strategy Report August 2017
Rong Viet Securities - Investment Strategy Report August 2017
 
Rong Viet Securities - Investment Strategy Report July 2017
Rong Viet Securities - Investment Strategy Report July 2017Rong Viet Securities - Investment Strategy Report July 2017
Rong Viet Securities - Investment Strategy Report July 2017
 
Rong Viet Securities - Investment Strategy Report June 2017
Rong Viet Securities - Investment Strategy Report June 2017Rong Viet Securities - Investment Strategy Report June 2017
Rong Viet Securities - Investment Strategy Report June 2017
 
Rong Viet Securities - Investment Strategy Report April 2017
Rong Viet Securities - Investment Strategy Report April 2017Rong Viet Securities - Investment Strategy Report April 2017
Rong Viet Securities - Investment Strategy Report April 2017
 
Rong Viet Securities - The odds favour the bold
Rong Viet Securities - The odds favour the boldRong Viet Securities - The odds favour the bold
Rong Viet Securities - The odds favour the bold
 
RongViet Securities - A First Look at 2017
RongViet Securities - A First Look at 2017RongViet Securities - A First Look at 2017
RongViet Securities - A First Look at 2017
 

Kürzlich hochgeladen

Independent Call Girl Number in Kurla Mumbai📲 Pooja Nehwal 9892124323 💞 Full ...
Independent Call Girl Number in Kurla Mumbai📲 Pooja Nehwal 9892124323 💞 Full ...Independent Call Girl Number in Kurla Mumbai📲 Pooja Nehwal 9892124323 💞 Full ...
Independent Call Girl Number in Kurla Mumbai📲 Pooja Nehwal 9892124323 💞 Full ...Pooja Nehwal
 
CALL ON ➥8923113531 🔝Call Girls Gomti Nagar Lucknow best sexual service
CALL ON ➥8923113531 🔝Call Girls Gomti Nagar Lucknow best sexual serviceCALL ON ➥8923113531 🔝Call Girls Gomti Nagar Lucknow best sexual service
CALL ON ➥8923113531 🔝Call Girls Gomti Nagar Lucknow best sexual serviceanilsa9823
 
TEST BANK For Corporate Finance, 13th Edition By Stephen Ross, Randolph Weste...
TEST BANK For Corporate Finance, 13th Edition By Stephen Ross, Randolph Weste...TEST BANK For Corporate Finance, 13th Edition By Stephen Ross, Randolph Weste...
TEST BANK For Corporate Finance, 13th Edition By Stephen Ross, Randolph Weste...ssifa0344
 
00_Main ppt_MeetupDORA&CyberSecurity.pptx
00_Main ppt_MeetupDORA&CyberSecurity.pptx00_Main ppt_MeetupDORA&CyberSecurity.pptx
00_Main ppt_MeetupDORA&CyberSecurity.pptxFinTech Belgium
 
The Economic History of the U.S. Lecture 20.pdf
The Economic History of the U.S. Lecture 20.pdfThe Economic History of the U.S. Lecture 20.pdf
The Economic History of the U.S. Lecture 20.pdfGale Pooley
 
Solution Manual for Financial Accounting, 11th Edition by Robert Libby, Patri...
Solution Manual for Financial Accounting, 11th Edition by Robert Libby, Patri...Solution Manual for Financial Accounting, 11th Edition by Robert Libby, Patri...
Solution Manual for Financial Accounting, 11th Edition by Robert Libby, Patri...ssifa0344
 
The Economic History of the U.S. Lecture 21.pdf
The Economic History of the U.S. Lecture 21.pdfThe Economic History of the U.S. Lecture 21.pdf
The Economic History of the U.S. Lecture 21.pdfGale Pooley
 
(DIYA) Bhumkar Chowk Call Girls Just Call 7001035870 [ Cash on Delivery ] Pun...
(DIYA) Bhumkar Chowk Call Girls Just Call 7001035870 [ Cash on Delivery ] Pun...(DIYA) Bhumkar Chowk Call Girls Just Call 7001035870 [ Cash on Delivery ] Pun...
(DIYA) Bhumkar Chowk Call Girls Just Call 7001035870 [ Cash on Delivery ] Pun...ranjana rawat
 
06_Joeri Van Speybroek_Dell_MeetupDora&Cybersecurity.pdf
06_Joeri Van Speybroek_Dell_MeetupDora&Cybersecurity.pdf06_Joeri Van Speybroek_Dell_MeetupDora&Cybersecurity.pdf
06_Joeri Van Speybroek_Dell_MeetupDora&Cybersecurity.pdfFinTech Belgium
 
Booking open Available Pune Call Girls Shivane 6297143586 Call Hot Indian Gi...
Booking open Available Pune Call Girls Shivane  6297143586 Call Hot Indian Gi...Booking open Available Pune Call Girls Shivane  6297143586 Call Hot Indian Gi...
Booking open Available Pune Call Girls Shivane 6297143586 Call Hot Indian Gi...Call Girls in Nagpur High Profile
 
Pooja 9892124323 : Call Girl in Juhu Escorts Service Free Home Delivery
Pooja 9892124323 : Call Girl in Juhu Escorts Service Free Home DeliveryPooja 9892124323 : Call Girl in Juhu Escorts Service Free Home Delivery
Pooja 9892124323 : Call Girl in Juhu Escorts Service Free Home DeliveryPooja Nehwal
 
Indore Real Estate Market Trends Report.pdf
Indore Real Estate Market Trends Report.pdfIndore Real Estate Market Trends Report.pdf
Indore Real Estate Market Trends Report.pdfSaviRakhecha1
 
Basic concepts related to Financial modelling
Basic concepts related to Financial modellingBasic concepts related to Financial modelling
Basic concepts related to Financial modellingbaijup5
 
WhatsApp 📞 Call : 9892124323 ✅Call Girls In Chembur ( Mumbai ) secure service
WhatsApp 📞 Call : 9892124323  ✅Call Girls In Chembur ( Mumbai ) secure serviceWhatsApp 📞 Call : 9892124323  ✅Call Girls In Chembur ( Mumbai ) secure service
WhatsApp 📞 Call : 9892124323 ✅Call Girls In Chembur ( Mumbai ) secure servicePooja Nehwal
 
Stock Market Brief Deck (Under Pressure).pdf
Stock Market Brief Deck (Under Pressure).pdfStock Market Brief Deck (Under Pressure).pdf
Stock Market Brief Deck (Under Pressure).pdfMichael Silva
 
Call US 📞 9892124323 ✅ Kurla Call Girls In Kurla ( Mumbai ) secure service
Call US 📞 9892124323 ✅ Kurla Call Girls In Kurla ( Mumbai ) secure serviceCall US 📞 9892124323 ✅ Kurla Call Girls In Kurla ( Mumbai ) secure service
Call US 📞 9892124323 ✅ Kurla Call Girls In Kurla ( Mumbai ) secure servicePooja Nehwal
 
The Economic History of the U.S. Lecture 18.pdf
The Economic History of the U.S. Lecture 18.pdfThe Economic History of the U.S. Lecture 18.pdf
The Economic History of the U.S. Lecture 18.pdfGale Pooley
 
(ANIKA) Budhwar Peth Call Girls Just Call 7001035870 [ Cash on Delivery ] Pun...
(ANIKA) Budhwar Peth Call Girls Just Call 7001035870 [ Cash on Delivery ] Pun...(ANIKA) Budhwar Peth Call Girls Just Call 7001035870 [ Cash on Delivery ] Pun...
(ANIKA) Budhwar Peth Call Girls Just Call 7001035870 [ Cash on Delivery ] Pun...ranjana rawat
 

Kürzlich hochgeladen (20)

Independent Call Girl Number in Kurla Mumbai📲 Pooja Nehwal 9892124323 💞 Full ...
Independent Call Girl Number in Kurla Mumbai📲 Pooja Nehwal 9892124323 💞 Full ...Independent Call Girl Number in Kurla Mumbai📲 Pooja Nehwal 9892124323 💞 Full ...
Independent Call Girl Number in Kurla Mumbai📲 Pooja Nehwal 9892124323 💞 Full ...
 
CALL ON ➥8923113531 🔝Call Girls Gomti Nagar Lucknow best sexual service
CALL ON ➥8923113531 🔝Call Girls Gomti Nagar Lucknow best sexual serviceCALL ON ➥8923113531 🔝Call Girls Gomti Nagar Lucknow best sexual service
CALL ON ➥8923113531 🔝Call Girls Gomti Nagar Lucknow best sexual service
 
TEST BANK For Corporate Finance, 13th Edition By Stephen Ross, Randolph Weste...
TEST BANK For Corporate Finance, 13th Edition By Stephen Ross, Randolph Weste...TEST BANK For Corporate Finance, 13th Edition By Stephen Ross, Randolph Weste...
TEST BANK For Corporate Finance, 13th Edition By Stephen Ross, Randolph Weste...
 
00_Main ppt_MeetupDORA&CyberSecurity.pptx
00_Main ppt_MeetupDORA&CyberSecurity.pptx00_Main ppt_MeetupDORA&CyberSecurity.pptx
00_Main ppt_MeetupDORA&CyberSecurity.pptx
 
The Economic History of the U.S. Lecture 20.pdf
The Economic History of the U.S. Lecture 20.pdfThe Economic History of the U.S. Lecture 20.pdf
The Economic History of the U.S. Lecture 20.pdf
 
Solution Manual for Financial Accounting, 11th Edition by Robert Libby, Patri...
Solution Manual for Financial Accounting, 11th Edition by Robert Libby, Patri...Solution Manual for Financial Accounting, 11th Edition by Robert Libby, Patri...
Solution Manual for Financial Accounting, 11th Edition by Robert Libby, Patri...
 
VIP Independent Call Girls in Bandra West 🌹 9920725232 ( Call Me ) Mumbai Esc...
VIP Independent Call Girls in Bandra West 🌹 9920725232 ( Call Me ) Mumbai Esc...VIP Independent Call Girls in Bandra West 🌹 9920725232 ( Call Me ) Mumbai Esc...
VIP Independent Call Girls in Bandra West 🌹 9920725232 ( Call Me ) Mumbai Esc...
 
The Economic History of the U.S. Lecture 21.pdf
The Economic History of the U.S. Lecture 21.pdfThe Economic History of the U.S. Lecture 21.pdf
The Economic History of the U.S. Lecture 21.pdf
 
(DIYA) Bhumkar Chowk Call Girls Just Call 7001035870 [ Cash on Delivery ] Pun...
(DIYA) Bhumkar Chowk Call Girls Just Call 7001035870 [ Cash on Delivery ] Pun...(DIYA) Bhumkar Chowk Call Girls Just Call 7001035870 [ Cash on Delivery ] Pun...
(DIYA) Bhumkar Chowk Call Girls Just Call 7001035870 [ Cash on Delivery ] Pun...
 
06_Joeri Van Speybroek_Dell_MeetupDora&Cybersecurity.pdf
06_Joeri Van Speybroek_Dell_MeetupDora&Cybersecurity.pdf06_Joeri Van Speybroek_Dell_MeetupDora&Cybersecurity.pdf
06_Joeri Van Speybroek_Dell_MeetupDora&Cybersecurity.pdf
 
Booking open Available Pune Call Girls Shivane 6297143586 Call Hot Indian Gi...
Booking open Available Pune Call Girls Shivane  6297143586 Call Hot Indian Gi...Booking open Available Pune Call Girls Shivane  6297143586 Call Hot Indian Gi...
Booking open Available Pune Call Girls Shivane 6297143586 Call Hot Indian Gi...
 
Pooja 9892124323 : Call Girl in Juhu Escorts Service Free Home Delivery
Pooja 9892124323 : Call Girl in Juhu Escorts Service Free Home DeliveryPooja 9892124323 : Call Girl in Juhu Escorts Service Free Home Delivery
Pooja 9892124323 : Call Girl in Juhu Escorts Service Free Home Delivery
 
Indore Real Estate Market Trends Report.pdf
Indore Real Estate Market Trends Report.pdfIndore Real Estate Market Trends Report.pdf
Indore Real Estate Market Trends Report.pdf
 
Basic concepts related to Financial modelling
Basic concepts related to Financial modellingBasic concepts related to Financial modelling
Basic concepts related to Financial modelling
 
WhatsApp 📞 Call : 9892124323 ✅Call Girls In Chembur ( Mumbai ) secure service
WhatsApp 📞 Call : 9892124323  ✅Call Girls In Chembur ( Mumbai ) secure serviceWhatsApp 📞 Call : 9892124323  ✅Call Girls In Chembur ( Mumbai ) secure service
WhatsApp 📞 Call : 9892124323 ✅Call Girls In Chembur ( Mumbai ) secure service
 
Stock Market Brief Deck (Under Pressure).pdf
Stock Market Brief Deck (Under Pressure).pdfStock Market Brief Deck (Under Pressure).pdf
Stock Market Brief Deck (Under Pressure).pdf
 
Call US 📞 9892124323 ✅ Kurla Call Girls In Kurla ( Mumbai ) secure service
Call US 📞 9892124323 ✅ Kurla Call Girls In Kurla ( Mumbai ) secure serviceCall US 📞 9892124323 ✅ Kurla Call Girls In Kurla ( Mumbai ) secure service
Call US 📞 9892124323 ✅ Kurla Call Girls In Kurla ( Mumbai ) secure service
 
VIP Independent Call Girls in Andheri 🌹 9920725232 ( Call Me ) Mumbai Escorts...
VIP Independent Call Girls in Andheri 🌹 9920725232 ( Call Me ) Mumbai Escorts...VIP Independent Call Girls in Andheri 🌹 9920725232 ( Call Me ) Mumbai Escorts...
VIP Independent Call Girls in Andheri 🌹 9920725232 ( Call Me ) Mumbai Escorts...
 
The Economic History of the U.S. Lecture 18.pdf
The Economic History of the U.S. Lecture 18.pdfThe Economic History of the U.S. Lecture 18.pdf
The Economic History of the U.S. Lecture 18.pdf
 
(ANIKA) Budhwar Peth Call Girls Just Call 7001035870 [ Cash on Delivery ] Pun...
(ANIKA) Budhwar Peth Call Girls Just Call 7001035870 [ Cash on Delivery ] Pun...(ANIKA) Budhwar Peth Call Girls Just Call 7001035870 [ Cash on Delivery ] Pun...
(ANIKA) Budhwar Peth Call Girls Just Call 7001035870 [ Cash on Delivery ] Pun...
 

Rong Viet Securities - Investment Strategy July 2018

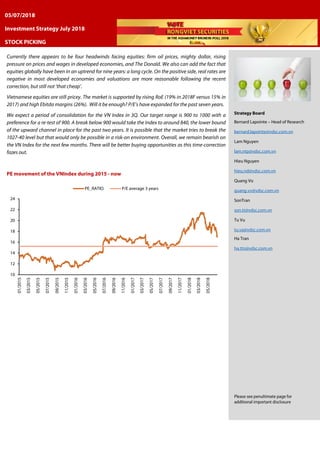
  • 1. Currently there appears to be four headwinds facing equities: firm oil prices, mighty dollar, rising pressure on prices and wages in developed economies, and The Donald. We also can add the fact that equities globally have been in an uptrend for nine years: a long cycle. On the positive side, real rates are negative in most developed economies and valuations are more reasonable following the recent correction, but still not ‘that cheap’. Vietnamese equities are still pricey. The market is supported by rising RoE (19% in 2018F versus 15% in 2017) and high Ebitda margins (26%). Will it be enough? P/E’s have expanded for the past seven years. We expect a period of consolidation for the VN Index in 3Q. Our target range is 900 to 1000 with a preference for a re-test of 900. A break below 900 would take the Index to around 840, the lower bound of the upward channel in place for the past two years. It is possible that the market tries to break the 1027-40 level but that would only be possible in a risk-on environment. Overall, we remain bearish on the VN Index for the next few months. There will be better buying opportunities as this time-correction fazes out. PE movement of the VNIndex during 2015 - now Strategy Board Bernard Lapointe – Head of Research bernard.lapointe@vdsc.com.vn Lam Nguyen lam.ntp@vdsc.com.vn Hieu Nguyen hieu.nd@vdsc.com.vn Quang Vo quang.vv@vdsc.com.vn SonTran son.tt@vdsc.com.vn Tu Vu tu.va@vdsc.com.vn Ha Tran ha.ttn@vdsc.com.vn Please see penultimate page for additional important disclosure 10 12 14 16 18 20 22 24 01/2015 03/2015 05/2015 07/2015 09/2015 11/2015 01/2016 03/2016 05/2016 07/2016 09/2016 11/2016 01/2017 03/2017 05/2017 07/2017 09/2017 11/2017 01/2018 03/2018 05/2018 PE_RATIO P/E average 3 years 05/07/2018 Investment Strategy July 2018 STOCK PICKING
  • 2. Rong Viet Securities Corporation – Investment Strategy Report July 2018 2 CONTENTS VIETNAM MACRO ...................................................................................................................................................................................................................................3  Highest GDP growth for the first six months since 2011 ...........................................................................................................................3  FDI flow into manufacturing sector slow down............................................................................................................................................6  Monetary policy adjusting to market movements.......................................................................................................................................7 VIETNAM’S STOCK MARKET IN JUNE: ANOTHER GLOOMY MONTH ...................................................................................................................................8 QUARTER 3 STOCK MARKET OUTLOOK .......................................................................................................................................................................................11 INVESTMENT STRATEGY AND IDEAS: STOCK PICKING...........................................................................................................................................................16 Despite rising external risks caused in part by the US – China trade war, Vietnam’s economy showed its best performance since 2011 in the first six months of 2018. In the stock market, VNIndex’s PE decreased to around 16x, equivalent to that of mid-2017 after more than three consecutive months of a deep price correction. Meanwhile, the market’s NPAT growth was 24% YoY in Q1 2018, implying a less-than-1 PEG ratio. However, Vietnam’s stock market still faces more risks from external factors (FED rates hike, trade war, Renminbi depreciation) which can put more pressure on a potential devaluation of the Dong and outflows of “fast money” (from hedge funds). Although we believe that the SBV’s resources are strong enough to control FX fluctuations within its target range, we think monetary policy will be tighter in the second half of 2018, implying less liquidity for risky sectors like the stock market and real estate. For these reasons, along with oncoming business earnings results, we think that good buying opportunities will occur while the market drops a bit more. However, an uptrend trend will not come within all stocks/sectors. Smart money will carefully choose companies with good business results and not be invested across the board. For this month, we would like to introduce our two picks, NLG and FPT. Finally, Rong Viet’s Research Department unveils its portfolio made up of Vietnamese stocks under coverage. This is a long-only absolutereturn portfolio. See page 17 of this report. HIGHLIGHT STOCKS.............................................................................................................................................................................................................................18 Analysis of 54 stocks of RongViet Research, discussion with companies and specific evaluation in the “Company Report” or “Analyst Pinboard”
  • 3. Rong Viet Securities Corporation – Investment Strategy Report July 2018 3 VIETNAM MACRO • Highest GDP growth in the first six months of the year since 2011 • Foreign direct investment in the manufacturing sector slowed down • Tighter monetary policy Highest GDP growth for the first six months since 2011 According to GSO’s newly published data, Vietnam’s economy grew at an annual pace of 6.8% in the second quarter. In 1H2018, GDP growth reached 7.1%, a level not seen since 2011. The agriculture, forestry and fishery sectors recovered and rose by 3.9% YoY while the growth rate of the manufacturing/ construction and service sectors was 9.1% YoY and 7.0% YoY, respectively. Three highlights: • Agriculture, forestry and fishery, a buffer for the economy, has been strongly recovering as export turnover rose. Exports to China picked up substantially (+ 36% y/y in 2017) as the negative impact of environmental problems faded out. • The manufacturing sector is at a turning point as Vietnamese conglomerates are investing while FDI by large-scale companies is holding well. • High consumer confidence has been supportive for the economy, one of the fastest growing in the world. Figure 1: Contribution to GDP Growth, 1H 2018 (% YoY) Source: GSO, RongViet Securities The recovery of the agriculture, forestry and fishery sectors, a buffer for the economy, is worth noting. Agriculture grew by 3.3% YoY, contributing 0.45 percentage to the general growth while the fishery sector grew by 6.4% YoY, an eight-year high. Export revenues of key goods, including fish, fruits and rice, rose and stood at USD 3.2 Billion; USD 1.7 Billion and USD 1.5 Billion in the first five months of 2018. Notably, rice export turnover climbed by 40% YoY due to better prices and wining auctions in Indonesia, Philippines. -2% 0% 2% 4% 6% 8% 2011 2012 2013 2014 2015 2016 2017 2018 Agriculture Manufacturing Services Tax and subsides
  • 4. Rong Viet Securities Corporation – Investment Strategy Report July 2018 4 Figure 2: Agriculture’s 1H growth (% YoY) Figure 3: Export turnover of agriculture goods (Bn USD) Source: GSO, RongViet Securities Source: Customs, RongViet Securities Meanwhile, the core of Vietnam’s economy, the industrial sector, grew by 9.3% YoY in the first half, better than the 7.0% YoY and 5.4% YoY in 2016 and 2017. Manufacturing still made the biggest contribution to the sector and surged 13.0% YoY, a seven year high. Meanwhile, the consumption index rose 11.9% YoY, higher than the growth of 8.4% YoY in 1H2017. The manufacturers of steel, motor vehicles, petroleum products, pharmaceutical, beverages, textiles and clothes performed well versus a year ago. We emphasize that some of these sectors benefited from tariff barriers put up by the government in 2018 against imported goods. Stronger demand and improved business conditions explained why Vietnam’s PMI manufacturing rose to 55.7 points in June from 53.9 in May. The Nikkei survey showed an acceleration of output and new orders, which resulted in fast job creation. We assess that Vietnam’s manufacturing industry is in a changing phase and its momentum will be strong in the next two years. In addition to the important role of FDI, domestic conglomerates have been investing in manufacturing to replace imported products. For example, Nghi Son and Dung Quat refineries will supply 60% of domestic demand of gasoline and petroleum. The Hoa Phat Dung Quat steel complex’s first and second phases will start operating in January and August of 2019, creating a huge supply of higher-level steel, besides Formosa’s products. The well-known project, Vinfast, is likely to launch its first product at the end of 2018. Figure 4: Industrial production index (% YoY) Figure 5: ASEAN manufacturing PMI Source: GSO, RongViet Securities Source: Nikkei, RongViet Securities -1% 0% 1% 2% 3% 4% 5% 2011 2012 2013 2014 2015 2016 2017 2018 0 1 2 3 4 5M2018 5M2017 5M2016 Fish Fruit Rice 100 104 108 112 116 2014 2015 2016 2017 2018 Industrial Production Manufacturing 45 47 49 51 53 55 57 04/2018 05/2018 06/2018 Vietnam Thailand Singapore Philippines Myanmar Malaysia Indonesia
  • 5. Rong Viet Securities Corporation – Investment Strategy Report July 2018 5 Figure 6: Industry consumption index Figure 7: Other sectors’ consumption indices Source: GSO, RongViet Securities Source: Nikkei, RongViet Securities Vietnam’s economy will keep expanding in 2019-2020 thanks to the strategy of focusing on the domestic market. Currently, consumer consumption accounts for over 60% of GDP. In 1H2018, wholesale and retail sales increased by 8.2% YoY and became the fastest growing services sector. More and more bankers and insurers focus on the retail segment while mortgage loans support the growth of property developers. According to a survey by Nielsen, Vietnamese consumers are growing more and more confident about their future income. After saving for the long term, Vietnam’s residents are willing to buy premium healthcare insurance packages, repairing houses and traveling. Figure 8: Consumer confidence index Source: GSO, RongViet Securities Our view The economy is experimenting with two fairly new elements; 1) the development of non-state sectors and 2) higher and higher consumer confidence. The privatization of SoE’s has been pushing up the percentage of private investment capital which accounts for over 41% of total investment in 1H2018, an all-time high. Vietnamese conglomerates are willing to invest in the manufacturing sector whose products are to be substitute for imported goods. Most of these projects are at a “building phase”, therefore will have an impact for many years. Meanwhile, there is a gap to fulfill the aggregate demand as the Vietnamese’s income and consumer confidence brightens. Under these circumstances, we are confident that 2H2018 GDP growth could be around 6.6% - 6.9% YoY. -10% -5% 0% 5% 10% 15% 20% 25% 1H2013 1H2014 1H2015 1H2016 1H2017 1H2018 Other non-metallic mineral products Basic metals Prefabricated metal products Industry Consumption 0% 4% 8% 12% 16% 1H2013 1H2014 1H2015 1H2016 1H2017 1H2018 Beverages Textiles Clothes 80 90 100 110 120 130 140 Philippines Indonesia Vietnam Thailand Singapore Malaysia SEA* Q2 2017 Q3 2017 Q4 2017 Q1 2018
  • 6. Rong Viet Securities Corporation – Investment Strategy Report July 2018 6 Figure 9: Realized social investment capital (% of total investment) Source: GSO, RongViet Securities FDI flow into manufacturing sector slow down The economy’s prospect will be affected by global changes. In our special report of the impact of US trade policies and warning point for KORUS FTA’s negotiations, we are concerned about lower- than-expected FDI in upcoming years. In 1H2018, there were signals of a slow-down of growth of foreign direct investment in the manufacturing sector as the total of newly registered capital and additional capital flows dropped nearly by 20% YoY. During the past four years, such investment significantly depended on South Korean Chaebols, including Samsung and LG. However, there are lesser big-scale manufacturing projects. Instead, Vietnam recorded billion-dollar projects in power generation and real estate. From our point of view, one of the most important momentum of FDI inflow into Vietnam is “efficiency-seeking investment” to take advantage of low manufacturing costs. Therefore, changes in the global trade picture caused by populism around the world is likely to make some people reconsider their investment plans in Vietnam. Better ASEAN integration, effectively exploiting Chinese market and urgently signing the EU-Vietnam FTA should be a priority for lawmakers. Figure 10: FDI (Billion USD) Source: GSO, RongViet Securities 0% 10% 20% 30% 40% 50% 1H2008 1H2013 1H2018 State capital Private capital Foreign capital 0 2 4 6 8 10 12 14 16 18 1H2014 1H2015 1H2016 1H2017 1H2018 Manufacturing Construction and Real estate Scientific activities Electricity and gas production Wholesale and retail trade Mining and quarrying Others
  • 7. Rong Viet Securities Corporation – Investment Strategy Report July 2018 7 Monetary policy adjusting to market movements Up to the middle of June 2018, total outstanding liquidity (M2) and deposit increased 8% YTD and 7.8% YTD, higher than those of 5.7% YTD and 5.9% YTD from the similar period in 2017. The surging growth of M2 is obviously to absorb large foreign indirect investment. However, the year-to-date growth of credit was just 6.4% in compared with 2017’s 7.5%. The gap between M2 growth and credit growth implies abundant liquidity, which keeps the VND overnight interest rate very low. Interest rates differentials between USD and VND overnight rates keeps pressure on the Dong/ USD exchange rate. The negative gap between VND and USD overnight interest rates has encouraged FX participants to keep buying dollars. Such a response can result in speculation and pressure on FX rates. Figure 11: Indicators of monetary policy Figure 12: Overnight interest rate Source: SBV, RongViet Securities Source: SBV, RongViet Securities There is no doubt that the monetary policy operations of the State Bank of Vietnam (SBV) has improved over the past ten years. During the past two months, we strongly think that SBV’s was aggressive to withdraw money via T-Bill issuances. There were lots of failed auctions during the first half of June which might explain the increase in T-Bills’ interest rates and the appearance of T- Bill’s of 91-day maturity. Recently, SBV’s governor, Mr. Nguyen Minh Hung, has spoken of Vietnam’s FX reserve of USD 63.5 Billion to calm down investors’ worries about the VND’s depreciation. In our point of view, the Dong is overvalued by 4-6% and the Yuan’s current depreciation against the greenback will put pressure on Vietnamese lawmakers. Figure 13: OMO market (Billion VND) Source: SBV, RongViet Securities 8.0% 6.4% 7.8% 0% 2% 4% 6% 8% 10% 1H2014 1H2015 1H2016 1H2017 1H2018 M2 growth Credit growth Deposit growth 0% 1% 2% 3% 4% 5% 01/2017 05/2017 09/2017 01/2018 05/2018 VND Overnight Interest Rate USD Overnight Interest Rate -300,000 -200,000 -100,000 0 100,000 200,000 300,000 06/12 06/13 06/14 06/15 06/16 06/17 06/18 Reverse repo Notes Net flow
  • 8. Rong Viet Securities Corporation – Investment Strategy Report July 2018 8 VIETNAM’S STOCK MARKET IN JUNE: ANOTHER GLOOMY MONTH The uptrend only lasted for the first week of June; after that, sellers took control. The HNXIndex fell by 6.8%, which worsened due to poor performances of ACB (-11.0%), VCS (-17.1%) and VGC (- 10.8%). The VNIndex, supported from VIC (+12.1%), VCB (+7.2%) and VNM (+4.4%), saw a less severe outcome with a loss of only 1.4%. Figure 14: VNIndex movement in June Figure 15: HNXIndex movement in June Source: RongViet Securities Source: RongViet Securities Hot listed stocks in June are TCB (a leader in bancassurance and corporate bond issuance) and YEG (the first local entertainment company to list on the stock market). Their appearances could not help to improve investors’ sentiment. The trend of liquidity declining on the underlying markets and surging on the futures ones has been still valid. Figure 16: Matching trading value on the HSX and the futures market (Bn VND) Source: FiinPro, RongViet Securities (*) Real cash with assumption of 30% leverage MSCI’s 2018 reclassification result: not surprising Vietnam has yet to qualify for the MSCI’s Review list from Frontier Market to Emerging Market. MSCI will reclassify the MSCI Argentina Index to Emerging Markets status and consult on the potential reclassification of the MSCI Kuwait Index to Emerging Markets status. 900 950 1,000 1,050 1,100 1,150 1,200 1,250 0 50 100 150 200 250 300 28/03 11/04 26/04 14/05 28/05 11/06 25/06 Trading Volume (mil. shares) VNINdex (right axis) 104 108 112 116 120 124 128 132 136 140 0 10 20 30 40 50 60 70 80 28/03 11/04 26/04 14/05 28/05 11/06 25/06 Trading Volume (mil. shares) HNXIndex (right axis) - 4,000 8,000 12,000 16,000 01/18 02/18 03/18 04/18 05/18 06/18 HSX Futures(*)
  • 9. Rong Viet Securities Corporation – Investment Strategy Report July 2018 9 Figure 17: MSCI’s reclassification process Vietnam has completely met all the quantitative criteria, but the qualitative criteria is still a challenge. • Kuwait: only 5/17 criteria that “need improvement”. • Vietnam: 9 criteria that “need improvement”: foreign ownership limit level, foreign room level, equal rights to foreign investors, foreign exchange market liberalization level, information flow, clearing and settlement, transferability, stock lending and short selling. • In the 2015-2018 period, Vietnam only made one improvement on “investor registration & account set up”. Vietnam still has a long way to go. On the positive side, Vietnam stocks’ weights in the MSCI Frontier Markets 100 Index will increase from 17.4% to 21.5% (or 27.5% if Kuwait is reclassified to emerging market). Number of Vietnam stocks thereby will increase from 17 to 30. For now, there is only one considerable fund that is tracking the MSCI Frontier Market: Blackrock’s iShares MSCI Frontier 100 ETF, with a NAV of USD 565 Mn. Accordingly, even if Vietnam’s weight increased to 27.5%, MSCI Frontier tracking funds would just allocate another (27.5% - 17.4%) x 565 = USD 57 Mn into Vietnam, not a significant amount. Price down, how about earnings? The Index declined has led to the concern about the sustainability of corporate earnigns. In our last month’s strategy report, we have noted that financial sector (banks, real estate, and brokerages) has contributed a large amount to the earnings growth of the market. Excluding that sector, we arrive at a NPAT growth of 10% in Q1 for non-financial sector. It was neither great nor terrible, but promise to be higher in the remaining of the year. Figure 18: Revenue and NPAT growth in Q1 2018 by sectors Source: RongViet Securities Year 1: Adding the market to the review list Year 2: Consulting on the potential reclassification and giving one year of testing period Year 3: Announcement of reclassification Year 4: Official reclassification 14% 20% 10% 24% -50% -40% -30% -20% -10% 0% 10% 20% 30% 40% 50% Technology Industrial Oil&Gas ConsumerServices HealthCare ConsumerGoods BasicMaterial Utilities Marketwithout financialsectors Marketwith financialsectors Revenue growth NPAT growth
  • 10. Rong Viet Securities Corporation – Investment Strategy Report July 2018 10 Foreign investors trading Figure 19: Net trading value of Foreign Investors Source: FiinPro, RongViet Securities Foreign investors net sold VND 140 bn on both exchanges in June, however if we exclude YEG (Yeah1)’s put-through transaction of VND 2,400 bn, they would have net sold over VND 2,500 bn. Noticeably, foreign investors were selling more relentlessly in the correction period, which was after the strong recovery in early June. While the VNIndex lost nearly 8% in value, foreign investors also net sold up to VND 2,100 bn, accounting for most of the net-sold value in the month. Accumulating since the beginning of this year, foreign investors have net bought VND 34,668 bn on both exchanges. The last 6 months also witnessed some huge put-through deals of NVL (VND 3,400 bn), VHM (VND 30,000 bn) and YEG (VND 2,300 bn). Second quarter exclusively, on the HOSE, foreign investors net bought VND 35,930 in put-through value but only focused on several big deals, while net sold VND 11,348 through order-matching method. This had a significant impact on the market’s negative sentiment recently. Table 1: Foreign investor’s net trading by sector in both exchanges Sector HSX HNX Net volume (thousand shares) Net value (VND Bn) Net volume (thousand shares) Net value (VND Bn) Oil & Gas -1,891 21 4,547 76 Chemicals -960 -19 -1,065 -17 Basic resources -16,622 -401 -244 0 Construction and building materials 1,154 413 -10,425 -376 Industrial goods & services -324 15 527 17 Automobile & parts -1,991 -40 6 0 Food & beverage -30,139 92 -422 -7 Personal & household goods 172 3 -91 -1 Healthcare -613 -48 -59 -2 Retail 677 58 1 0 Communication 8,044 2,415 -358 -8 Travel & leisure -725 97 -86 -2 Utilities -2,177 -74 34 -0 Bank -79 298 -901 -8 Insurance -70 17 -7 -0 Real estate -30,666 -2,479 -1,879 -22 Financial services -17,357 -165 753 11 Technology -114 -2 -29 -0 Source: FiinPro, RongViet Securities 0 5,000 10,000 15,000 20,000 25,000 30,000 35,000 40,000 45,000 -5,000 0 5,000 10,000 15,000 20,000 25,000 30,000 02/01 20/03 01/06 Net bought/sold (LHS, VND Bn) Accumulated Value (RHS, VND Bn)
  • 11. Rong Viet Securities Corporation – Investment Strategy Report July 2018 11 QUARTER 3 STOCK MARKET OUTLOOK • Markets should get used to a new, hostile normal • Currencies have been in the limelight recently because of the potential ‘trade war(s)’ • There will be better buying opportunities as this time-correction fazes out. Markets should get used to a new, hostile normal The supreme art of war is to subdue the enemy without fighting - Sun Tzu Over the past 20 years, the world has been through one of the greatest asset inflation story of modern times. One could argue that it begun way back in the 1980s when US bond yields went from double digits to close to below two percent in the mid 2010s. The psychological implications have been enormous, affecting the behavior of not only financial markets investors but ‘ordinary’ people. Free money claimed some. Where are we going now? Stagflation? Is the current bull run over? Let us just start by unequivocally rejecting, for now, the probability that the world is entering a period of stagflation. Global GDP growth for 2018-2019 will stay robust and even though some prices are rising due to supply constraints and tariffs, we are not seeing global inflation being a major impediment at this point. Watch this space as things could change quickly if a full blown out trade war arises. Tail risks are rising and the literature suggests that a major global trade confrontation would likely push the US in a recession and the rest of the world to the brink of a recession. The larger global risk, apart from the rhetoric about trade war (s), is clearly the possibility that yield curves may invert. In other words short-term rates moving higher than long-term ones. The spread between 10-year and 2-year yields on US bonds has been narrowing for some time and now stands at just 35 basis points compared to 200 bps five-years ago. Historically, inversions precede recessions and are not a great backdrop for bank stocks. Figure 20: US 10-year yields minus 2-year, basis points Data as of June 28 Source: Bloomberg There is wide disagreement over whether equity markets have further to climb or whether we will see a spectacular market correction. Well for one, if you believe that there is still some ‘juice’ to extract from equities, stay long cyclicals and industrials. If you think that the run is over, switch into defensive stocks like utilities, 0 50 100 150 200 250 300 06/2013 12/2013 06/2014 12/2014 06/2015 12/2015 06/2016 12/2016 06/2017 12/2017
  • 12. Rong Viet Securities Corporation – Investment Strategy Report July 2018 12 telecommunications and pharmaceuticals. These last three sectors have been losing out in the past few quarters. Dispersion levels have been rising: people sold the losers to buy the winners. Currently there appears to be four headwinds facing equities: • Firm oil prices • Mighty dollar • Rising pressure on prices and wages in developed economies • The Donald We also can add the fact that equities globally have been in an uptrend for nine years: a long cycle. On the positive side, real rates are negative in most developed economies and valuations are more reasonable following the recent correction, but still not ‘that cheap’ ( table2). The P/CF of the MSCI World and the S&P 500 are currently 11.4x and 14.1x, much higher that their 10-year average of 8.9x and 9.6x, respectively. Table 2: MSCI Indices and VN Index Valuations P/E Current P/E End 2017 P/E 10- year average P/BV Current P/BV End 2017 MSCI World 18.7x 19.5x 18.2x 2.4x 2.4x MSCI EM 13.6x 15.1x 13.8x 1.6x 2.4x MSCI ASEAN1 14.8x 17.3x 15.3x 1.6x 1.9x VN Index 18.5x 18.1x 12.9x 2.7x 2.8x Source: MSCI, Rong Viet Securities Currencies have been in the limelight recently because of the potential ‘trade war(s)’ The key is the Renminbi. A sharply weaker Chinese currency could destabilize already vulnerable ones around the world, especially in the ASEAN region. The RMB is down 6% against the greenback since mid-April. However, we put a very low probability that the Chinese authorities would respond to this ill-prepared trade war by resorting to a devaluation of the Renminbi. China wants to make its currency a global one; hence devaluing it would send the wrong message. Moreover, the country does not need it from a macroeconomic standpoint. Repo rates (Figure 21) have been steady for the pas two years, implying that there is very little stress in the system. Figure 21: Renminbi/ USD, quarterly Source: Bloomberg, Rong Viet Securities 1 Indonesia, Malaysia, Philippines, Singapore and Thailand. 4.0 4.5 5.0 5.5 6.0 6.5 7.0 7.5 8.0 8.5 9.0 03/1990 03/1992 03/1994 03/1996 03/1998 03/2000 03/2002 03/2004 03/2006 03/2008 03/2010 03/2012 03/2014 03/2016 03/2018
  • 13. Rong Viet Securities Corporation – Investment Strategy Report July 2018 13 Figure 22: China 7-day Repo Rate, % Source: Bloomberg, Rong Viet Securities Vietnamese and ASEAN equities and currencies have not been immune to the steep correction that started globally in February/ March. Ceteris paribus, Vietnam’s economy should continue to grow at a healthy pace for the foreseeable future (see our Economist comments in the next section). Note that on the currency front, among ASEAN, the VND has outperformed in 2Q. Figure 23: VN Index and VND, 2000-current Source: Bloomberg, Rong Viet Securities The VN Index has lately become more correlated to the MSCI Emerging Index. This is most likely due to investors’ expectations of an inclusion of Vietnam in the index. Figure 24: VN Index & MSCI Emerging Markets correlation Source: Bloomberg 1 2 3 4 5 6 7 8 06/2013 12/2013 06/2014 12/2014 06/2015 12/2015 06/2016 12/2016 06/2017 12/2017 100 300 500 700 900 1,100 1,300 13,000 15,000 17,000 19,000 21,000 23,000 DONG/ USD (lhs) VN Index
  • 14. Rong Viet Securities Corporation – Investment Strategy Report July 2018 14 Bottom Line • Equity markets globally are most likely to go nowhere for the next few months, except for small rallies here and there. Seasonality does not help. The Tech sector, up 13 percent year to date, now accounts for 25% of the S&P 500. Kind of reminds us of the pre-Nasdaq crash period of 1999-2000… Our target for the S&P 500 Index is around 2300, 15% lower from its current level Figure 25: Performance of some major global stock market indexes in June Source: Bloomberg, RongViet Securities • Vietnamese equities are still pricey (Table 2). The market is supported by rising RoE (19% in 2018F versus 15% in 2017) and high EBITDA margins (26%). Will it be enough? P/E’s have expanded for the past seven years (Table 3). Table 3: VN Index P/E 2011 2012 2013 2014 2015 2016 2017 P/E 8.8x 11.7x 12.4x 12.9x 12.5x 15.6x 18.1x Source: Bloomberg • We expect a period of consolidation for the VN Index in 3Q. Our target range is 900 to 1000 with a preference for a re-test of 900. A couple of things to notice from the price action in 2Q2 : • On April 5, the VN Index peaked at 1207, 34% above its 200-day moving average. • The Index has currently retreated to its 200-day moving average at around 983-986. • From the bottom at 916 in early June, the Index has recovered to 1027, a 38% retracement from the 1207 level. Since then it has stalled. A break below 900 would take the Index to around 840, the lower bound of the upward channel in place for the past two years. It is possible that the market tries to break the 1027-40 level but that would only be possible in a risk-on environment. Overall, we remain bearish on the VN Index for the next few months. There will be better buying opportunities as this time-correction fazes out. 2 Prices as of June 28 -2% 2% 10% -1% 0% -5% -2% -13% -3% 2% -6% -9% -11% -2% -9% -4% 23% -17% -7% 3% 13% 23% DowJones S&P500 Nasdaq FTSE100 CAC40 DAX Nikkei225 SSE(Shanghai) HangSeng(Hongkong) TSEC(Taiwan) Kospi(Korean) JKSE(Indonesia) KLSE(Malaysia) VNIndex(Vietnam) HNX-Index(Vietnam) Gold Oil From 31/05/2018 to 29/06/2018 From 31/12/2017 to 29/06/2018
  • 15. Rong Viet Securities Corporation – Investment Strategy Report July 2018 15
  • 16. Rong Viet Securities Corporation – Investment Strategy Report July 2018 16 INVESTMENT STRATEGY AND IDEAS: STOCK PICKING Despite rising external risks caused in part by the US – China trade war, Vietnam’s economy showed its best performance since 2011 in the first six months of 2018: • Vietnam’s GDP growth grew by 7.1% YoY in H1 2018 with the recovery of agriculture, and the faster growth of manufacturing and services. • Vietnam’s PMI reached 55.7 in June from 53.9 in May, driven by increasing output and more new orders. • Total retail and services sales grew 8.3% YoY (inflation adjusted), higher than the growth of 7.9% in H1 2017. • The confidence of consumer as well as investors has been rising: Vietnamese consumers are willing to pay more for premium goods such as healthcare insurance and discretionary consumption goods. Following the Government’s support, domestic investors have been investing more in manufacturing substitute goods enterprises. In the stock market, VNIndex’s PE decreased to around 16x, equivalent to the level of mid-2017 after more than three consecutive months of a deep price correction. Meanwhile, the market’s NPAT growth was 24% YoY in Q1 2018, implying a less-than-1 PEG ratio. However, Vietnam’s stocks still face more risks from external factors (FED rates hike, trade war, and Renminbi depreciation) which can put more pressure on a potential devaluation of the Dong and an outflow of “fast money”. Although we believe that the SBV’s resources are strong enough to control FX fluctuations within its target range, we think monetary policy will be tighter in the H2 2018, implying less liquidity for risky sectors like the stock market and real estate. Due to these reasons, along with coming business earnings results coming out, we think that good buying opportunities will occur during the deep correction of the market. However, an uptrend trend will not come within all stocks/sectors. Smart money will carefully choose companies with good business results and not be invested across the board. For this month, we would like to introduce our two picks, NLG and FPT. HSX:NLG – TP: VND 40,200. After a long period of accumulating land bank, in 2018, Nam Long has come into the final step of implementing the Waterpoint project - the largest project in NLG’s land bank. In addition, after the successful launch of the Mizuki Park project, the company will be busy on developing other new projects such as Akari City and Flora Keshi, creating momentum for Nam Long in the coming years. Given that the company has specific plan for its biggest project, i.e. Waterpoint, we revise up our target price to VND 40,200 per share. HSX:FPT – TP: VND 63,600. After divesting from its trading and retail subsidiaries, FPT “lost” half of its consolidated revenue, nevertheless it managed to grow its profits by over 20%, which emphasizes the contrast between the core business (IT and telecom) and the ex-subsidiaries. Like for like comparison, FPT’s profit achieved higher growth rate than its revenues did, which means an improvement in operating efficiency. For 5M2018, the company’s revenue and PBT were VND 8,290 Bn (-49% YoY) and VND 1,408 Bn (+21% YoY), fulfilled 37.9% and 40.4% its guidance for 2018 respectively. Finally, Rong Viet’s Research Department unveils its portfolio made up of Vietnamese stocks under coverage. This is a long-only absolute-return portfolio as shown below:
  • 17. Rong Viet Securities Corporation – Investment Strategy Report July 2018 17 Table 4: Vietnam thematic portfolio for long-term absolute-return investors Sector Name Ticker Weight Purchase Current Gain/ Loss (%) Price Price (%) Cons Services VietJet Air VJC 10 131,000 131,000 0.0 Cons Goods Quang Ngai Sugar QNS 10 35,600 35,600 0.0 Cons Goods Vinh Hoan VHC 10 56,500 56,500 0.0 Basic Materials Phuoc Hoa Rubber PHR 10 19,000 19,000 0.0 Industrials Taseco Air Services AST 10 62,400 62,400 0.0 Industrials Airport Corp Vietnam ACV 10 86,000 86,000 0.0 Basic Materials Nam Kim Steel NKG 10 14,400 14,400 0.0 Financials Dat Xanh DXG 5 24,900 24,900 0.0 Utilities Central Hydro Power CHP 10 23,000 23,000 0.0 Cash 15 Total 100 Readers should refer to the relevant Rong Viet research reports for detailed analysis and disclosures. Prices as of July 04 Source: Rong Viet Securities
  • 18. Rong Viet Securities Corporation – Investment Strategy Report July 2018 18 Ticker Exchange Market cap (USD mn) Total Return Rating 2017 2018F 2019F PER Trailing (x) PER 2018F (x) PBR Cur. (x) Div Yield (%) +/- Price 1y (%) 3-month avg. daily turnover (USD thousand) Foreign remaining room (%) Target price (VND) Price @ July 04 (VND) +/- Rev. (%) +/- NPAT (%) +/- Rev. (%) +/- NPAT (%) +/- Rev. (%) +/- NPAT (%) ACB HNX 1,504.0 44,000 32,000 37.5% Buy 4,531.6 81.0 59.8 16.3 119.1 17.6 12.5 8.0 1.9 0.0 34.3 8,246.4 0.0 ACV UPCOM 8,113.2 124,000 86,000 45.2% Buy 3,207.0 -5.5 -18.1 38.8 58.9 13.4 42.6 30.1 6.6 1.0 71.3 503.5 45.4 AST HOSE 97.4 80,000 62,400 34.6% Buy 4,673.0 108.0 236.1 28.4 12.0 13.2 15.8 16.7 4.5 6.4 0.0 335.0 25.4 BFC HOSE 63.7 40,500 25,700 73.2% Buy 6,173.0 6.1 0.2 8.2 10.6 14.7 5.8 4.8 1.5 15.6 -29.6 45.3 35.1 CHP HOSE 138.1 29,000 23,000 32.6% Buy 2,289.3 32.5 59.2 -26.1 -38.4 12.1 16.2 13.2 1.7 6.5 -2.4 60.8 45.3 CTD HOSE 469.9 160,100 138,500 19.2% Accumulate 17,530.5 30.7 16.2 5.0 -5.7 0.0 6.5 8.0 1.4 3.6 -33.6 1,683.7 7.2 CTG HOSE 3,533.8 31,900 21,900 48.9% Buy 2,719.3 23.3 9.2 10.5 33.7 13.2 10.4 10.5 1.2 3.2 11.6 7,402.7 0.0 CTI HOSE 78.6 31,500 28,800 14.9% Accumulate 1,344.0 7.1 39.2 131.3 214.9 -44.0 11.7 10.0 1.5 5.6 0.4 410.6 21.2 DHG HOSE 566.0 102,000 99,900 5.1% Accumulate 5,767.0 7.4 -9.5 15.2 31.8 9.3 20.4 17.6 4.7 3.0 -15.1 1,132.3 2.1 DIG HOSE 149.7 22,500 14,500 55.2% Buy 1,846.5 68.4 31.7 25.7 24.9 66.9 30.7 14.1 1.2 0.0 -4.7 1,775.8 8.6 DPM HOSE 281.5 22,400 16,600 47.0% Buy 2,194.0 0.9 -39.1 35.1 -13.1 7.4 10.0 12.7 0.8 12.0 -22.1 641.0 28.8 DRC HOSE 114.8 29,500 22,300 40.4% Buy 2,367.0 9.2 -59.1 3.1 87.7 4.5 23.7 9.5 1.7 8.1 -26.0 425.1 25.5 DXG HOSE 369.4 36,106 24,900 45.0% Buy 3,149.9 14.9 39.8 56.2 37.7 1.0 9.2 8.2 1.8 0.0 72.8 5,352.8 5.2 FPT HOSE 1,063.6 63,600 40,000 64.0% Buy 4,487.5 8.0 47.0 -47.7 -28.7 13.5 8.1 10.3 2.0 5.0 3.4 3,931.2 0.0 GAS HOSE 6,594.1 125,900 79,500 63.4% Buy 5,589.0 9.3 36.4 14.3 15.9 10.6 15.2 13.9 3.5 5.0 41.6 3,467.1 45.6 HAX HOSE 24.3 30,000 16,000 87.5% Buy 4,282.4 33.1 8.1 34.1 34.2 30.3 9.6 5.0 1.0 0.0 -46.3 69.7 37.8 HDG HOSE 111.9 39,200 34,000 16.8% Accumulate 5,825.3 14.1 -16.0 N/a N/a -0.2 12.2 7.1 2.1 1.5 7.4 328.5 35.2 HPG HOSE 3,414.8 51,400 37,100 38.5% Buy 6,794.0 38.7 21.3 25.5 682.4 44.7 9.2 7.8 1.6 0.0 57.4 11,593.7 9.8 HTM UPCOM 88.2 15,500 9,200 70.7% Buy 851.0 -5.8 -20.0 26.2 136.3 11.3 63.8 23.8 0.7 2.2 0.0 710.6 34.3 IDC UPCOM 280.6 33,500 22,500 51.1% Buy 1,162.6 N/a N/a N/a N/a 5.7 2.7 23.5 0.4 2.2 0.0 180.5 0.0 IMP HOSE 112.0 67,100 52,300 29.3% Buy 3,050.0 15.4 16.0 20.4 21.6 21.2 20.8 20.6 1.6 1.0 -4.1 87.1 0.0 KBC HOSE 238.2 16,270 11,700 47.6% Buy 1,433.0 -36.0 4.9 84.5 23.3 -5.7 8.9 9.3 0.6 8.5 -31.6 1,857.1 31.5 KBC HOSE 238.2 16,270 11,700 47.6% Buy 1,433.0 -36.0 4.9 84.5 23.3 -5.7 8.9 9.3 0.6 8.5 -31.6 1,857.1 31.5 LTG UPCOM 112.3 57,100 39,000 54.1% Buy 6,042.0 11.6 23.9 7.1 1.4 8.3 6.0 7.0 1.1 7.7 0.0 62.7 4.2 MBB HOSE 1,880.4 36,300 23,900 54.0% Buy 1,907.4 40.7 39.7 15.0 73.6 6.9 10.5 13.2 1.5 2.1 16.5 7,896.3 0.0 MKP UPCOM 53.2 94,000 62,000 54.0% Buy 7,200.0 8.3 -4.2 -0.5 20.0 15.2 10.6 9.5 1.2 2.4 0.0 4.8 1.4 NCS UPCOM 28.6 60,000 37,000 67.6% Buy 4,365.0 15.4 24.2 10.4 -15.5 14.0 7.9 10.3 2.8 5.4 -3.5 10.0 47.2 NKG HOSE 113.6 28,500 14,400 104.9% Buy 3,824.0 41.2 36.6 45.9 16.7 32.9 3.5 3.9 0.6 6.9 -40.3 334.9 59.2 NLG HOSE 256.5 40,200 28,200 42.6% Buy 3,375.3 24.8 55.0 11.9 61.0 -60.5 9.6 8.2 1.7 0.0 23.9 680.4 0.0 NT2 HOSE 378.0 37,600 30,300 36.6% Buy 3,412.9 -15.3 -25.3 13.7 21.8 13.9 11.2 9.3 1.7 12.5 13.8 583.1 28.0 OIL UPCOM 693.9 18,232 15,400 18.4% Accumulate 493.0 52.0 -13.6 -3.7 -7.2 14.2 39.4 37.0 1.7 0.0 0.0 664.6 0.0 PC1 HOSE 160.1 37,000 32,000 15.6% Accumulate 4,030.2 5.1 -22.1 55.2 130.3 3.3 13.9 8.5 1.3 0.0 -8.6 170.4 11.2 PGI HOSE 71.1 24,900 18,500 41.1% Buy 2,448.0 0.0 24.9 10.7 7.7 11.2 11.8 9.6 1.2 6.5 -5.5 4.3 28.1 PHR HOSE 111.6 30,200 19,000 69.5% Buy 5,210.7 40.4 48.5 2.3 92.4 13.3 7.2 N/a 0.6 10.5 -3.2 474.5 40.1 PME HOSE 229.5 106,100 70,600 53.1% Buy 5,264.0 7.6 19.7 25.1 20.3 17.0 18.1 15.5 2.8 2.8 0.0 33.0 0.0 PNJ HOSE 571.3 103,000 81,300 30.4% Buy 7,250.0 28.2 61.1 31.7 28.6 13.4 15.9 14.1 2.7 3.7 20.4 2,996.5 0.0 POW UPCOM 1,240.7 18,400 12,400 48.4% Buy 1,118.7 5.4 82.1 20.0 7.9 7.9 11.8 14.2 1.0 0.0 0.0 933.7 -16.6 PPC HOSE 241.1 22,000 17,350 35.4% Buy 1,916.9 4.3 52.4 4.1 -5.9 1.2 6.3 7.6 1.0 8.6 -2.2 184.6 33.5 HIGHLIGHT STOCKS
  • 19. Rong Viet Securities Corporation – Investment Strategy Report July 2018 19 Ticker Exchange Market cap (USD mn) Total Return Rating 2017 2018F 2019F PER Trailing (x) PER 2018F (x) PBR Cur. (x) Div Yield (%) +/- Price 1y (%) 3-month avg. daily turnover (USD thousand) Foreign remaining room (%) Target price (VND) Price @ July 04 (VND) +/- Rev. (%) +/- NPAT (%) +/- Rev. (%) +/- NPAT (%) +/- Rev. (%) +/- NPAT (%) PVS HNX 307.8 22,500 15,900 47.2% Buy 1,738.0 -10.5 -22.9 -11.7 0.4 -0.8 8.9 9.5 0.7 5.7 -3.7 3,350.6 30.7 PVT HOSE 176.9 18,100 14,500 38.6% Buy 1,438.0 -9.0 0.7 9.4 -1.1 4.6 9.2 10.5 1.1 13.8 -0.3 321.5 15.5 QNS UPCOM 451.6 61,800 35,700 77.3% Buy 5,294.0 9.6 -27.9 7.8 19.6 5.2 10.6 7.4 1.9 4.2 -47.9 432.0 39.0 REE HOSE 403.1 48,400 30,000 66.7% Buy 5,535.2 36.5 26.0 13.3 23.3 4.6 6.5 5.5 1.2 5.3 -15.3 1,070.4 0.0 SHP HOSE 87.3 25,400 21,500 25.1% Buy 2,128.6 20.3 88.9 -1.9 -7.1 3.0 11.8 11.7 1.7 7.0 4.4 11.7 44.3 STK HOSE 37.7 21,500 14,500 51.7% Buy 2,419.0 46.6 242.3 2.0 27.7 7.9 7.7 7.0 1.1 3.4 -10.2 17.1 39.6 TCM HOSE 42.2 30,500 18,000 75.0% Buy 3,276.0 4.5 67.8 -0.9 -9.1 8.8 5.1 5.7 0.9 5.6 -37.4 195.6 0.0 VCB HOSE 8,668.9 60,000 55,600 9.4% Accumulate 2,568.7 18.2 33.0 8.7 17.4 12.0 19.3 23.6 3.6 1.4 46.8 8,406.7 9.4 VGC HNX 398.3 30,200 20,500 52.2% Buy 2,682.4 11.4 23.7 14.4 41.8 15.6 15.1 9.7 1.4 4.9 12.3 2,258.7 25.7 VGS HNX 17.3 15,500 10,600 57.5% Buy 2,434.1 31.4 -12.3 27.9 37.8 3.2 5.2 4.8 0.7 11.3 1.9 78.8 42.4 VHC HOSE 226.0 61,100 56,500 11.7% Accumulate 10,168.0 11.6 4.7 15.8 20.3 11.7 8.8 7.4 1.8 3.5 0.3 1,004.8 8.8 VIC HOSE 14,523.1 95,041 105,000 -9.5% Reduce 3,414.3 68.4 74.1 39.2 74.7 27.1 78.3 44.8 8.3 0.0 202.5 18,206.7 40.5 VJC HOSE 3,074.8 159,100 131,000 23.7% Buy 11,926.0 54.0 81.0 17.7 26.6 25.8 12.9 10.3 5.1 2.3 81.0 6,072.3 5.4 VNM HOSE 10,503.1 215,323 167,000 31.9% Buy 8,683.0 9.1 10.1 17.0 18.4 15.0 24.1 22.1 9.4 3.0 9.9 8,501.2 40.4 VRE HOSE 3,180.1 51,200 38,600 32.6% Buy 1,712.4 -13.6 -17.2 73.5 44.0 -7.3 39.8 25.3 2.8 0.0 0.0 5,426.6 17.0 VSH HOSE 151.9 22,100 17,000 35.9% Buy 1,505.3 17.5 10.8 3.2 -3.1 112.7 11.1 12.7 1.1 5.9 4.6 24.8 34.7 (*) Total Return = Stocks’ Upside plus dividend yield
  • 20. Rong Viet Securities Corporation – Investment Strategy Report July 2018 20 MACRO WATCH IN JUNE FX rate in free market FX rate in interbank market Source: SBV, RongViet Securities Source: SBV, RongViet Securities Contribution to CPI in June Inflation changes Source: GSO, RongViet Securities Source: GSO, RongViet Securities Government Bond Auctions Government Bond Yields Source: HNX, Customs, RongViet Securities Source: Bloomberg, RongViet Securities 22,200 22,400 22,600 22,800 23,000 23,200 01/2018 03/2018 05/2018 07/201 USDVND Free Market Central FX rate Trading FX rate 22,500 22,700 22,900 23,100 23,300 23,500 01/2018 03/2018 05/2018 07/201 SBV selling rate 1 Week 2 Weeks 1 Month 0% 1% 2% 3% 4% 5% 6% 10/2016 04/2017 10/2017 04/2018 Headline inflation Core inflation 0 20 40 60 80 100 120 0 10 20 30 40 50 60 70 06/15 06/16 06/17 06/18 VST VBSP VDB Winning-to-Offering ratio (RHS) (Trillion VND) (%) 0 1 2 3 4 5 6 01/2018 03/2018 05/2018 07/2018 VGB yield - 1Y VGB yield - 3Y VGB yield - 10Y
  • 21. Rong Viet Securities Corporation – Investment Strategy Report July 2018 21 INDUSTRY INDEX Level 1 industry movement Level 2 industry movement Source: RongViet Securities Source: RongViet Securities Industry PE comparison Industry PB comparison Source: RongViet Securities Source: RongViet Securities -8% -7% -1% 10% 0% -1% -3% -2% 1% 0% -10% -5% 0% 5% 10% 15% Technology Industrials Oil&Gas ConsumerServices HealthCare ConsumerGoods Banks BasicMaterials Financials Utilities 4% -5% 2% -8% -1% -8% 0% 13% 0% -11% 0% -3% -12% -3% 0% 2% -11% 0% -20% 0% 20% Retail Insurance Real Estate Technology Oil & Gas Financial Services Utilities Travel & Leisure Industrial Goods & Services Personal & Household Goods Chemicals Banks Automobiles & Parts Basic Resources Food & Beverage Media Construction & Materials Health Care 09 12 18 13 18 22 16 09 22 16 18 11 Technology Industrials Oil&Gas ConsumerServices HealthCare ConsumerGoods Banks BasicMaterials Financials Utilities HSX HNX 02 02 03 04 03 06 02 01 06 03 04 02 Technology Industrials Oil&Gas ConsumerServices HealthCare ConsumerGoods Banks BasicMaterials Financials Utilities HSX HNX
  • 22. Rong Viet Securities Corporation – Investment Strategy Report July 2018 22 ANALYSIS & INVESTMENT ADVISORY DEPARTMENT Bernard Lapointe Head of Research bernard.lapointe@vdsc.com.vn + 84 28 62992006 (1525) Lam Nguyen Senior Strategist lam.ntp@vdsc.com.vn + 84 28 6299 2006 (1313) • Banking • Conglomerates Hieu Nguyen Senior Analyst hieu.nd@vdsc.com.vn + 84 28 6299 2006 (1514) • Market Strategy • Pharmaceuticals • Aviation Duong Lai Senior Analyst duong.ld@vdsc.com.vn + 84 28 6299 2006 (1522) • Real Estate • Building Materials Vu Tran Senior Analyst vu.thx@vdsc.com.vn + 84 28 6299 2006 (1518) • Oil & Gas • Food & Beverage Trinh Nguyen Analyst trinh.nh@vdsc.com.vn + 84 28 6299 2006 (1331) • Steel • Construction • Technology Quang Vo Analyst quang.vv@vdsc.com.vn + 84 28 6299 2006 (1517) • Market Strategy • Basic Materials • Personal Goods Son Phan Analyst son.pnt@vdsc.com.vn + 84 28 6299 2006 (1519) • Utilities • Natural Rubber Tu Vu Analyst tu.va@vdsc.com.vn + 84 28 6299 2006 (1511) • Macroeconomics Son Tran Analyst son.tt@vdsc.com.vn + 84 28 6299 2006 (1527) • Market Strategy • Retails • Consumer chemicals Tung Do Analyst tung.dt@vdsc.com.vn + 84 28 6299 2006 (1521) • Logistics • Aviation Thu Pham Analyst thu.pa@vdsc.com.vn + 84 28 6299 2006 (1520) • Industrial Real Estate Thao Dang Analyst thao.dtp@vdsc.com.vn + 84 28 6299 2006 (1529) • Food & Beverage • Fishery Tam Pham Analyst tam.ptt@vdsc.com.vn + 84 28 6299 2006 (1530) • Banking • Insurance Anh Nguyen Analyst anh2.ntt@vdsc.com.vn + 84 28 6299 2006 (1531) • Banking Ha Tran Assistant ha.ttn@vdsc.com.vn + 84 28 6299 2006 (1526) RONG VIET SECURITIES CORPORATION Floor 1-2-3-4, Viet Dragon Tower, 141 Nguyen Du St. - Dist 1 – HCMC Tel: (84 28) 6299 2006 Fax: (84 28) 6291 7986 Email: info@vdsc.com.vn Website: www.vdsc.com.vn Hanoi Branch 2C Thai Phien St., Hai Ba Trung Dist, Hanoi Tel: (84 24) 6288 2006 Fax: (84 24) 6288 2008 Can Tho Branch 95-97-99 Vo Van Tan – Ninh Kieu - Can Tho Tel: (84 292) 381 7578 Fax: (84 292) 381 8387 Nha Trang Branch 50Bis Yersin St, Nha Trang Tel: (84 258) 382 0006 Fax: (84 258) 382 0008
  • 23. Rong Viet Securities Corporation – Investment Strategy Report July 2018 23 DISCLAIMERS This report is prepared in order to provide information and analysis to clients of Rong Viet Securities only. It is and should not be construed as an offer to sell or a solicitation of an offer to purchase any securities. No consideration has been given to the investment objectives, financial situation or particular needs of any specific. The readers should be aware that Rong Viet Securities may have a conflict of interest that can compromise the objectivity this research. This research is to be viewed by investors only as a source of reference when making investments. Investors are to take full responsibility of their own decisions. VDSC shall not be liable for any loss, damages, cost or expense incurring or arising from the use or reliance, either full or partial, of the information in this publication. The opinions expressed in this research report reflect only the analyst's personal views of the subject securities or matters; and no part of the research analyst's compensation was, is, or will be, directly or indirectly, related to the specific recommendations or opinions expressed in the report. The information herein is compiled by or arrived at Rong Viet Securities from sources believed to be reliable. We, however, do not guarantee its accuracy or completeness. Opinions, estimations and projections expressed in this report are deemed valid up to the date of publication of this report and can be subject to change without notice. This research report is copyrighted by Rong Viet Securities. All rights reserved. Therefore, copy, reproduction, republish or redistribution by any person or party for any purpose is strictly prohibited without the written permission of VDSC. Copyright 2016 Viet Dragon Securities Corporation. IMPORTANT DISCLOSURES FOR U.S. PERSONS This research report was prepared by Viet Dragon Securities Corp. (“VDSC”), a company authorized to engage in securities activities in Vietnam. VDSC is not a registered broker-dealer in the United States and, therefore, is not subject to U.S. rules regarding the preparation of research reports and the independence of research analysts. This research report is provided for distribution to “major U.S. institutional investors” in reliance on the exemption from registration provided by Rule 15a-6 of the U.S. Securities Exchange Act of 1934, as amended (the “Exchange Act”). Additional Disclosures This research report is for distribution only under such circumstances as may be permitted by applicable law. This research report has no regard to the specific investment objectives, financial situation or particular needs of any specific recipient, even if sent only to a single recipient. This research report is not guaranteed to be a complete statement or summary of any securities, markets, reports or developments referred to in this research report. Neither VDSC nor any of its directors, officers, employees or agents shall have any liability, however arising, for any error, inaccuracy or incompleteness of fact or opinion in this research report or lack of care in this research report’s preparation or publication, or any losses or damages which may arise from the use of this research report. VDSC may rely on information barriers, such as “Chinese Walls” to control the flow of information within the areas, units, divisions, groups, or affiliates of VDSC. Investing in any non-U.S. securities or related financial instruments (including ADRs) discussed in this research report may present certain risks. The securities of non-U.S. issuers may not be registered with, or be subject to the regulations of, the U.S. Securities and Exchange Commission. Information on such non-U.S. securities or related financial instruments may be limited. Foreign companies may not be subject to audit and reporting standards and regulatory requirements comparable to those in effect within the United States. The value of any investment or income from any securities or related financial instruments discussed in this research report denominated in a currency other than U.S. dollars is subject to exchange rate fluctuations that may have a positive or adverse effect on the value of or income from such securities or related financial instruments. Past performance is not necessarily a guide to future performance and no representation or warranty, express or implied, is made by VDSC with respect to future performance. Income from investments may fluctuate. The price or value of the investments to which this research report relates, either directly or indirectly, may fall or rise against the interest of investors. Any recommendation or opinion contained in this research report may become outdated as a consequence of changes in the environment in which the issuer of the securities under analysis operates, in addition to changes in the estimates and forecasts, assumptions and valuation methodology used herein. No part of the content of this research report may be copied, forwarded or duplicated in any form or by any means without the prior.