Pithoragarh Call Girls 🥰 8617370543 Service Offer VIP Hot Model
University Of Antwerp Paper International Business Environment Ken Lawrence
1. Universiteit Antwerpen
Faculteit Toegepaste Economische
Wetenschappen
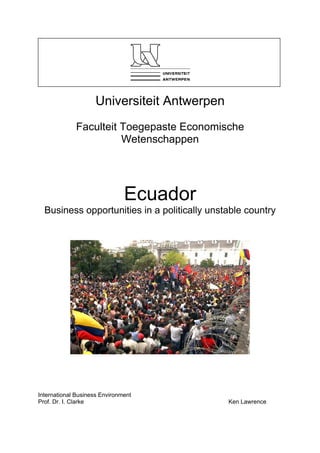
Ecuador
Business opportunities in a politically unstable country
International Business Environment
Prof. Dr. I. Clarke Ken Lawrence
2. Table of contents
1. Introduction 1
2. Environmental profile 2
2.1 Political-legal 2
2.2 Economic 4
2.2.1 Trends in GDP 4
2.2.2 Rate of inflation 4
2.2.3 Wage levels and unemployment 5
2.2.4 Strength of currency and convertibility 5
2.2.5 Rates of taxation 6
2.2.6 Balance of payments 6
2.2.7 Gini index 6
2.2.8 Vulnerability of the economy 6
2.3 Sociocultural 7
2.3.1 Growth rate of population and age distribution 7
2.3.2 Languages 8
2.3.3 Main religious and cultural groupings 8
2.3.4 Educational attainment levels 8
2.3.5 Role of women 9
2.4 Technological 9
2.4.1 Government spending on R&D 9
2.4.2 Legal regime for patent protection 10
2.4.3 Energy availability and costs 10
2.4.4 Transport infrastructure and costs 11
3. Conclusion 12
4. Bibliography 13
3. 1. Introduction
Can a small South-American country, riddled by political instability be of interest to
international business? The aim of this paper is to provide an analysis of Ecuador’s external
environment in order to identify possible business opportunities.
At the core of this paper lies the PEST-analysis. This tool provides the framework for
assessing the political-legal, economic, sociocultural and technological environment.
The first part deals with the political-legal environment. What is the historical background of
the country’s business environment? Which political factors does the international investor
need to take into account when dealing with Ecuador?
The second part of the analysis concentrates on Ecuador’s economy. First of all a set of
indicators such as GDP, inflation and unemployment will be examined. Among others we
shall look at the strength of the currency and rates of taxation. Special attention will be given
to the vulnerability of Ecuador’s economy.
In the third part of the PEST-analysis the sociocultural environment is explored. What are the
growth rate and age distribution of the Ecuadorian population? What is the level of education?
What is the percentage of women in the labour force?
The final part of the environmental scan revolves around the technological aspect of Ecuador.
The height of government spending on R&D, the protection of intellectual property, energy
availability and transport infrastructure will be examined.
The conclusion will give concrete advice concerning business opportunities in Ecuador as
well as the pitfalls to avoid.
The reader should take note of the fact that the larger tables and graphs have been put in a
separate annex. All of these tables and graphs have received a number, preceded by a capital
A. Thus for example, table A10 refers to table 10 in the Annex.
1
4. 2. Environmental profile
In order to identify business opportunities in a given country it is useful to start with an
analysis of the specific country’s external environment. This paper will use the PEST analysis
to perform such an environmental scan of Ecuador’s external environment.
2.1 Political-legal
Ecuador is politically highly unstable. In recent years there has not been a single president
who was able to sit out his full term of four years.
Table 1: Recent Ecuadorian presidents
President In office
Abdalá Bucaram Ortiz 1996-1997
Fabián Alarcón 1997-1998
Jamil Mahuad 1998-2000
Gustavo Noboa 2000-2003
Lucio Gutiérrez 2003-2005
Alfredo Palacio 2005-present
Source: Presidents of Ecuador – Wikipedia page, 2005
The country has a history of considerable political unrest which can be traced back to the 19th
century revolutions in South-America. In 1822 Ecuador joined Simon Bolivar’s Republic of
Gran Colombia and thus became independent from its colonizer Spain. The country was
unified in the 1860’s by Gabriel Garcia Moreno. He was a conservative and very catholic
statesman who served twice as Ecuador’s president. Though the country managed to enjoy
considerable economic success due to the worldwide demand for cocoa in this period, it was
not until Eloy Alfaro became the country’s president that considerable business opportunities
arose. He adopted policies favourable to capitalist development and reduced the power of the
clergy. As with so many countries where the economy is largely centred on a particular
product – in this case cocoa – a sudden drop in demand caused both economic troubles and
political unrest. This lead to a military coup in 1925. The 1930’s and 1940’s were relatively
stable as the five-time presidency of Jose Velasco Ibarra indicates. Slowly but surely
recession and popular unrest made things take a turn for the worse. The 1960’s saw the
country try and capitalize on its oil wealth. The incredible opportunities in this field were so
2
5. attractive that in 1972 there was once again political instability. Until 1979 the nationalist
military regime which had seized power tried to use the oil wealth to improve the economic
situation. Since Ecuador’s return to democracy in 1979 a whole array of presidents have tried
the very same thing, but have been unsuccessful in their attempts to install sound economic
reforms. ( Lucio Gutierrez: Ecuador's populist leader, 2002; Gabriel García Moreno –
Wikipedia page, 2005 )
The political instability in Ecuador is also currently very much an issue. Former president
Gutiérrez had lost his image of a reformer. Many observers felt that by pursuing conservative
economic policies he no longer could be regarded as being in touch with the poor indigenous
population he so successfully rallied behind him in the 2002-elections. In November 2004
Guttiérrez saw his former left-wing supporters join the conservative Social Christian Party.
These two parties then tried to impeach Guttiérrez because they accused him of using public
funds to support candidates of his party. Such an act clearly undermined Guttiérrez 2002-
election claims of putting an end to corruption. The impeachment failed because the Social
Christian Party abandoned the procedure.
In the eyes of the international community Guttiérrez position took another heavy blow when
in December 2004 his party Sociedad Patriotica and two others ( PRIAN and PRE ) attempted
to cancel the Supreme Court of Justice. Such a vote in Congress clearly violates the principle
of separation of powers and is prohibited by the Ecuadorian Constitution. The public opinion
did not take this lightly. Nevertheless Guttiérrez attempted to dissolve the Supreme Court on
15th April 2005. Several thousands of people began demonstrating in the streets of the
country’s capital Quito and demanded that Guttiérrez should resign. He initially refused, but
lost the backing of the police and the army and was eventually forced to resign on 20th April.
Brazil offered Gutiérrez asylum and the Ecuadorian Congress appointed the country’s vice-
president Alfredo Palacio as the new president.
( Lucio Gutiérrez – Wikipedia page, 2005; A coup by Congress and the street, 2005 )
3
6. 2.2 Economic
In this part of the PEST-analysis we take a closer look at Ecuador’s economy. First of all
Ecuador’s trends in GDP will be discussed. Then we shall take a closer look at the country’s
rate of inflation. Subsequently Ecuador’s wage and unemployment levels will be examined.
The impact of the dollarization on the currency is the next topic. Both the tax regime and
Ecuador’s balance of payments will be carefully examined. Finally we shall end the chapter
with a look at income inequality and the vulnerability of Ecuador’s economy.
2.2.1 Trends in GDP
The trends in GDP can be expressed in a multitude of ways, though all show the same general
trend. Table A1 and graphs A2 to A5 show Ecuador’s GDP in three ways: at current prices (in
millions of US dollars ), per capita ( in US dollars ), at constant prices ( with 1990 prices ).
The fourth column and fourth graph show Ecuador’s GDP growth rates (real rates of growth).
From 1995 to 1998 the GDP has clearly grown. In the years 1999 and 2000 there was an
obvious slump in the economy, but this trend was overturned in 2001 with GDP once again
increasing. Since the disastrous year of 1999 GDP real growth rates are also rising again. In
the year 2001 the rate was 5,1%.
( UN Statistical Yearbook, 2004, p.137 )
2.2.2 Rate of inflation
Inflation is the annual percent change in consumer prices. Table A6 and graph A7 show the
inflation for Ecuador for the years 1995 to 2004. It is clear that the dollarization of 2000 was
vital for the economy. That year inflation reached a staggering 91% due to the adjustments in
the exchange rate and in the relative prices which were needed to accommodate the transition
from sucre to dollar. Moreover this high figure can be attributed to the large monetary
expansion in sucres the year before. Following the dollarization the graph shows how
Ecuador’s inflation dropped significantly. Latest figures indicate an inflation percentage of
about 2%.
( The World Bank, 30.09.2004; EcuadorExports.com, 2005a; LatinFocus, 2005 )
There is a certain danger attached to these figures. Although current inflation may be at a very
acceptable level, former inflation has left the average Ecuadorian faced with some very high
4
7. prices. The UN has for example published the consumer price index numbers for 1995 to
2002. These figures can be found in table A8 and graph A9. The year 1990 is attributed an
index of 100. It is clear that prices have risen dramatically and this has a severe impact on the
consumption pattern of Ecuadorians. ( UN Statistical Yearbook, 2004 , p.316 )
2.2.3 Wage levels and unemployment
Wage levels
The national minimum wage in Ecuador is about $121,90 per month; for the entire salary
package this figure is slightly higher at $131,91 per month. The labour cost per hour is 85
cents an hour. These figures show that the country can be very attractive for industries reliant
on a large workforce. Yet there is a downside: Ecuador’s workforce currently has a low level
of education and training. Therefore these low costs are mainly interesting for industries
requiring menial labour.
( Deloitte & Touche – Ecuador Snapshot, 2005; Prescher, D., Haskins, S., 2004 )
Unemployment
Table A10 and graph A11 show the unemployment in Ecuador as a percentage of the total
population. In 1999 unemployment was the highest, reaching 14%. Although the situation has
improved since then it is clear that 9,3% is still a high rate of unemployment. When looking at
the differences between the sexes we can see that women are often unemployed. In 1999, one
out of five women was unable to find a job.
( UN Statistical Yearbook, 2004, p.275 )
2.2.4 Strength of currency and convertibility
On table A12 and graph A13 the exchange rate is expressed as national currency ( sucre ) per
US dollar. This means that a rise in the exchange rate signifies a depreciation of the sucre. It
is clear that from 1993 until 2000 the exchange rate has continually risen. In 2000 Ecuador
adopted a fixed exchange rate of 25.000 sucre for 1 US dollar. This dollarization has produced
stability for Ecuador and has naturally improved the convertibility.
( UN Statistical Yearbook, 2004 , p.825 )
5
8. 2.2.5 Rates of taxation
Ecuador has taxes at both the municipal and national levels. A distinction has to be made for
resident companies and individuals on the one hand and temporary residents with foreign
nationality on the other hand. The former are taxed on worldwide profits/income whereas the
latter are only taxed on territorial income. Corporate tax rate is 25%. Indirect taxation is also
prevalent in Ecuador: most transactions are subject to a VAT-rate of 12%. Interesting for
businesses: dividends are exempt from taxes, capital gains are taxed as income ( progressive
rates up to 25% ) and there is only group consolidation for financial purposes and not for tax
purposes. ( Deloitte & Touche – Ecuador Snapshot, 2005 )
2.2.6 Balance of payments
The transactions – debit and credit – of the balance of payments can be divided into the
current account and the capital account. Table A14 and graph A15 show that Ecuador had a
current account deficit in 1998, 2001 and 2002. This should be of great concern to the
government. Not only is Ecuador’s export highly reliant on a few key sectors, but the current
account deficit shows that the country’s companies are not competitive.
( UN Statistical Yearbook, 2004, p.704 )
2.2.7 Gini index
The Gini index is used to measure income inequality as a result of uneven distribution in
society. A Gini index of 100 corresponds with perfect inequality and means that one person
has all the income in a country. A Gini index of 0 corresponds with perfect equality; everyone
has the same income. Ecuador has a high Gini index of 43,7 which means that there is a high
level of inequality in the country. For a quick comparison: Belgium has a Gini index of 25.
( World Bank – 2004 World Development Indicators, 2004, p.60; Gini coefficient –
Wikipedia page, 2005 )
2.2.8 Vulnerability of the economy
The vulnerability of Ecuador’s economy is shown by the structure of its merchandise exports.
In 1990 more than half of these exports were fuels. Food was also very important. Other
sectors were hardly represented. As Ecuador is so focused on these two elements, fuels and
food ( mainly bananas and shrimps ), a sudden price crash on world markets for these goods
can cause a severe backlash for the country. The figures show that Ecuador has recognized the
need to diversify. In 2002 fuels no longer accounted for half of the merchandise exports, but
6
9. only 40%. There is now a heavier emphasis on manufactures and agricultural raw materials.
Food remains about at its 1990 level.
Table 2: Structure of merchandise exports as a % of total exports
Agricultural Ores and
Food raw materials Fuels metals Manufactures
1990 44 1 52 0 2
2002 43 7 40 0 10
Source: World Bank – 2004 World Development Indicators, 2004, p.198
In order to provide a more positive outlook for Ecuador it is interesting to note that most of
the country’s debt is long term. Although in absolute figures it is still astonishingly high, the
long term nature means relative stability for the government.
Table 3: Debt in $ millions
Total external debt Long-term debt
1990 12107 10029
2002 16452 13828
Source: World Bank – 2004 World Development Indicators, 2004, p.242
2.3 Sociocultural
The third element of the PEST-analysis is the sociocultural environment of the country. This
chapter begins with a close look at Ecuador’s population growth rate and age distribution.
Languages and main religious and cultural grouping will be briefly discussed before going
deeper into Ecuador’s educational attainment levels and the role of women in Ecuadorian
society.
2.3.1 Growth rate of population and age distribution
Growth rate
The annual rate of increase of the population is 1,9% ( calculation based on the period 1995-
2001 ). ( UN Statistical Yearbook, 2004 , p.37 )
A large problem for the country is the high infant and maternal mortality rate. The maternal
mortality rate is expressed per 100.000. For 2000-2005 this figure is 210 for Ecuador. The
United States for example only have a maternal mortality rate of 12.
7
10. Table 4: Infant mortality ( per 1000 births )
Ecuador United States
1995-2000 45.6 7,2
2000-2005 41.5 6,7
Source: UN Statistical Yearbook, 2004, p.72
Medical infrastructure is obviously not yet up to the standard of developed countries. This is
an area in which the government has to take some much needed measures.
Age distribution
Graphs A16 to A22 give the age distribution for 1990, 1995 and 2000 as well as the predicted
age distribution for 2005,2010,2020 and 2050. The general trend is that the population is
growing older. This shift will put a strain on the social security system although this may be
overcome by a larger contribution being made by the population in the age group of 18-60
years. ( Ecuador – Age Distribution, 2003 )
2.3.2 Languages
The official language of Ecuador is Spanish. There is also a Native American language,
Quechua, which is spoken by a small part of the population.
( Ecuador – Wikipedia page, 20 May 2005 )
2.3.3 Main religious and cultural groupings
The national culture of Ecuador is a mixture of European and Amerindian ancestry, called
mestizo. There are also influences from African slaves. The main religion in Ecuador is
Catholicism; about 95% of Ecuadorians are Roman Catholic.
( Culture of Ecuador – Wikipedia page, 2005 )
2.3.4 Educational attainment levels
The years of formal schooling received, on average, by adults over age 15 is only 6,4 in
Ecuador. For the US for example this figure is 12, for Belgium 9,3. Even though in 2000
81.5% of all children entered primary education less than half of the children of official
secondary school age enrolled in secondary education. There is an equal division between
women and men in both primary and secondary education enrolment.
( Ecuador – Education, 2005; UN Statistical Yearbook, 2004, p.52 )
8
11. 2.3.5 Role of women
As far as education is concerned: the ratio of female to male enrolments in primary and
secondary school was 97 for 1990/1991 and 100 for 2001/2002 which is very good. Moreover
the literacy gender parity index of 1 in 2002 shows that they receive equal education to men.
( World Bank – 2004 World Development Indicators, 2004, p.18, 28 )
Unfortunately this does not translate into a prominent place for women in the domain of
politics or employment as the following figures show. First of all women in parliament as a %
of total seats in 2003 was a mere 16%. Labour force participation of women was 22,5% in
1980 and 35,7% in 2002. The percentage of women constituting the labour force was 20,1%
in 1980 and 28,7% in 2002. This means that over a period of more than 20 years there was a
rise of almost 50%, although in general it is still quite a low figure.
( World Bank – 2004 World Development Indicators, 2004, p.28, 42 )
It seems that in Ecuador women get the same chances when it comes to education, but are
often expected to stay home and look after the household chores and the children afterwards.
Nevertheless this situation seems to be changing slowly but surely as the rise in for example
labour force participation shows.
2.4 Technological
2.4.1 Government spending on R&D
Government spending on Research and Development is very low, only 0,09% of GDP.
( World Bank – 2004 World Development Indicators, 2004, p.298 )
This has a large influence on for example the country’s technology index. The technology
index “denotes the country's technological readiness. This index is created with such
indicators as companies spending on R&D, the creativity of its scientific community, personal
computer and internet penetration rates.” ( definition from: Ecuador – Economy – Technology
Index, 2004 )
9
12. Ecuador has a technology index of 3.1, placing it on the 85th place in a list of 101 countries
where Belgium occupies the 30th place with an index of 4,59 and where the United States
occupies the top spot with an index of 6.24. ( Ecuador – Economy, 2005 )
It is clear that the Ecuadorian government has to increase its spending on R&D if it wants to
benefit from modern technology and international investment.
2.4.2 Legal Regime for patent protection
Although there is a considerable lack of reliable data it seems that the legal regime for patent
protection in Ecuador has improved immensely in 2001. That year the Office of the United
States Trade Representative ( USTR ) recognized the country’s progress and removed it from
its ‘Watch list’ of countries with weak protection for intellectual property rights.
( USTR Report on Ecuador, 2002 )
Table 5: Patents: applications
Applications for patents
1999 490
2000 11
2001 28909
Source: UN Statistical Yearbook, 2004, p.693
As a member of the World Intellectual Property Organization (WIPO) Ecuador has ratified
the WIPO Copyright Treaty. Moreover the country has expressed its commitment to apply the
WTO TRIPS Agreement.
( USTR Report on Ecuador, 2002 )
2.4.3 Energy availability and costs
Tables and graphs A23 to A27 show statistics regarding the energy production, consumption
and import/export of Ecuador. The reader should note that these figures represent thousand
metric tons of oil equivalent and kilograms per capita. The data shows that Ecuador mainly
produces liquids. This production rises a little too. As far as consumption is concerned it is
clear that once again liquids feature prominently. The crisis of 1999 left its mark as
consumption fell during that year, but has since risen to its pre-1999 level. Ecuador is a net
exporter when it comes to primary energy. It exports on average about ten times as much
primary energy as it imports. ( UN Statistical Yearbook, 2004, p.596-597 )
10
13. Graph A28 shows the production of selected energy commodities. Petroleum products are
crucial for the country’s energy supply. This is also evident when we look at the sources of
electricity for Ecuador ( graphs A29 and A30 ). It is clear that oil is becoming more important.
This reliance could become a problem in the future.
( UN Statistical Yearbook, 2004, p.620; World Bank – 2004 World Development Indicators,
2004, p.148 )
The energy use in the Ecuadorian economy is rising. World Bank figures show that over the
period 1990-2001 the average annual growth of energy use is 3,4%. For now this is of little
concern for the Ecuadorian government considering the current abundance of primary energy.
( World Bank – 2004 World Development Indicators, 2004, p.140 )
2.4.4 Transport infrastructure and costs
In 2002 Ecuador had 202 airports of which 61 had paved ( concrete or asphalt surfaces )
runways. This is quite good compared to the whole world, but in comparison to other South-
American countries Ecuador is clearly behind. Brazil, Mexico, Argentina, Venezuela,
Colombia and Chile all have more airports with paved runways. Moreover Ecuador only has
one helicopter take-off and landing site. The total length of its highway system is 43.197 km.
Unfortunately only 8.164 km are paved. Ecuador also is clearly behind when it comes to its
railway network. This network only has a length of 966 km. Ecuador does have decent
pipelines for gas, oil and refined products and it has five major ports and harbours (
Esmeraldas, Guayaquil, La Libertad, Manta, Puerto Bolivar and San Lorenzo ).
( Ecuador – Transportation, 2005; Transportation – Airports with paved runways, 2005 )
In general we can say that the Ecuadorian government needs to invest more in the transport
infrastructure. Enough funds need to be made available not only for construction but also for
maintenance in order to attract more international businesses.
11
14. 3. Conclusion
As the preliminary version of this paper was finished before the forced resignation of Lucio
Gutiérrez as president of Ecuador the chapter concerning the political-legal environment
needed to be partially rewritten for this final version. The last paragraph of the concerned
chapter in the preliminary version was: ‘Given the country’s recent track record of failing
presidencies and Guttiérrez’ crumbling political support it only seems like a matter of time
before Ecuador is once again thrown in political turmoil allowing a new generation of
populist leaders to attempt to seize power.’ Prophetic words it seems.
Although newly-elected president Alfredo Palacio undoubtedly will try his very best to
restore confidence in the government it should be clear that Ecuador’s political instability is
the single largest problem for international businesses to invest in the country. Not only the
first chapter of this paper needed to be rewritten. Companies looking for the best combination
between their own strengths and weaknesses and the target country’s environment have
business plans. A dramatic change such as Ecuador witnessed means that these companies
need to adjust their business plans accordingly. Business likes stability and looking at
Ecuador’s track record that is exactly what the country cannot guarantee.
Nevertheless there are certain business opportunities in Ecuador today. An important factor
for these opportunities is the fixed exchange rate ( dollarization ) which has brought relative
stability in the economy. A first opportunity is the oil industry. The production of petroleum
products is already very important for the country but as prices on the international markets
rise Ecuador’s oil reserves will become even more attractive. A second business opportunity
stems from the low wage levels. As workers are not highly qualified this is mainly interesting
for labour intensive industries. A third business opportunity is in the domain of the transport
infrastructure. In general, the construction of roads, airports and railroad tracks would be
beneficial for the country in attracting more international investment.
It remains to be seen whether Ecuador can convince the international business world that its
political instability is a thing of the past and not once more of the future.
12
15. 4. Bibliography
A coup by Congress and the street, 25 April 2005, On-line available at:
http://www.economist.com/agenda/PrinterFriendly.cfm?Story_ID=3893731
Culture of Ecuador – Wikipedia page, 13 April 2005, On-line available at:
http://en.wikipedia.org/wiki/Culture_of_Ecuador
Deloitte & Touche – Ecuador Snapshot, 2005, On-line available at:
http://www.deloitte.com/dtt/article/0,1002,sid%3D24295%26cid%3D59809,00.html
Ecuador – Age Distribution, 17 July 2003, On-line available at:
http://www.nationmaster.com/country/ec/Age_distribution
Ecuador – Economy, 2005, On-line available at:
http://www.nationmaster.com/country/ec/Economy&b_define=1
Ecuador – Economy – Technology Index, 2004, On-line available at:
http://www.nationmaster.com/graph-T/eco_tec_ind
Ecuador – Education, 2005, On-line available at:
http://www.nationmaster.com/country/ec/Education
EcuadorExports.com, 2005
http://www.ecuadorexports.com/economictrends.htm
Ecuador – Transportation, 2005, On-line available at:
http://www.nationmaster.com/country/ec/Transportation
Ecuador – Wikipedia page, 20 May 2005, On-line available at:
http://en.wikipedia.org/wiki/Ecuador
13
16. Gabriel García Moreno – Wikipedia page, 14 April 2005, On-line available at:
http://en.wikipedia.org/wiki/Gabriel_Garcia_Moreno
Gini coefficient – Wikipedia page, 26 May 2005, On-line available at:
http://en.wikipedia.org/wiki/Gini_index
LatinFocus, 2005
http://www.latin-focus.com/latinfocus/countries/ecuador/ecueisum.htm
Lucio Gutierrez: Ecuador's populist leader, 25 November 2002, On-line available at:
http://news.bbc.co.uk/1/hi/world/americas/2511113.stm
Lucio Gutiérrez – Wikipedia page, 26 May 2005, On-line available at:
http://en.wikipedia.org/wiki/Lucio_Guti%E9rrez
Prescher, D., Haskins, S., 2004, Ecuador Business Opportunities By The Bucketful, On-line
available at: http://www.escapeartist.com/International_Living/Ecuador.html
Presidents of Ecuador – Wikipedia page, 25 April 2005, On-line available at:
http://en.wikipedia.org/wiki/List_of_Presidents_of_Ecuador
The World Bank, 30.09.2004, On-line available at:
http://www.worldbank.org/data/countrydata/aag/ecu_aag.pdf
Transportation – Airports with paved runways, 2005, On-line available at:
http://www.nationmaster.com/graph-T/tra_air_wit_pav_run_tot
UN Statistical Yearbook, 2004, United Nations – Department of Economic and Social Affairs
– Statistics Division, New York
USTR Report on Ecuador, 2002, On-line available at:
http://www.google.com/url?sa=U&start=1&q=http://www.ustr.gov/assets/Document_Library/
Reports_Publications/2002/2002_NTE_Report/asset_upload_file6_6390.pdf&e=10053
14
17. World Bank – 2004 World Development Indicators, 2004, The International Bank for
Reconstruction and Development/The World Bank, Washington
15