1. The effect of temperature on the catalytic conversion of Kraft lignin
using near-critical water
Thi Dieu Huyen Nguyen a
, Marco Maschietti a,1
, Lars-Erik Åmand b
, Lennart Vamling b
, Lars Olausson c
,
Sven-Ingvar Andersson a
, Hans Theliander a,⇑
a
Chalmers University of Technology, Department of Chemical and Biological Engineering, SE-412 96 Gothenburg, Sweden
b
Chalmers University of Technology, Department of Energy and Environment, SE-412 96 Gothenburg, Sweden
c
Valmet Power AB, Box 8734, SE-402 75 Gothenburg, Sweden
h i g h l i g h t s
The conversion of lignin in near-critical water was investigated at 290–370 °C.
ZrO2/K2CO3 was used as catalytic system and phenol as char suppressing agent.
The lignin-oil has higher HHV and lower contents of oxygen and sulphur than lignin.
The main 1-ring aromatics are anisoles, alkylphenols, guaiacols and catechols.
The yield of 1-ring aromatics increases remarkably with an increase in temperature.
a r t i c l e i n f o
Article history:
Received 2 April 2014
Received in revised form 5 June 2014
Accepted 6 June 2014
Available online 21 June 2014
Keywords:
Lignin
LignoBoost
Catalytic conversion
Bio-oil
Near-critical water
a b s t r a c t
The catalytic conversion of suspended LignoBoost Kraft lignin was performed in near-critical water
using ZrO2/K2CO3 as the catalytic system and phenol as the co-solvent and char suppressing agent.
The reaction temperature was varied from 290 to 370 °C and its effect on the process was investi-
gated in a continuous flow (1 kg/h). The yields of water-soluble organics (WSO), bio-oil and char
(dry lignin basis) were in the ranges of 5–11%, 69–87% and 16–22%, respectively. The bio-oil, being
partially deoxygenated, exhibited higher carbon content and heat value, but lower sulphur content
than lignin. The main 1-ring aromatics (in WSO and diethylether-soluble bio-oil) were anisoles, alkyl-
phenols, catechols and guaiacols. The results show that increasing temperature increases the yield of
1-ring aromatics remarkably, while it increases the formation of char moderately. An increase in the
yields of anisoles, alkylphenols and catechols, together with a decrease in the yield of guaiacols, was
also observed.
Ó 2014 Published by Elsevier Ltd.
1. Introduction
Natural gas, fossil-oil, and coal are non-renewable resources
that are used for the production of fuels and chemicals. The deple-
tion of these resources, together with the increase of anthropo-
genic greenhouse gas emissions deriving from their extensive
use, has inspired scientists and researchers to find alternatives
which are renewable. In such a scenario, biomass has been gaining
increasing importance in addressing these issues. In this context,
the utilisation of lignocellulosic biomass is very promising since
it does not compete directly with food supplies (Singhvi et al.,
2014). Wood, which consists of approximately 40–50% cellulose,
20–30% hemicellulose and 20–30% lignin on mass basis, is the most
common lignocellulosic material available. Today, about 50% of the
wood consumed on a global scale is used as fuel for the production
of heat and power. The remaining 50% is mostly used for the pro-
duction of timber-framed constructions and various paper prod-
ucts (Fengel and Wegener, 1989; Gellerstedt, 2009). The
dominant methods used for the production of paper pulp are a
variety of chemical pulping processes, such as Kraft pulping (gen-
erating Kraft lignin), sulphite pulping (generating lignosulphonate)
and soda pulping (generating soda lignin). The aim of chemical pul-
ping is to dissolve and remove lignin to liberate wood fibres,
although some hemicelluloses are also degraded in the process
(Brännvall, 2009). Nowadays, most of the lignin (almost 99%)
http://dx.doi.org/10.1016/j.biortech.2014.06.051
0960-8524/Ó 2014 Published by Elsevier Ltd.
⇑ Corresponding author. Tel.: +46 31 772 2992; fax: +46 31 772 2995.
E-mail address: hanst@chalmers.se (H. Theliander).
1
Current address: Aalborg University Esbjerg, Department of Biotechnology,
Chemistry and Environmental Engineering, 6700 Esbjerg, Denmark.
Bioresource Technology 170 (2014) 196–203
Contents lists available at ScienceDirect
Bioresource Technology
journal homepage: www.elsevier.com/locate/biortech
2. extracted by these methods is used as internal fuel in the pulping
process itself, thereby recovering energy. The pulp mills have
become more energy efficient than in the past and now have an
energy surplus, which can be expressed as a lignin surplus. In the
modern Kraft pulping process (the dominant chemical pulping pro-
cess) in particular, there is a remarkable lignin surplus that can be
exploited (Lora, 2008). Furthermore, a new efficient process,
namely the ‘‘LignoBoost’’ process, for extracting lignin at high lev-
els of purity has been introduced and that has recently gained com-
mercial status. Thus, in years to come, a huge amount of
LignoBoost Kraft lignin is expected to be available for valorisation
(Theliander, 2008; Tomani, 2010).
Lignin is an amorphous, three-dimensional, aromatic polymer
that acts as binding material in the cell walls and between the cells.
In addition, the hydrophobic character of lignin hinders water from
penetrating the cell walls. Lignin is derived from the polymerisa-
tion of three phenylpropane monomers, namely p-coumaryl alco-
hol, coniferyl alcohol and sinapyl alcohol, which connect
randomly with ether (C–O–C) bonds (i.e. b-O-4, 4-O-5 and 1-O-4)
and carbon–carbon (C–C) bonds (i.e. 5-5, b-5, b-b and b-1)
(Henriksson, 2009). Due to its aromatic nature and its abundant
availability, this material could become a resource for the indus-
trial production of value-added chemicals and transportation fuel
additives if converted into basic phenolic compounds (Pandey
and Kim, 2011; Vigneault et al., 2007).
Among the possible processes for the conversion of lignin into
smaller aromatic units, hydrothermal liquefaction in near-critical
water (NCW) is a very promising one due to the relatively mild
temperatures employed, which allows the aromatic structures to
be retained, and the fact that NCW is a unique solvent for carrying
out chemical reactions. Water is generally considered to be in the
near-critical region at temperatures between 250 and 350 °C and
pressures high enough to be in the liquid state. In the near-critical
region, water behaves as a low polarity compound, showing the
capability of dissolving most of the nonpolar or low polar organic
compounds present. At the same time, the dielectric constant,
albeit reduced, is still high enough to allow water to dissolve salts.
Also, NCW has a strong tendency to ionise because of the increase
in the ionic product with temperature, thus being a source of (H+
)
and (OHÀ
) in many reactions. Furthermore, the density of water in
this region is highly tuneable, with relatively small variations in
pressure and temperature (Carr et al., 2011; Eckert and Chandler,
1998; Brunner, 2009).
Previous studies of lignin conversion in NCW have shown that
one of the major drawbacks of the process is the tendency of the
smaller fragments, produced by the breakage of ether bonds, to
give secondary re-polymerisation reactions, yielding to high
amount of solid residues (Azadi et al., 2013). It has been found
that re-polymerisation reactions can be limited if phenol is used
as a co-solvent, which increases the yield of the liquid products
and decreases the amount of solid residues formed (Fang et al.,
2008; Okuda et al., 2004). According to these authors, phenol
favours the formation of a homogeneous phase at reaction condi-
tions and entraps the active fragments derived from lignin depo-
lymerisation, thus preventing the formation of heavier
compounds. Also, several investigators have found the use of
alkali catalysts (e.g. K2CO3) to be beneficial in increasing the yield
of liquid products in the conversion of wood biomass (Bhaskar
et al., 2008; Karagöz et al., 2005, 2006). Moreover, Andersen
(1989, 1990) presented a process operating in water at tempera-
tures in the range of 270–380 °C, pressures in the range of 15.2–
27.4 MPa, in which an organic material is converted into small
molecular units in the presence of the catalyst ZrO2. In these pat-
ents, it was reported that ZrO2 played an important role in char
limitation, even though no detailed information regarding the
mechanism was given. Watanabe et al. (2003) reported that
ZrO2 acts as a basic catalyst in supercritical water. Roberts et al.
(2010a) showed that alkali catalysts, including K2CO3, affect the
reaction pathways in the cleavage of aryl–alkyl bonds of benzyl
phenyl ether, which was selected as a model compound for lignin
depolymerisation. In another study related to lignin depolymer-
isation, Roberts et al. (2010b) proposed a synergic positive effect
of ZrO2 and K2CO3 in near and supercritical water in the cleavage
of aryl-aryl ether bonds of diphenyl ether and in the suppression
of side reactions. Moreover, good results in terms of bio-oil pro-
duction have been obtained by using ZrO2 and K2CO3 on bio-
masses different from lignin (Hammerschmidt et al., 2011; Toor
et al., 2012) as well as on lignin (Nguyen et al., 2014). In the work
of Nguyen et al. (2014) in particular, the feasibility of the contin-
uous conversion of Kraft Lignin into bio-oil and phenolic chemi-
cals was demonstrated in a small pilot unit, where the reaction
in NCW was carried out at 25 MPa and 350 °C, using ZrO2 and
K2CO3 as the catalytic system and phenol as the co-solvent. The
influence of the concentration of K2CO3 was studied; the yields
of 1-ring aromatic compounds that increased from 17% to 27%
as the mass fraction of K2CO3 was increased from 0.4% to 2.2%,
together with a relatively low amount of char (about 20%) were
obtained. Among the other process parameters that play a key
role, the reaction temperature is surely one of the most impor-
tant, due to its effect on the reaction kinetics, chemical equilib-
rium and properties of NCW. For instance, a large variation in
the yields of different product fractions in the lignin conversion
in NCW was observed by several investigators (Beauchet et al.,
2012; Lavoie et al., 2011; Pin´ kowska et al., 2012; Yong and
Matsumura, 2013).
In the present study, the conversion of LignoBoost Kraft lignin in
NCW was carried out at reaction temperatures varying from 290 to
370 °C, while all the other parameters were kept at the same values
used previously (Nguyen et al., 2014).
2. Methods
2.1. Materials
The Kraft lignin used in this work came from softwood and
was produced in the LignoBoost demonstration plant in Bäck-
hammar, Sweden. The characterisation methods and analytical
results related to this lignin are reported in the previous work
of Nguyen et al. (2014). In summary, its moisture content was
32.6% and the carbon, hydrogen, sulphur and ash contents were
65.6%, 5.7%, 1.85% and 0.8%, respectively. Oxygen comprised
approximately 26% (calculated value), the Higher Heat Value
(HHV) was 27.7 MJ/kg and the mass fraction of aromatic and ali-
phatic groups was 78% and 22%, respectively. The mass average
molar-mass (Mw) of this lignin was 3900 g/mol, with a molar-
mass dispersity of 5.6. The feed slurry, which was prepared prior
to each experimental run, was composed of deionised (DI) water,
lignin, potassium carbonate (K2CO3) and phenol. The mass frac-
tion of the solutes was as follows: lignin 5.5% (dry basis), phenol
4.1% and K2CO3 1.6%. The resulting feed pH was 9.1. The zirconia
(ZrO2) pellets (length: 3 mm, diameter: 3 mm, BET surface area
48 m2
/g) used as the heterogeneous catalyst came from Harshaw
Chemie BV. Further details regarding the preparation of the feed
slurry, together with the specifications of the chemicals used in
the analytical procedures, are reported in Nguyen et al. (2014).
In addition to these chemicals, the analytical standards from
Sigma–Aldrich were used in this work: anisole (P99.65%), phenol
(P99.5%), o-cresol (P99%), m-cresol (99%), p-cresol (P99.0%),
guaiacol (P98.0%), catechol (P99%), syringol (P98.5%),
4-methylguaiacol (P98%), hydrocoumarin (99%) and 4-hydroxy-
benzaldehyde (98%). All chemicals were used without further
purification.
T.D.H. Nguyen et al. / Bioresource Technology 170 (2014) 196–203 197
3. 2.2. Apparatus and procedure
Fig. 1 is a schematic flow sheet of the conversion process used in
this work. During the experimental runs, the feed slurry was
pumped continuously at a flow rate of 1 kg/h from a 10 L stirred
tank, which was kept at 40 °C. Prior to entering the reactor, the
feed was preheated to 80 °C and then mixed with the recirculation
stream of reaction products. A high-pressure high-temperature
pump was used for recirculation. The recycle-to-feed ratio was
set at approximately 10, with the exception of the run at the high-
est reaction temperature (i.e. 370 °C), where this value was set at 2,
because operational problems prevented it from being kept at
higher values. The mixture then passed through another heater
that adjusted its temperature to the reaction temperature which,
in this series of tests, was varied from 290 and 370 °C. The reaction
pressure was fixed at 25 MPa in all runs. The reaction mixture was
in contact with the solid catalyst while flowing upwards in the
500 cm3
fixed-bed reactor that was equipped with an electrically
heated jacket. The free volume of the reactor charged with the cat-
alysts was 294 cm3
, which gave a reaction residence time (s) in the
range of 10–13 min, depending on the temperature of the reactor.
The reaction products were cooled down and depressurised to
ambient conditions through two pressure control valves installed
in parallel.
The liquid products were collected continuously in sampling
bottles, whilst gas production was not significant. The same behav-
iour was also observed in previous experimental runs carried out
at 350 °C for various K2CO3 concentrations (Nguyen et al., 2014).
In all of the runs it was observed that, after approximately 2 h from
the start, the operating parameters of the plant, the pH of the aque-
ous phase and the visual appearance of the products in the sam-
pling bottles were all steady. The plant was run for an additional
time in the range of 2–3 h once the steady state was reached before
shut-down operations began. The plant was cleaned, the reactor
disassembled and the char deposited on the catalyst measured
after the end of each experimental run.
Several liquid product samples were taken during the steady-
state operation. These product samples consisted of two distinct
liquid phases: aqueous and oil. They were separated by using a
centrifugation operating at 492 rad/s for 3 h and at 25 °C. Centrifu-
gation gave a fairly transparent aqueous phase and a heavier oil
phase of high viscosity (lignin-oil). All of the aqueous samples were
mixed into one single aqueous sample in order to obtain a larger
single sample for the analytical procedures; the same was done
with the oil samples. These samples thus represent the average
values during the steady-state period. The high viscosity of the
oil meant that it had to be dissolved in tetrahydrofuran (THF) to
achieve complete recovery. THF was then evaporated in a rotary
vacuum evaporator at temperatures never exceeding 35 °C. Details
of the equipment, pH measurements and procedure for quantitat-
ing the char deposited on the catalyst are provided in the previous
work of Nguyen et al. (2014).
2.3. Analytical methods
A block diagram showing the various steps of the analytical
methods applied to the liquid products is shown in Fig. 2. For each
experimental run, a sample of aqueous phase obtained after centri-
fugation was withdrawn and used for Total Carbon (TC) and Total
Organic Carbon (TOC) analyses, which were carried out at Statens
Provningsanstalt, Sveriges Tekniska Forskningsinstitut (SP, Borås,
Sweden). Another sample was first subjected to acidification to a
pH in the range of 1.5–2.0 and then to extraction with diethyl ether
(DEE), using a solvent-to-feed ratio (S/F) equal to 1. The acidificat-
ion led to further clarification of the aqueous phase but gave rise to
small amounts of additional liquid phases: some heavier black
drops at the bottom and a lighter yellowish phase at the top, both
of which were separated from the aqueous phase. These additional
phases were, however, not analysed because the amounts were
very small at all reaction temperatures. The gas that was released
from the solution during the acidification, on the other hand, was
quantified gravimetrically. Its amount was found to be about the
same as the amount of carbon dioxide expected to be formed from
the carbonates added as K2CO3. An internal standard (IST) was
added to the acidified aqueous phase, prior to the extraction with
DEE. The DEE-extract was analysed using Gas Chromatography
(GC, Agilent 7890A) coupled with Mass Spectrometry (MS, Agilent
5975C). The main compounds were identified through the NIST MS
Search Program (version 2.0) operating on the NIST/EPA/NIH Mass
Spectral Database 2011 (NIST 11) and confirmation using analyti-
cal standards was carried out in selected cases. In addition, the
compounds identified were quantitated on the basis of the IST.
Syringol was selected as the IST since it is not a unit present in soft-
wood lignin; it is not produced in the reaction but is very similar to
the reaction products.
Fig. 1. Schematic flow sheet of the conversion process in near-critical water.
198 T.D.H. Nguyen et al. / Bioresource Technology 170 (2014) 196–203
4. For each experimental run, a few samples of lignin-oil obtained
after centrifugation were withdrawn prior to THF removal. These
samples were subjected to Karl Fischer titration in order to deter-
mine their water content, and to a filtration process to determine
the amount of THF-insoluble Suspended Solids (SS). The filtration
was carried out in two steps, using Duran glass filters P2 (nominal
maximum pore size 40–100 lm) in the first and P4 (nominal max-
imum pore size 10–16 lm) in the second. In this way, both the
amount of solids retained and a rough indication of their size dis-
tribution could be determined. In addition, a sample of lignin-oil
was withdrawn after the evaporation of THF and analysed at SP
in order to determine the elemental composition and HHV. Fur-
thermore, an additional sample of THF-free lignin-oil was with-
drawn, extracted with DEE (S/F approximately 34/1) and mixed
with a known amount of IST. The DEE-soluble fraction was ana-
lysed through GC–MS and the main compounds were identified
and quantified. Further details on the analytical procedures can
be found in Nguyen et al. (2014).
3. Results and discussion
The total carbon balance is calculated based on the results pre-
sented below, i.e. including phenol and inorganic carbon. In these
calculations the carbon content of char is assumed to be the same
as that of dry lignin. It is found that the sum of output and accumu-
lated carbon accounts for between 97 and 103% of the carbon
input. On the whole, these results show that a very reliable carbon
balance was obtained in all runs.
3.1. The liquid products after centrifugation
After centrifugation, the liquid products were composed of two
distinct phases: one aqueous and the other oil. The visual appear-
ance of the former was dark yellowish and the latter black. The
steady-state characteristics that refer to both phases are provided
in Table 1, along with the TC and TOC of the aqueous phase.
As can be seen, the fraction of oil in the exit product stream
decreases from 6.6% to 4.9% as the reaction temperature increases
from 290 to 370 °C. Also, the reaction leads to a decrease in pH,
from 9.1 (pH of the feed slurry) to values decreasing from 8.5 to
7.9 (pH of the aqueous phase after centrifugation), as the reaction
temperature increases. The concentration of organic carbon in the
aqueous phase is between 25 and 27 g/L. Since the density of the
aqueous phase is approximately 1000 kg/m3
, this also means that
the organic carbon mass fraction in the aqueous phase is in the
range of 2.5–2.7%. The TC values are slightly higher than the TOC.
3.2. Aqueous phase
Table 2 reports the mass fraction of the compounds identified
by GC–MS of the DEE-extract of the acidified aqueous phase,
together with total values including, and excluding, phenol.
Besides phenol, which is used in feed, the main compounds
detected are alkylphenols (e.g. cresols), guaiacols (i.e. guaiacol
and alkylguaiacols) and catechols (i.e. catechol and alkylcatechols).
Other phenolic compounds detected are 3-methoxycatechol, sali-
cylic acid, 4-hydroxybenzaldehyde, dimethylbenzenediol, vanillin,
acetovanillone and three phenolic dimers with structure C6–C1–
C6. Alkyl side groups of aromatic rings are of methyl or ethyl type
only. Moreover, three non-phenolic aromatic compounds are found
(i.e. anisole, 2-coumaranone and hydrocoumarin), together with
small amounts of methanol, acetic acid, 2-butanone and propanoic
acid. It was assumed that the phenolic compounds derived from
the original lignin or from the reaction between phenol and lignin
Fig. 2. Block diagram of the analytical methods used for the liquid products.
Table 1
Steady-state output data of the experimental runs at different reaction temperatures.
Steady-state output data 290 °C 310 °C 330 °C 350 °C 370 °C
Oil/totala
(%) 6.6 6.0 5.8 5.3 4.9
pHa
b
8.5 8.2 8.2 8.0 7.9
TCb
(g/L) 27 28 27 29 28
TOCb
(g/L) 25 26 25 27 26
a
Oil/total is the ratio of the output mass flow rate of oil and the sum of the
output mass flow rate of oil and aqueous phase.
b
pHa, TC and TOC indicate pH, total carbon and total organic carbon in aqueous
phase after centrifugation.
T.D.H. Nguyen et al. / Bioresource Technology 170 (2014) 196–203 199
5. decomposition products (Okuda et al., 2004). Also, we have previ-
ously demonstrated that they derive from the chemical conversion
of lignin in near-critical water (350 °C, 25 MPa) using the same cat-
alytic system (ZrO2/K2CO3) and in the presence of phenol as co-sol-
vent (Nguyen et al., 2014).
Regarding the variation in composition resulting from the reac-
tion temperature, the mass fractions of catechols and alkylphenols
increase as the reaction temperature increases, whereas those of
guaiacols and phenolic dimers decrease (see Table 3). The mass
fractions of vanillin and acetovanillone also decrease with increas-
ing reaction temperature even though the amounts detected are
small; these two compounds are not detected in the two runs at
the higher temperatures (i.e. 350 and 370 °C) (see Table 2). In the
range of temperature under investigation, the same qualitative
trends regarding guaiacol and catechol are reported in the litera-
ture that refer to different types of lignin and different conversion
processes in NCW (Lavoie et al., 2011; Beauchet et al., 2012;
Pin´ kowska et al., 2012). In summary, the total mass fraction of
water-soluble organic compounds (excluding phenol) in the aque-
ous phase clearly increases as the reaction temperature increases
(see Table 2).
3.3. Lignin-oil
The oil phase in the products decreases from 6.6% to 4.9% (with
respect to the total liquid output) as the reaction temperature
increases from 290 to 370 °C (see Table 1). The oil was separated
from the aqueous phase by means of centrifugation and its water
content was measured; it was also measured after THF was
removed by means of vacuum evaporation at a temperature not
exceeding 35 °C. As shown in Table 4, a relatively large reduction
in the water content in each run (from 49% to 88%) was achieved
by removing the solvent.
Table 2
Mass fraction (%) of compounds identified by GC–MS in the acidified aqueous phase. LOD: limit of detection.
Compound 290 °C 310 °C 330 °C 350 °C 370 °C
1 Methanol 0.002 0.003 0.003 0.004 0.003
2 Acetic acid 0.005 0.005 0.006 0.006 0.007
3 2-Butanone 0.004 0.007 0.006 0.004 0.006
4 Propanoic acid 0.002 0.002 0.002 0.002 0.003
5 Anisole 0.014 0.021 0.031 0.001 0.030
6 Phenol 1.806 1.714 1.639 1.964 1.702
7 o-Cresol 0.006 0.016 0.037 0.067 0.109
8 m/p-Cresola
0.010 0.026 0.057 0.099 0.134
9 Guaiacol 0.123 0.104 0.068 0.054 0.022
10 2-Ethylphenol 0.002 0.004 0.007 0.010 0.013
11 Dimethylphenol 0.001 0.001 0.003 0.005 0.010
12 4-Ethylphenol 0.006 0.010 0.014 0.020 0.023
13 4-Methylguaiacol 0.002 0.003 0.003 0.003 0.001
14 Catechol 0.065 0.101 0.148 0.193 0.191
15 2-Coumaranone 0.004 0.003 0.002 LOD 0.001
16 3-Methoxycatechol 0.003 0.002 0.002 0.006 0.001
17 3-Methylcatechol 0.001 0.002 0.006 0.013 0.019
18 4-Ethylguaiacol 0.001 0.001 0.001 LOD 0.001
19 4-Methylcatechol 0.004 0.014 0.035 0.051 0.054
20 Salicylic acid 0.004 0.006 0.008 0.002 0.004
21 Syringolb
– – – – –
22 4-Hydroxybenzaldehyde 0.003 0.002 0.002 0.001 0.002
23 Hydrocoumarin 0.001 0.001 0.001 0.003 0.002
24 4-Ethylcatechol 0.002 0.005 0.011 0.016 0.014
25 Vanillin 0.004 0.002 0.001 LOD LOD
26 Dimethylbenzenediol LOD 0.001 0.002 0.002 0.002
27 Acetovanillone 0.002 0.001 0.001 LOD LOD
28–30 Phenolic dimers (C6–C1–C6) 0.016 0.015 0.007 0.006 0.001
Total mass fraction including phenol 2.093 2.072 2.103 2.532 2.355
Total mass fraction excluding phenol 0.287 0.358 0.464 0.568 0.653
a
p-Cresol and m-Cresol elute together.
b
Internal standard.
Table 3
Mass fractions (%) of the main classes of compounds of the acidified aqueous phase and the DEE-soluble fraction of the lignin-oil.
Data referring the oil are reported on a dry lignin-oil basis (i.e. THF-free and water-free basis).
Class 290 °C 310 °C 330 °C 350 °C 370 °C
Aqueous phase Phenol 1.81 1.71 1.64 1.96 1.70
Alkylphenols 0.03 0.06 0.12 0.20 0.29
Guaiacols 0.13 0.11 0.07 0.06 0.02
Catechols 0.07 0.12 0.20 0.27 0.28
Phenolic dimers 0.02 0.02 0.01 0.01 0.00
Lignin-oil Anisoles 2.04 3.09 4.72 5.33 6.17
Phenol 11.51 9.77 12.44 12.80 11.35
Alkylphenols 0.95 1.61 3.60 5.83 7.75
Guaiacols 2.55 2.26 2.16 2.00 1.02
Catechols 0.14 0.25 0.19 0.42 0.62
Phenolic dimers 5.08 4.08 2.27 1.84 1.03
200 T.D.H. Nguyen et al. / Bioresource Technology 170 (2014) 196–203
6. Table 4 also reports the THF-insoluble SS in the lignin-oil. The
SS values referring to the mass of the retained solids on the filters
P2 and P4 are reported as mass fraction on a dry lignin-oil basis
(i.e. THF-free and water-free basis). The total mass of the retained
solids (P2 and P4) is also given. Although there is no clear trend of
the total amount of SS, the data clearly show that, whereas the
fraction of SS with larger size (i.e. retained on filter P2) is high at
the lower temperatures (290 and 310 °C), it is quite low from
330 °C upwards. However, fine particles predominate above
330 °C. A minimum value of SS was obtained at 330 °C (8.6%),
the reason for which is not known.
Following evaporation an elemental analysis was made on each
oil sample, and the ash content and heat value were measured.
These results are reported on a dry lignin-oil basis in Table 5.
The oil obviously has a higher content of carbon compared to dry
lignin and has been partially deoxygenated; its carbon content also
increases with the reaction temperature. On average, the heat
value of the dry lignin-oil is 14% higher than that of dry lignin. Also,
the sulphur content is reduced, on average, from 1.85% to 0.42%.
Table 6 reports the mass fractions of compounds in the DEE-sol-
uble fraction of lignin-oil samples as well as the total values
including, and excluding, phenol. The DEE-soluble fraction of lig-
nin-oil that is identified by GC–MS is in the range of 21–29% of
the total oil, and contains a large amount of 1-ring aromatic com-
pounds. As reaction temperature increases from 290 to 370 °C,
phenol increases from 10% to 13% (on dry lignin-oil basis), anisoles
increase from 2% to 6%, alkylphenols increase from 1% to 8%, cate-
chols increase from 0.1% to 0.6% but guaiacols, on the other hand,
Table 4
Water content and THF-insoluble suspended solids in the lignin-oil. The water mass fraction (%) in the lignin-oil is given before
and after vacuum evaporation to remove THF. The suspended solids, retained on filters P2 and P4, are given as mass fraction (%)
on a dry lignin-oil basis.
290 °C 310 °C 330 °C 350 °C 370 °C
Water content before evaporation 19.2 10.9 15.2 14.1 13.3
Water content after evaporation 9.8 1.3 2.4 2.0 2.1
Suspended solids on P2 21.2 14.0 0.3 0.6 1.9
Suspended solids on P4 2.6 11.4 8.3 22.2 11.3
Total suspended solids 23.8 25.4 8.6 22.8 13.2
Table 5
Elemental composition (as mass fraction) and HHV of the lignin-oil obtained from the
conversion of LignoBoost Kraft lignin in near-critical water. Data are reported on
water-free oil; oxygen is calculated by difference.
Elemental composition (%) 290 °C 310 °C 330 °C 350 °C 370 °C
C 70.0 72.6 73.9 74.9 76.0
H 6.5 6.4 6.1 6.6 6.8
N – 0.1 0.1 0.1 0.1
S 0.41 0.51 0.56 0.38 0.25
Cl 0.01 0.01 0.01 0.01 0.01
Ash 2.4 2.0 2.4 2.8 1.8
O 21 18 17 15 15
Na 0.0110 0.0070 0.0100 0.0100 0.0057
K 1.5 1.4 1.7 1.6 1.4
HHV (MJ/kg) 31.66 31.12 31.03 31.90 32.73
Table 6
Mass fraction (%) of compounds identified by GC–MS in the DEE-soluble fraction of the lignin-oil. Data based on dry lignin-oil are reported. LOD: limit of detection.
Compound 290 °C 310 °C 330 °C 350 °C 370 °C
1 Anisole 1.964 2.897 4.173 4.414 4.966
2 Phenol 11.505 9.772 12.436 12.797 11.351
3 2-Methylanisole 0.011 0.032 0.098 0.173 0.273
4 4-Methylanisole 0.023 0.074 0.242 0.409 0.570
5 o-Cresol 0.101 0.222 0.662 1.158 1.823
6 p/m-Cresola
0.187 0.413 1.167 1.923 2.533
7 2-Ethylanisole 0.007 0.018 0.047 0.094 0.128
8 Guaiacol 2.226 1.820 1.586 1.344 0.611
9 4-Ethylanisole 0.031 0.066 0.156 0.238 0.232
10 2-Ethylphenol 0.100 0.163 0.321 0.511 0.637
11 Dimethylphenol 0.137 0.165 0.253 0.402 0.605
12 2-Acetylphenol 0.080 0.093 0.104 0.156 0.114
13 4-Ethylphenol 0.315 0.473 0.848 1.200 1.278
14 5-Methylguaiacol 0.018 0.047 0.105 0.146 0.103
15 4-Methylguaiacol 0.118 0.167 0.230 0.253 0.145
16 Catechol 0.096 0.115 0.097 0.181 0.212
17 2-Propylphenol 0.014 0.024 0.049 0.088 0.126
18–19 Ethylcresols 0.022 0.045 0.119 0.259 0.409
20 4-Propylphenol 0.077 0.109 0.181 0.288 0.341
21 4-Ethylguaiacol 0.155 0.180 0.193 0.204 0.120
22 4-Methylcatechol 0.017 0.059 0.039 0.122 0.219
23 Syringolb
– – – – –
24 4-Propylguaiacol 0.031 0.041 0.048 0.050 0.038
25 4-Ethylcatechol 0.026 0.078 0.051 0.113 0.191
26 9H-Xanthene 0.129 0.195 0.103 0.100 0.346
27–28, 31 Phenolic dimers (C6–C1–C6) 3.973 3.254 1.760 1.357 0.665
29–30, 32–33 Phenolic dimers (C6–C2–C6) 1.104 0.822 0.513 0.485 0.366
34 Isopropyl-methyl-phenanthrene 0.073 0.127 0.182 0.242 0.264
Total mass fraction including phenol 22.54 21.47 25.76 28.71 28.67
Total mass fraction excluding phenol 11.04 11.70 13.33 15.91 17.32
a
p-Cresol and m-Cresol elute together.
b
Internal standard.
T.D.H. Nguyen et al. / Bioresource Technology 170 (2014) 196–203 201
7. decrease from 3% to 1%. A large amount of phenolic dimers are also
found (decreasing from 5% to 1%) with a C6–C1–C6 or C6–C2–C6
structure. Most of the compounds in the DEE-soluble fraction of
lignin-oil are the same as in the aqueous phase, but the relative
concentration differs depending on their hydrophilic or hydropho-
bic nature. Catechol, for example, is relatively more abundant in
the aqueous phase, whereas anisole is relatively more abundant
in the oil. In addition, some compounds not found in the aqueous
phase are identified in the DEE-soluble fraction of lignin-oil, as in
the case of alkylanisoles, 1-ring aromatic compounds with propyl
side groups, ethylcresols, acetylphenol, and two 3-ring compounds.
The total mass fraction of DEE-soluble compounds in lignin-oil
increases as the reaction temperature increases; with regard to
specific classes of compounds, the amount of anisoles, alkylphe-
nols, and catechols increases whilst that of guaiacols decreases
(see Table 3). These trends are also found for the water-soluble
compounds in the aqueous phase.
3.4. Product yields and carbon balances
Product yields are calculated taking three different products
into consideration: dry lignin-oil (OIL), water-soluble organics in
the acidified aqueous phase (WSO) and char (CHAR). The corre-
sponding yields (Y) are defined here as the mass of phenol-free
products relative to the mass of dry lignin fed to the system (see
Fig. 3). The calculations are made assuming that the average rate
of char formation during the entire run (i.e. start-up, steady-state
and cooling down) is equal to the rate of formation at steady-state.
The yield of the main classes of 1-ring aromatic compounds is also
calculated, taking into account the quantities found in both the
aqueous and the oil phase (see Fig. 4).
As can be seen in Fig. 3, the yield of dry lignin-oil is around 85–
88% at the two lower reaction temperatures (290 and 310 °C), but
decreases down to 69% as the reaction temperature increases (up
to 370 °C). On the other hand, both the char and the water-soluble
organics increase with an increase in reaction temperature. More
specifically, YCHAR increases from 16% to 22% and YWSO increases
from 5% to 11% as the reaction temperature increases from 290
to 370 °C.
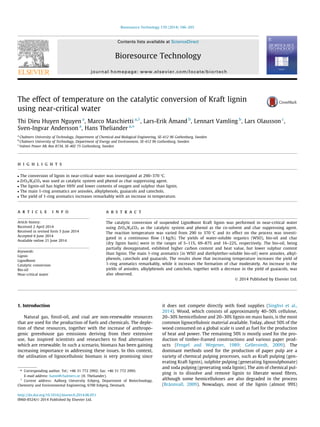
Besides analysing the yields of the different product fractions, it
is also interesting to examine the overall yield (aqueous phase and
lignin-oil) of specific classes of 1-ring aromatic compounds and
phenolic dimers (see Fig. 4a). The overall yield increases remark-
ably as the reaction temperature increases (290–370 °C), varying
from 10% to 23%. In particular, a larger relative increase is found
for alkylphenols (from 14 to 110 g/kg); anisoles and catechols
increase moderately, whilst the maximum yield of guaiacols is
0
20
40
60
80
100
270 290 310 330 350 370 390
Y (%)
Reaction temperature (oC)
OIL WSO CHAR
Fig. 3. Yields (Y) of oil (OIL), water-soluble organics in the acidified aqueous phase
(WSO) and char (CHAR) as a function of the reaction temperature. Yields are defined
on phenol-free dry reaction products on a dry lignin basis.
0
2
4
6
8
10
12
290 310 330 350 370
Y (%)
Reaction temperature (oC)
(a)
Anisoles Alkylphenols Guaiacols Catechols Phenolic dimers
0
2
4
6
8
10
12
0.4 1.0 1.6 2.2
Y (%)
K2CO3 (%)
(b)
Anisoles Alkylphenols Guaiacols Catechols Phenolic dimers
Fig. 4. Yields (Y) of different classes of aromatic compounds (in water-soluble organics and DEE-soluble lignin-oil) as a function of (a) the reaction temperature (at K2CO3
mass fraction of 1.6% and (b) K2CO3 mass fraction (at the reaction temperature of 350 °C). Yields are on a dry lignin basis.
202 T.D.H. Nguyen et al. / Bioresource Technology 170 (2014) 196–203
8. found at the lowest reaction temperature (290 °C). The comparison
with the yields obtained when varying the mass fraction of K2CO3
(Nguyen et al., 2014), reported in Fig. 4b, shows some interesting
features. The increase of the K2CO3 mass fraction and the reaction
temperature have the same effect on the yields of all the product
fractions (i.e. the amount of anisoles, alkylphenols and catechols
increases but that of guaiacols decreases), with the exception of
the phenolic dimers. More specifically, the yield of the phenolic
dimers increases with the K2CO3 mass fraction (see Fig. 4b),
whereas it decreases with increasing the reaction temperature. In
addition, it is observed that the reaction temperature has a rela-
tively large effect on alkylphenols, whereas K2CO3 has a relatively
large effect on anisoles.
Approximate mass balances of phenol were also carried out in
order to provide an insight of the role of phenol in the reaction.
The output flow rate of phenol was estimated taking into account
the amount of phenol in the DEE-extracts of the acidified aqueous
phase and the amount of phenol in the DEE-soluble fraction of the
oil. Considering both the experimental runs of this work and those
previously published (Nguyen et al., 2014), it was found that the
phenol consumption is in the range of 35–49% of the phenol input.
These values may represent an overestimation of the real phenol
consumption, since there could be some phenol in the residual
fractions not extracted with DEE. However, these values support
the hypothesis that part of the phenol fed to the reactor reacts with
the active fragments deriving from lignin.
The elemental analysis of the oil samples was used to calculate
the ratio of potassium ending up in the wet oil to potassium that
enters the system. It was found that this value is in the range of
6.5–9.2%, with no clear trend with respect to the reaction temper-
ature. This range coincides approximately to that found when the
reactor was operated at 350 °C, varying the mass fraction of
K2CO3 (Nguyen et al., 2014). On the whole, in the ranges of the
operating variables that were tested, the amount of potassium in
the oil is quite constant at values in the range of approximately
7% to 9%.
4. Conclusions
The products obtained from the conversion of LignoBoost Kraft
lignin in NCW consist of water-soluble organics (WSO), lignin-oil
and char. As the reaction temperature increases (290–370 °C),
the yield of WSO increases (5–11%), lignin-oil decreases (87–69%)
and char increases (16–22%). The lignin-oil, being partially deoxy-
genated, has higher carbon content and HHV; and lower sulphur
content than lignin. The main 1-ring aromatics (in WSO and DEE-
soluble lignin-oil) are anisoles, alkylphenols, guaiacols and cate-
chols. The yield of 1-ring aromatics increases remarkably with an
increase in temperature. In addition, the yield of alkylphenols is
very sensitive to the temperature.
Acknowledgements
We are grateful to Chalmers Energy Initiative – LignoFuel Pro-
ject, Valmet Power AB, The Swedish Energy Agency and the
research foundation Ångpanneförenings Forskningsstiftelse for
their financial support.
Our thanks go to Bengt Erichsen, Carina Olsson, Lena Elisabeth
Fogelquist and Tommy Friberg for their technical assistance.
Appendix A. Supplementary data
Supplementary data associated with this article can be found, in
the online version, at http://dx.doi.org/10.1016/j.biortech.2014.06.
051.
References
Andersen, K., 1989. Gasification process. DE 3806732 A1.
Andersen, K., 1990. Gasification process. EP 0402405 B1.
Azadi, P., Inderwildi, O.R., Farnood, R., King, D.A., 2013. Liquid fuels, hydrogen and
chemicals from lignin: a critical review. Renew. Sustain. Energy Rev. 21, 506–
523.
Bhaskar, T., Sera, A., Muto, A., Sakata, Y., 2008. Hydrothermal upgrading of wood
biomass: influence of the addition of K2CO3 and cellulose/lignin ratio. Fuel 87,
2236–2242.
Beauchet, R., Monteil-Rivera, F., Lavoie, J.-M., 2012. Conversion of lignin to
aromatic-based chemicals (L-chems) and biofuels (L-fuels). Bioresour.
Technol. 121, 328–334.
Brännvall, E., 2009. Overview of pulp and paper processes. In: Ek, M., Gellerstedt, G.,
Henriksson, G. (Eds.), Pulp and Paper Chemistry and Technology, vol. 2, Pulping
Chemistry and Technology. Walter de Gruyter, Berlin, Germany.
Brunner, G., 2009. Near critical and supercritical water. Part I. Hydrolytic and
hydrothermal processes. J. Supercrit. Fluids 47, 373–381.
Carr, A.G., Mammucari, R., Foster, N.R., 2011. A review of subcritical water as a
solvent and its utilisation for the processing of hydrophobic organic
compounds. Chem. Eng. J. 172, 1–17.
Eckert, C.A., Chandler, K., 1998. Tuning fluid solvents for chemical reactions. J.
Supercrit. Fluids 13, 187–195.
Fang, Z., Sato, T., Smith Jr., R.L., Inomata, H., Arai, K., Kozinski, J.A., 2008. Reaction
chemistry and phase behavior of lignin in high-temperature and supercritical
water. Bioresour. Technol. 99, 3424–3430.
Fengel, D., Wegener, G., 1989. Wood: Chemistry, Ultrastructure, Reactions. Walter
de Gruyter, Berlin, New York.
Gellerstedt, G., 2009. The worldwide wood resource. In: Ek, M., Gellerstedt, G.,
Henriksson, G. (Eds.), Pulp and Paper Chemistry and Technology, vol. 1,
Wood Chemistry and Wood Biotechnology. Walter de Gruyter, Berlin,
Germany.
Hammerschmidt, A., Boukis, N., Hauer, E., Galla, U., Dinjus, E., Hitzmann, B., Larsen,
T., Nygaard, S.D., 2011. Catalytic conversion of waste biomass by hydrothermal
treatment. Fuel 90, 555–562.
Henriksson, G., 2009. Lignin. In: Ek, M., Gellerstedt, G., Henriksson, G. (Eds.), Pulp
and Paper Chemistry and Technology, vol. 1, Wood Chemistry and Wood
Biotechnology. Walter de Gruyter, Berlin, Germany.
Karagöz, S., Bhaskar, T., Muto, A., Sakata, Y., Oshiki, T., Kishimoto, T., 2005. Low-
temperature catalytic hydrothermal treatment of wood biomass: analysis of
liquid products. Chem. Eng. J. 108, 127–137.
Karagöz, S., Bhaskar, T., Muto, A., Sakata, Y., 2006. Hydrothermal upgrading of
biomass: effect of K2CO3 concentration and biomass/water ratio on products
distribution. Bioresour. Technol. 97, 90–98.
Lora, J., 2008. Industrial commercial lignins: sources, properties and applications.
In: Belgacem, M.N., Gandini, A. (Eds.), Monomers, Polymers and Composites
from Renewable Resources. Elsevier, Great Britain.
Lavoie, J.-M., Baré, W., Bilodeau, M., 2011. Depolymerization of steam-treated
lignin for the production of green chemicals. Bioresour. Technol. 102, 4917–
4920.
Nguyen, T.D.H., Maschietti, M., Belkheiri, T., Åmand, L.-E., Theliander, H., Vamling, L.,
Olausson, L., Andersson, S.-I., 2014. Catalytic depolymerisation and conversion
of Kraft lignin into liquid products using near-critical water. J. Supercrit. Fluids
86, 67–75.
Okuda, K., Umetsu, M., Takami, S., Adschiri, T., 2004. Disassembly of lignin and
chemical recovery-rapid depolymerization of lignin without char formation in
water–phenol mixtures. Fuel Process. Technol. 85, 803–813.
Pandey, M.P., Kim, C.S., 2011. Lignin depolymerisation and conversion: a review of
thermochemical methods. Chem. Eng. Technol. 34, 29–41.
Pin´ kowska, H., Wolak, P., Złocin´ ska, A., 2012. Hydrothermal decomposition of alkali
lignin in sub- and supercritical water. Chem. Eng. J. 187, 410–414.
Roberts, V., Fendt, S., Lemonidou, A.A., Li, X., Lercher, J.A., 2010a. Influence of alkali
carbonates on benzyl phenyl ether cleavage pathways in superheated water.
Appl. Catal. B 95, 71–77.
Roberts, V.M., Knapp, R.T., Li, X., Lercher, J.A., 2010b. Selective hydrolysis of diphenyl
ether in supercritical water catalyzed by alkaline carbonates. ChemCatChem 2,
1407–1410.
Singhvi, M.S., Chaudhari, S., Gokhale, D.V., 2014. Lignocellulose processing: a
current challenge. RSC Adv. 4, 7271–8277.
Theliander, H., 2008. Withdrawing lignin from black liquor by precipitation,
filtration and washing. In: 1st Nordic Wood Biorefinery Conference, pp. 36–42.
Tomani, P., 2010. The LignoBoost process. Cell. Chem. Technol. 44, 53–58.
Toor, S.S., Rosendahl, L., Nielsen, M.P., Glasius, M., Rudolf, A., Iversen, S.B., 2012.
Continuous production of bio-oil by catalytic liquefaction from wet distiller’s
grain with solubles (WDGS) from bio-ethanol production. Biomass Bioenergy
36, 327–332.
Vigneault, A., Johnson, D.K., Chornet, E., 2007. Base-catalyzed depolymerization of
lignin: separation of monomers. Can. J. Chem. Eng. 85, 906–916.
Watanabe, M., Osada, M., Inomata, H., Arai, K., Kruse, A., 2003. Acidity and basicity
of metal oxide catalysts for formaldehyde reaction in supercritical water at
673 K. Appl. Catal. A Gen. 245, 333–341.
Yong, T.L.-K., Matsumura, Y., 2013. Kinetic analysis of lignin hydrothermal
conversion in sub- and supercritical water. Ind. Eng. Chem. Res. 52, 5626–5639.
T.D.H. Nguyen et al. / Bioresource Technology 170 (2014) 196–203 203