Weitere ähnliche Inhalte
Ähnlich wie W Metrics (11)
W Metrics
- 1. Blake Taylor Taylor Real Estate
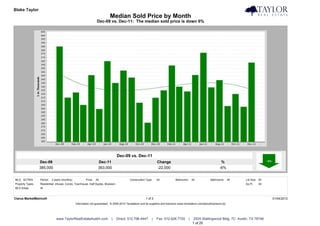
Median Sold Price by Month
Dec-09 vs. Dec-11: The median sold price is down 6%
Dec-09 vs. Dec-11
Dec-09 Dec-11 Change %
385,000 363,000 -22,000 -6%
MLS: ACTRIS Period: 2 years (monthly) Price: All Construction Type: All Bedrooms: All Bathrooms: All Lot Size: All
Property Types: Residential: (House, Condo, Townhouse, Half Duplex, Modular) Sq Ft: All
MLS Areas: W
Clarus MarketMetrics® 1 of 2 01/04/2012
Information not guaranteed. © 2009-2010 Terradatum and its suppliers and licensors (www.terradatum.com/about/licensors.td).
www.TaylorRealEstateAustin.com | Direct: 512.796.4447 | Fax: 512.628.7720 | 2525 Wallingwood Bldg. 7C Austin, TX 78746
1 of 20
- 2. Blake Taylor Taylor Real Estate
Median Sold Price by Month
Dec-09 vs. Dec-11: The median sold price is down 6%
Time Period Median Price # Units Average DOM
Dec-11 363,000 28 100
Nov-11 302,500 28 84
Oct-11 320,000 17 82
Sep-11 303,500 34 79
Aug-11 339,000 41 89
Jul-11 329,000 30 89
Jun-11 376,340 35 97
May-11 346,000 24 66
Apr-11 323,500 24 95
Mar-11 330,000 31 76
Feb-11 359,000 17 83
Jan-11 325,000 11 119
Dec-10 314,750 14 126
Nov-10 280,700 20 85
Oct-10 308,000 28 102
Sep-10 342,500 20 104
Aug-10 352,000 21 45
Jul-10 335,000 33 56
Jun-10 364,950 34 52
May-10 299,500 37 54
Apr-10 345,750 28 86
Mar-10 305,000 28 61
Feb-10 322,100 24 81
Jan-10 315,000 13 94
Dec-09 385,000 13 85
Clarus MarketMetrics® 2 of 2 01/04/2012
Information not guaranteed. © 2009-2010 Terradatum and its suppliers and licensors (www.terradatum.com/about/licensors.td).
www.TaylorRealEstateAustin.com | Direct: 512.796.4447 | Fax: 512.628.7720 | 2525 Wallingwood Bldg. 7C Austin, TX 78746
2 of 20
- 3. Blake Taylor Taylor Real Estate
Median For Sale vs. Median Sold
Dec-09 vs. Dec-11: The median price of for sale properties has not changed and the median price of sold properties is down
Dec-09 vs. Dec-11 Dec-09 vs. Dec-11
Dec-09 Dec-11 Change % Dec-09 Dec-11 Change %
397,000 397,000 0 0% 385,000 363,000 -22,000 -6%
MLS: ACTRIS Period: 2 years (monthly) Price: All Construction Type: All Bedrooms: All Bathrooms: All Lot Size: All
Property Types: Residential: (House, Condo, Townhouse, Half Duplex, Modular) Sq Ft: All
MLS Areas: W
Clarus MarketMetrics® 1 of 2 01/04/2012
Information not guaranteed. © 2009-2010 Terradatum and its suppliers and licensors (www.terradatum.com/about/licensors.td).
www.TaylorRealEstateAustin.com | Direct: 512.796.4447 | Fax: 512.628.7720 | 2525 Wallingwood Bldg. 7C Austin, TX 78746
3 of 20
- 4. Blake Taylor Taylor Real Estate
Median For Sale vs. Median Sold
Dec-09 vs. Dec-11: The median price of for sale properties has not changed and the median price of sold properties is down
For Sale # Properties Sold # Properties Price
Time Period Median For Sale Median Sold Difference
Dec-11 397,000 136 363,000 28 -34,000
Nov-11 389,700 156 302,500 28 -87,200
Oct-11 389,500 159 320,000 17 -69,500
Sep-11 375,000 179 303,500 34 -71,500
Aug-11 364,900 199 339,000 41 -25,900
Jul-11 364,900 223 329,000 30 -35,900
Jun-11 365,500 226 376,340 35 10,840
May-11 391,250 220 346,000 24 -45,250
Apr-11 380,000 209 323,500 24 -56,500
Mar-11 379,500 196 330,000 31 -49,500
Feb-11 375,000 175 359,000 17 -16,000
Jan-11 380,000 165 325,000 11 -55,000
Dec-10 372,495 154 314,750 14 -57,745
Nov-10 369,900 177 280,700 20 -89,200
Oct-10 372,445 206 308,000 28 -64,445
Sep-10 379,450 232 342,500 20 -36,950
Aug-10 379,900 260 352,000 21 -27,900
Jul-10 379,900 279 335,000 33 -44,900
Jun-10 384,900 283 364,950 34 -19,950
May-10 394,500 259 299,500 37 -95,000
Apr-10 392,250 254 345,750 28 -46,500
Mar-10 399,900 220 305,000 28 -94,900
Feb-10 395,000 185 322,100 24 -72,900
Jan-10 389,500 177 315,000 13 -74,500
Dec-09 397,000 186 385,000 13 -12,000
Clarus MarketMetrics® 2 of 2 01/04/2012
Information not guaranteed. © 2009-2010 Terradatum and its suppliers and licensors (www.terradatum.com/about/licensors.td).
www.TaylorRealEstateAustin.com | Direct: 512.796.4447 | Fax: 512.628.7720 | 2525 Wallingwood Bldg. 7C Austin, TX 78746
4 of 20
- 5. Blake Taylor Taylor Real Estate
Sold Properties by Month
Dec-09 vs. Dec-11: The number of Sold properties is up 115%
Dec-09 vs. Dec-11
Dec-09 Dec-11 Change %
13 28 15 +115%
MLS: ACTRIS Period: 2 years (monthly) Price: All Construction Type: All Bedrooms: All Bathrooms: All Lot Size: All
Property Types: Residential: (House, Condo, Townhouse, Half Duplex, Modular) Sq Ft: All
MLS Areas: W
Clarus MarketMetrics® 1 of 2 01/04/2012
Information not guaranteed. © 2009-2010 Terradatum and its suppliers and licensors (www.terradatum.com/about/licensors.td).
www.TaylorRealEstateAustin.com | Direct: 512.796.4447 | Fax: 512.628.7720 | 2525 Wallingwood Bldg. 7C Austin, TX 78746
5 of 20
- 6. Blake Taylor Taylor Real Estate
Sold Properties by Month
Dec-09 vs. Dec-11: The number of Sold properties is up 115%
Full Market Bank Properties Non-Bank Properties
Time Period # Properties Median Price Average DOM # Properties % Bank Median Price # Properties % Non-Bank Median Price
Dec-11 28 363,000 100 1 3.6 375,000 27 96.4 351,000
Nov-11 28 302,500 84 3 10.7 646,500 25 89.3 298,000
Oct-11 17 320,000 82 0 17 100.0 320,000
Sep-11 34 303,500 79 2 5.9 270,204 32 94.1 303,500
Aug-11 41 339,000 89 2 4.9 368,300 39 95.1 339,000
Jul-11 30 329,000 89 1 3.3 210,000 29 96.7 333,000
Jun-11 35 376,340 97 3 8.6 390,000 32 91.4 370,170
May-11 24 346,000 66 2 8.3 250,000 22 91.7 346,000
Apr-11 24 323,500 95 1 4.2 180,000 23 95.8 350,000
Mar-11 31 330,000 76 5 16.1 310,000 26 83.9 334,000
Feb-11 17 359,000 83 1 5.9 365,000 16 94.1 357,000
Jan-11 11 325,000 119 2 18.2 479,500 9 81.8 325,000
Dec-10 14 314,750 126 1 7.1 304,500 13 92.9 325,000
Nov-10 20 280,700 85 2 10.0 224,700 18 90.0 283,000
Oct-10 28 308,000 102 2 7.1 566,000 26 92.9 308,000
Sep-10 20 342,500 104 1 5.0 350,000 19 95.0 335,000
Aug-10 21 352,000 45 2 9.5 458,500 19 90.5 352,000
Jul-10 33 335,000 56 1 3.0 224,000 32 97.0 338,750
Jun-10 34 364,950 52 6 17.6 484,950 28 82.3 358,500
May-10 37 299,500 54 2 5.4 717,500 35 94.6 295,000
Apr-10 28 345,750 86 4 14.3 275,250 24 85.7 354,000
Mar-10 28 305,000 61 2 7.1 186,000 26 92.9 315,000
Feb-10 24 322,100 81 0 24 100.0 322,100
Jan-10 13 315,000 94 0 13 100.0 315,000
Dec-09 13 385,000 85 0 13 100.0 385,000
Clarus MarketMetrics® 2 of 2 01/04/2012
Information not guaranteed. © 2009-2010 Terradatum and its suppliers and licensors (www.terradatum.com/about/licensors.td).
www.TaylorRealEstateAustin.com | Direct: 512.796.4447 | Fax: 512.628.7720 | 2525 Wallingwood Bldg. 7C Austin, TX 78746
6 of 20
- 7. Blake Taylor Taylor Real Estate
Under Contract Properties by Month
Dec-09 vs. Dec-11: The number of Under Contract properties is up 50%
Dec-09 vs. Dec-11
Dec-09 Dec-11 Change %
16 24 8 +50%
MLS: ACTRIS Period: 2 years (monthly) Price: All Construction Type: All Bedrooms: All Bathrooms: All Lot Size: All
Property Types: Residential: (House, Condo, Townhouse, Half Duplex, Modular) Sq Ft: All
MLS Areas: W
Clarus MarketMetrics® 1 of 2 01/04/2012
Information not guaranteed. © 2009-2010 Terradatum and its suppliers and licensors (www.terradatum.com/about/licensors.td).
www.TaylorRealEstateAustin.com | Direct: 512.796.4447 | Fax: 512.628.7720 | 2525 Wallingwood Bldg. 7C Austin, TX 78746
7 of 20
- 8. Blake Taylor Taylor Real Estate
Under Contract Properties by Month
Dec-09 vs. Dec-11: The number of Under Contract properties is up 50%
Full Market Bank Properties Non-Bank Properties
Time Period # Properties Median Price Average DOM # Properties % Bank Median Price # Properties % Non-Bank Median Price
Dec-11 24 342,400 73 6 25.0 359,950 18 75.0 339,900
Nov-11 26 312,000 87 0 26 100.0 312,000
Oct-11 25 305,000 76 2 8.0 690,950 23 92.0 305,000
Sep-11 26 312,500 96 1 3.9 653,800 25 96.2 300,000
Aug-11 33 299,000 85 3 9.1 149,900 30 90.9 312,000
Jul-11 38 314,500 95 2 5.3 432,450 36 94.7 314,500
Jun-11 30 379,950 85 0 30 100.0 379,950
May-11 36 397,450 96 2 5.6 333,400 34 94.4 397,450
Apr-11 28 374,950 74 3 10.7 369,900 25 89.3 380,000
Mar-11 26 269,950 88 3 11.5 174,000 23 88.5 270,000
Feb-11 23 355,900 47 2 8.7 255,450 21 91.3 366,900
Jan-11 22 357,000 106 1 4.5 355,000 21 95.5 359,000
Dec-10 11 335,000 96 3 27.3 609,900 8 72.7 311,992
Nov-10 18 335,000 110 3 16.7 324,900 15 83.3 345,000
Oct-10 17 307,000 125 0 17 100.0 307,000
Sep-10 24 309,900 105 1 4.2 999,900 23 95.8 299,900
Aug-10 22 357,495 76 3 13.6 209,900 19 86.4 359,990
Jul-10 23 349,000 50 1 4.3 729,000 22 95.7 347,808
Jun-10 36 344,995 62 1 2.8 160,000 35 97.2 349,990
May-10 27 359,459 52 1 3.7 214,900 26 96.3 362,230
Apr-10 36 359,750 59 3 8.3 631,200 33 91.7 352,000
Mar-10 29 350,000 72 4 13.8 318,400 25 86.2 350,000
Feb-10 31 325,000 70 4 12.9 287,400 27 87.1 325,000
Jan-10 21 334,900 70 1 4.8 600,000 20 95.2 329,950
Dec-09 16 319,950 95 1 6.2 152,500 15 93.8 325,000
Clarus MarketMetrics® 2 of 2 01/04/2012
Information not guaranteed. © 2009-2010 Terradatum and its suppliers and licensors (www.terradatum.com/about/licensors.td).
www.TaylorRealEstateAustin.com | Direct: 512.796.4447 | Fax: 512.628.7720 | 2525 Wallingwood Bldg. 7C Austin, TX 78746
8 of 20
- 9. Blake Taylor Taylor Real Estate
New Properties by Month
Dec-09 vs. Dec-11: The number of New properties is down 26%
Dec-09 vs. Dec-11
Dec-09 Dec-11 Change %
23 17 -6 -26%
MLS: ACTRIS Period: 2 years (monthly) Price: All Construction Type: All Bedrooms: All Bathrooms: All Lot Size: All
Property Types: Residential: (House, Condo, Townhouse, Half Duplex, Modular) Sq Ft: All
MLS Areas: W
Clarus MarketMetrics® 1 of 2 01/04/2012
Information not guaranteed. © 2009-2010 Terradatum and its suppliers and licensors (www.terradatum.com/about/licensors.td).
www.TaylorRealEstateAustin.com | Direct: 512.796.4447 | Fax: 512.628.7720 | 2525 Wallingwood Bldg. 7C Austin, TX 78746
9 of 20
- 10. Blake Taylor Taylor Real Estate
New Properties by Month
Dec-09 vs. Dec-11: The number of New properties is down 26%
Full Market Bank Properties Non-Bank Properties
Time Period # Properties Median Price # Properties % Bank Median Price # Properties % Non-Bank Median Price
Dec-11 17 339,900 2 11.8 362,425 15 88.2 339,900
Nov-11 33 349,900 2 6.1 562,400 31 93.9 349,900
Oct-11 27 319,900 1 3.7 162,900 26 96.3 332,450
Sep-11 32 367,450 3 9.4 653,800 29 90.6 350,000
Aug-11 32 349,900 2 6.2 474,900 30 93.8 342,400
Jul-11 43 376,500 3 7.0 149,900 40 93.0 378,200
Jun-11 52 319,450 0 52 100.0 319,450
May-11 47 524,000 2 4.3 415,950 45 95.7 524,000
Apr-11 47 339,000 0 47 100.0 339,000
Mar-11 59 364,900 4 6.8 161,950 55 93.2 380,000
Feb-11 53 366,900 2 3.8 272,400 51 96.2 366,900
Jan-11 51 389,900 4 7.8 285,000 47 92.2 395,000
Dec-10 21 339,000 2 9.5 713,450 19 90.5 339,000
Nov-10 18 294,950 3 16.7 354,900 15 83.3 280,000
Oct-10 26 324,500 0 26 100.0 324,500
Sep-10 31 374,900 3 9.7 335,000 28 90.3 382,200
Aug-10 33 374,900 2 6.1 477,400 31 93.9 374,900
Jul-10 56 351,500 3 5.4 209,900 53 94.6 359,000
Jun-10 66 354,995 2 3.0 594,900 64 97.0 354,995
May-10 60 376,750 1 1.7 354,900 59 98.3 379,000
Apr-10 79 359,000 5 6.3 375,000 74 93.7 352,495
Mar-10 76 387,500 2 2.6 663,100 74 97.4 385,000
Feb-10 41 369,900 4 9.8 299,900 37 90.2 369,900
Jan-10 42 340,950 4 9.5 509,950 38 90.5 340,950
Dec-09 23 335,000 2 8.7 899,950 21 91.3 329,900
Clarus MarketMetrics® 2 of 2 01/04/2012
Information not guaranteed. © 2009-2010 Terradatum and its suppliers and licensors (www.terradatum.com/about/licensors.td).
www.TaylorRealEstateAustin.com | Direct: 512.796.4447 | Fax: 512.628.7720 | 2525 Wallingwood Bldg. 7C Austin, TX 78746
10 of 20
- 11. Blake Taylor Taylor Real Estate
For Sale Properties by Month
Dec-09 vs. Dec-11: The number of For Sale properties is down 27%
Dec-09 vs. Dec-11
Dec-09 Dec-11 Change %
186 136 -50 -27%
MLS: ACTRIS Period: 2 years (monthly) Price: All Construction Type: All Bedrooms: All Bathrooms: All Lot Size: All
Property Types: Residential: (House, Condo, Townhouse, Half Duplex, Modular) Sq Ft: All
MLS Areas: W
Clarus MarketMetrics® 1 of 2 01/04/2012
Information not guaranteed. © 2009-2010 Terradatum and its suppliers and licensors (www.terradatum.com/about/licensors.td).
www.TaylorRealEstateAustin.com | Direct: 512.796.4447 | Fax: 512.628.7720 | 2525 Wallingwood Bldg. 7C Austin, TX 78746
11 of 20
- 12. Blake Taylor Taylor Real Estate
For Sale Properties by Month
Dec-09 vs. Dec-11: The number of For Sale properties is down 27%
Full Market Bank Properties Non-Bank Properties
Time Period # Properties Median Price Average DOM # Properties % Bank Median Price # Properties % Non-Bank Median Price
Dec-11 136 397,000 137 8 5.9 362,450 128 94.1 421,500
Nov-11 156 389,700 128 7 4.5 349,900 149 95.5 395,000
Oct-11 159 389,500 125 7 4.4 349,900 152 95.6 392,450
Sep-11 179 375,000 121 8 4.5 362,450 171 95.5 377,600
Aug-11 199 364,900 113 8 4.0 299,450 191 96.0 365,000
Jul-11 223 364,900 103 8 3.6 257,000 215 96.4 365,000
Jun-11 226 365,500 99 5 2.2 299,000 221 97.8 367,900
May-11 220 391,250 100 7 3.2 299,000 213 96.8 399,000
Apr-11 209 380,000 93 9 4.3 299,000 200 95.7 386,498
Mar-11 196 379,500 91 12 6.1 257,000 184 93.9 382,748
Feb-11 175 375,000 97 10 5.7 304,900 165 94.3 379,000
Jan-11 165 380,000 118 9 5.5 309,900 156 94.5 385,198
Dec-10 154 372,495 142 8 5.2 417,450 146 94.8 372,495
Nov-10 177 369,900 138 9 5.1 335,000 168 94.9 372,445
Oct-10 206 372,445 133 6 2.9 329,950 200 97.1 374,950
Sep-10 232 379,450 126 10 4.3 344,950 222 95.7 379,900
Aug-10 260 379,900 118 11 4.2 354,900 249 95.8 380,000
Jul-10 279 379,900 104 10 3.6 354,950 269 96.4 380,000
Jun-10 283 384,900 98 8 2.8 365,000 275 97.2 385,000
May-10 259 394,500 97 7 2.7 355,000 252 97.3 399,000
Apr-10 254 392,250 95 11 4.3 379,900 243 95.7 394,500
Mar-10 220 399,900 108 10 4.5 398,400 210 95.5 399,900
Feb-10 185 395,000 121 12 6.5 352,450 173 93.5 399,000
Jan-10 177 389,500 124 10 5.7 477,500 167 94.3 389,500
Dec-09 186 397,000 128 8 4.3 352,450 178 95.7 399,000
Clarus MarketMetrics® 2 of 2 01/04/2012
Information not guaranteed. © 2009-2010 Terradatum and its suppliers and licensors (www.terradatum.com/about/licensors.td).
www.TaylorRealEstateAustin.com | Direct: 512.796.4447 | Fax: 512.628.7720 | 2525 Wallingwood Bldg. 7C Austin, TX 78746
12 of 20
- 13. Blake Taylor Taylor Real Estate
Expired Properties by Month
Dec-09 vs. Dec-11: The number of Expired properties is down 37%
Dec-09 vs. Dec-11
Dec-09 Dec-11 Change %
35 22 -13 -37%
MLS: ACTRIS Period: 2 years (monthly) Price: All Construction Type: All Bedrooms: All Bathrooms: All Lot Size: All
Property Types: Residential: (House, Condo, Townhouse, Half Duplex, Modular) Sq Ft: All
MLS Areas: W
Clarus MarketMetrics® 1 of 2 01/04/2012
Information not guaranteed. © 2009-2010 Terradatum and its suppliers and licensors (www.terradatum.com/about/licensors.td).
www.TaylorRealEstateAustin.com | Direct: 512.796.4447 | Fax: 512.628.7720 | 2525 Wallingwood Bldg. 7C Austin, TX 78746
13 of 20
- 14. Blake Taylor Taylor Real Estate
Expired Properties by Month
Dec-09 vs. Dec-11: The number of Expired properties is down 37%
Full Market Bank Properties Non-Bank Properties
Time Period # Properties Median Price Average DOM # Properties % Bank Median Price # Properties % Non-Bank Median Price
Dec-11 22 674,950 162 1 4.5 349,900 21 95.5 740,000
Nov-11 11 299,000 152 1 9.1 299,000 10 90.9 299,950
Oct-11 11 429,000 146 0 11 100.0 429,000
Sep-11 21 379,900 144 1 4.8 182,000 20 95.2 397,450
Aug-11 19 424,700 107 0 19 100.0 424,700
Jul-11 18 434,900 94 0 18 100.0 434,900
Jun-11 16 649,000 105 0 16 100.0 649,000
May-11 10 354,500 111 0 10 100.0 354,500
Apr-11 8 772,500 94 1 12.5 174,900 7 87.5 995,000
Mar-11 8 353,500 95 0 8 100.0 353,500
Feb-11 15 367,900 168 0 15 100.0 367,900
Jan-11 21 398,000 150 0 21 100.0 398,000
Dec-10 29 384,900 152 0 29 100.0 384,900
Nov-10 26 389,250 163 0 26 100.0 389,250
Oct-10 30 384,500 164 0 30 100.0 384,500
Sep-10 28 419,250 159 3 10.7 354,900 25 89.3 439,500
Aug-10 37 429,900 142 1 2.7 355,000 36 97.3 437,812
Jul-10 29 424,900 128 0 29 100.0 424,900
Jun-10 24 434,625 125 0 24 100.0 434,625
May-10 15 498,000 148 0 15 100.0 498,000
Apr-10 19 450,000 164 2 10.5 832,400 17 89.5 450,000
Mar-10 16 887,000 196 0 16 100.0 887,000
Feb-10 10 380,000 117 0 10 100.0 380,000
Jan-10 12 999,500 166 1 8.3 1,450,000 11 91.7 999,000
Dec-09 35 399,900 120 1 2.9 239,900 34 97.1 464,450
Clarus MarketMetrics® 2 of 2 01/04/2012
Information not guaranteed. © 2009-2010 Terradatum and its suppliers and licensors (www.terradatum.com/about/licensors.td).
www.TaylorRealEstateAustin.com | Direct: 512.796.4447 | Fax: 512.628.7720 | 2525 Wallingwood Bldg. 7C Austin, TX 78746
14 of 20
- 15. Blake Taylor Taylor Real Estate
Supply & Demand by Month
Dec-09 vs. Dec-11: The number of for sale properties is down 27% and the number of sold properties is up 115%
Dec-09 vs. Dec-11 Dec-09 vs. Dec-11
Dec-09 Dec-11 Change % Dec-09 Dec-11 Change %
186 136 -50 -27% 13 28 15 +115%
MLS: ACTRIS Period: 2 years (monthly) Price: All Construction Type: All Bedrooms: All Bathrooms: All Lot Size: All
Property Types: Residential: (House, Condo, Townhouse, Half Duplex, Modular) Sq Ft: All
MLS Areas: W
Clarus MarketMetrics® 1 of 2 01/04/2012
Information not guaranteed. © 2009-2010 Terradatum and its suppliers and licensors (www.terradatum.com/about/licensors.td).
www.TaylorRealEstateAustin.com | Direct: 512.796.4447 | Fax: 512.628.7720 | 2525 Wallingwood Bldg. 7C Austin, TX 78746
15 of 20
- 16. Blake Taylor Taylor Real Estate
Supply & Demand by Month
Dec-09 vs. Dec-11: The number of for sale properties is down 27% and the number of sold properties is up 115%
# Properties Average DOM # Properties Average DOM
Time Period For Sale For Sale Sold Sold
Dec-11 136 137 28 100
Nov-11 156 128 28 84
Oct-11 159 125 17 82
Sep-11 179 121 34 79
Aug-11 199 113 41 89
Jul-11 223 103 30 89
Jun-11 226 99 35 97
May-11 220 100 24 66
Apr-11 209 93 24 95
Mar-11 196 91 31 76
Feb-11 175 97 17 83
Jan-11 165 118 11 119
Dec-10 154 142 14 126
Nov-10 177 138 20 85
Oct-10 206 133 28 102
Sep-10 232 126 20 104
Aug-10 260 118 21 45
Jul-10 279 104 33 56
Jun-10 283 98 34 52
May-10 259 97 37 54
Apr-10 254 95 28 86
Mar-10 220 108 28 61
Feb-10 185 121 24 81
Jan-10 177 124 13 94
Dec-09 186 128 13 85
Clarus MarketMetrics® 2 of 2 01/04/2012
Information not guaranteed. © 2009-2010 Terradatum and its suppliers and licensors (www.terradatum.com/about/licensors.td).
www.TaylorRealEstateAustin.com | Direct: 512.796.4447 | Fax: 512.628.7720 | 2525 Wallingwood Bldg. 7C Austin, TX 78746
16 of 20
- 17. Blake Taylor Taylor Real Estate
The Average Days on Market by Month
Dec-09 vs. Dec-11: The average days on market is down 23%
Dec-09 vs. Dec-11
Dec-09 Dec-11 Change %
95 73 -22 -23%
MLS: ACTRIS Period: 2 years (monthly) Price: All Construction Type: All Bedrooms: All Bathrooms: All Lot Size: All
Property Types: Residential: (House, Condo, Townhouse, Half Duplex, Modular) Sq Ft: All
MLS Areas: W
Clarus MarketMetrics® 1 of 2 01/04/2012
Information not guaranteed. © 2009-2010 Terradatum and its suppliers and licensors (www.terradatum.com/about/licensors.td).
www.TaylorRealEstateAustin.com | Direct: 512.796.4447 | Fax: 512.628.7720 | 2525 Wallingwood Bldg. 7C Austin, TX 78746
17 of 20
- 18. Blake Taylor Taylor Real Estate
The Average Days on Market by Month
Dec-09 vs. Dec-11: The average days on market is down 23%
Time Period Average DOM # UC Units
Dec-11 73 24
Nov-11 87 26
Oct-11 76 25
Sep-11 96 26
Aug-11 85 33
Jul-11 95 38
Jun-11 85 30
May-11 96 36
Apr-11 74 28
Mar-11 88 26
Feb-11 47 23
Jan-11 106 22
Dec-10 96 11
Nov-10 110 18
Oct-10 125 17
Sep-10 105 24
Aug-10 76 22
Jul-10 50 23
Jun-10 62 36
May-10 52 27
Apr-10 59 36
Mar-10 72 29
Feb-10 70 31
Jan-10 70 21
Dec-09 95 16
Clarus MarketMetrics® 2 of 2 01/04/2012
Information not guaranteed. © 2009-2010 Terradatum and its suppliers and licensors (www.terradatum.com/about/licensors.td).
www.TaylorRealEstateAustin.com | Direct: 512.796.4447 | Fax: 512.628.7720 | 2525 Wallingwood Bldg. 7C Austin, TX 78746
18 of 20
- 19. Blake Taylor Taylor Real Estate
Months Supply of Inventory
Dec-09 vs. Dec-11: The average months supply of inventory is down 56%
Dec-09 vs. Dec-11
Dec-09 Dec-11 Change %
8.4 3.8 -4.7 -56%
MLS: ACTRIS Period: 2 years (monthly) Price: All Construction Type: All Bedrooms: All Bathrooms: All Lot Size: All
Property Types: Residential: (House, Condo, Townhouse, Half Duplex, Modular) Sq Ft: All
MLS Areas: W
Clarus MarketMetrics® 1 of 2 01/04/2012
Information not guaranteed. © 2009-2010 Terradatum and its suppliers and licensors (www.terradatum.com/about/licensors.td).
www.TaylorRealEstateAustin.com | Direct: 512.796.4447 | Fax: 512.628.7720 | 2525 Wallingwood Bldg. 7C Austin, TX 78746
19 of 20
- 20. Blake Taylor Taylor Real Estate
Months Supply of Inventory
Dec-09 vs. Dec-11: The average months supply of inventory is down 56%
# Units For Sale # UC Units UC Average
Time Period Last Day of Month During Month MSI DOM
Dec-11 90 24 3.8 73
Nov-11 119 26 4.6 87
Oct-11 123 25 4.9 76
Sep-11 132 26 5.1 96
Aug-11 147 33 4.5 85
Jul-11 167 38 4.4 95
Jun-11 180 30 6.0 85
May-11 174 36 4.8 96
Apr-11 173 28 6.2 74
Mar-11 162 26 6.2 88
Feb-11 137 23 6.0 47
Jan-11 122 22 5.5 106
Dec-10 114 11 10.4 96
Nov-10 133 18 7.4 110
Oct-10 159 17 9.4 125
Sep-10 180 24 7.5 105
Aug-10 201 22 9.1 76
Jul-10 227 23 9.9 50
Jun-10 223 36 6.2 62
May-10 217 27 8.0 52
Apr-10 199 36 5.5 59
Mar-10 175 29 6.0 72
Feb-10 144 31 4.6 70
Jan-10 144 21 6.9 70
Dec-09 135 16 8.4 95
Clarus MarketMetrics® 2 of 2 01/04/2012
Information not guaranteed. © 2009-2010 Terradatum and its suppliers and licensors (www.terradatum.com/about/licensors.td).
www.TaylorRealEstateAustin.com | Direct: 512.796.4447 | Fax: 512.628.7720 | 2525 Wallingwood Bldg. 7C Austin, TX 78746
20 of 20