Ut metrics
•
0 gefällt mir•315 views

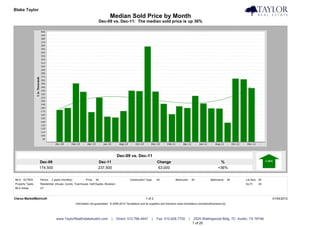
The document compares median home sale prices from December 2009 to December 2011 in Austin, Texas. It finds that the median sold price increased 36% from $174,500 to $237,500 over that period. Additionally, the number of homes sold decreased 25% from 12 homes in December 2009 to 9 homes in December 2011. Finally, the number of homes under contract increased 88% from 8 homes in December 2009 to 15 homes in December 2011.

Empfohlen
Weitere ähnliche Inhalte
Was ist angesagt?
Was ist angesagt? (20)
Ähnlich wie Ut metrics
Ähnlich wie Ut metrics (11)
Ut metrics
- 1. Blake Taylor Taylor Real Estate Median Sold Price by Month Dec-09 vs. Dec-11: The median sold price is up 36% Dec-09 vs. Dec-11 Dec-09 Dec-11 Change % 174,500 237,500 63,000 +36% MLS: ACTRIS Period: 2 years (monthly) Price: All Construction Type: All Bedrooms: All Bathrooms: All Lot Size: All Property Types: Residential: (House, Condo, Townhouse, Half Duplex, Modular) Sq Ft: All MLS Areas: UT Clarus MarketMetrics® 1 of 2 01/04/2012 Information not guaranteed. © 2009-2010 Terradatum and its suppliers and licensors (www.terradatum.com/about/licensors.td). www.TaylorRealEstateAustin.com | Direct: 512.796.4447 | Fax: 512.628.7720 | 2525 Wallingwood Bldg. 7C Austin, TX 78746 1 of 20
- 2. Blake Taylor Taylor Real Estate Median Sold Price by Month Dec-09 vs. Dec-11: The median sold price is up 36% Time Period Median Price # Units Average DOM Dec-11 237,500 9 44 Nov-11 263,000 5 40 Oct-11 265,000 11 93 Sep-11 137,500 13 123 Aug-11 178,312 40 87 Jul-11 179,000 32 92 Jun-11 193,000 37 85 May-11 215,000 21 65 Apr-11 180,000 23 51 Mar-11 185,000 11 60 Feb-11 162,000 9 108 Jan-11 192,000 3 23 Dec-10 227,500 15 47 Nov-10 357,750 6 102 Oct-10 228,750 10 70 Sep-10 230,000 7 158 Aug-10 171,000 15 108 Jul-10 152,500 26 84 Jun-10 155,000 31 58 May-10 210,000 17 73 Apr-10 167,900 16 46 Mar-10 226,860 7 110 Feb-10 251,000 10 133 Jan-10 180,000 7 134 Dec-09 174,500 12 132 Clarus MarketMetrics® 2 of 2 01/04/2012 Information not guaranteed. © 2009-2010 Terradatum and its suppliers and licensors (www.terradatum.com/about/licensors.td). www.TaylorRealEstateAustin.com | Direct: 512.796.4447 | Fax: 512.628.7720 | 2525 Wallingwood Bldg. 7C Austin, TX 78746 2 of 20
- 3. Blake Taylor Taylor Real Estate Median For Sale vs. Median Sold Dec-09 vs. Dec-11: The median price of for sale properties is up 7% and the median price of sold properties is up 36% Dec-09 vs. Dec-11 Dec-09 vs. Dec-11 Dec-09 Dec-11 Change % Dec-09 Dec-11 Change % 224,950 240,050 15,100 +7% 174,500 237,500 63,000 +36% MLS: ACTRIS Period: 2 years (monthly) Price: All Construction Type: All Bedrooms: All Bathrooms: All Lot Size: All Property Types: Residential: (House, Condo, Townhouse, Half Duplex, Modular) Sq Ft: All MLS Areas: UT Clarus MarketMetrics® 1 of 2 01/04/2012 Information not guaranteed. © 2009-2010 Terradatum and its suppliers and licensors (www.terradatum.com/about/licensors.td). www.TaylorRealEstateAustin.com | Direct: 512.796.4447 | Fax: 512.628.7720 | 2525 Wallingwood Bldg. 7C Austin, TX 78746 3 of 20
- 4. Blake Taylor Taylor Real Estate Median For Sale vs. Median Sold Dec-09 vs. Dec-11: The median price of for sale properties is up 7% and the median price of sold properties is up 36% For Sale # Properties Sold # Properties Price Time Period Median For Sale Median Sold Difference Dec-11 240,050 76 237,500 9 -2,550 Nov-11 250,000 74 263,000 5 13,000 Oct-11 254,900 79 265,000 11 10,100 Sep-11 247,500 92 137,500 13 -110,000 Aug-11 205,000 135 178,312 40 -26,688 Jul-11 199,900 182 179,000 32 -20,900 Jun-11 199,900 196 193,000 37 -6,900 May-11 200,000 217 215,000 21 15,000 Apr-11 203,000 231 180,000 23 -23,000 Mar-11 199,500 216 185,000 11 -14,500 Feb-11 199,700 178 162,000 9 -37,700 Jan-11 225,000 147 192,000 3 -33,000 Dec-10 204,450 128 227,500 15 23,050 Nov-10 222,250 146 357,750 6 135,500 Oct-10 227,500 154 228,750 10 1,250 Sep-10 235,000 175 230,000 7 -5,000 Aug-10 209,997 209 171,000 15 -38,997 Jul-10 215,000 253 152,500 26 -62,500 Jun-10 209,900 254 155,000 31 -54,900 May-10 215,000 258 210,000 17 -5,000 Apr-10 209,900 261 167,900 16 -42,000 Mar-10 215,000 238 226,860 7 11,860 Feb-10 214,750 192 251,000 10 36,250 Jan-10 209,950 164 180,000 7 -29,950 Dec-09 224,950 128 174,500 12 -50,450 Clarus MarketMetrics® 2 of 2 01/04/2012 Information not guaranteed. © 2009-2010 Terradatum and its suppliers and licensors (www.terradatum.com/about/licensors.td). www.TaylorRealEstateAustin.com | Direct: 512.796.4447 | Fax: 512.628.7720 | 2525 Wallingwood Bldg. 7C Austin, TX 78746 4 of 20
- 5. Blake Taylor Taylor Real Estate Sold Properties by Month Dec-09 vs. Dec-11: The number of Sold properties is down 25% Dec-09 vs. Dec-11 Dec-09 Dec-11 Change % 12 9 -3 -25% MLS: ACTRIS Period: 2 years (monthly) Price: All Construction Type: All Bedrooms: All Bathrooms: All Lot Size: All Property Types: Residential: (House, Condo, Townhouse, Half Duplex, Modular) Sq Ft: All MLS Areas: UT Clarus MarketMetrics® 1 of 2 01/04/2012 Information not guaranteed. © 2009-2010 Terradatum and its suppliers and licensors (www.terradatum.com/about/licensors.td). www.TaylorRealEstateAustin.com | Direct: 512.796.4447 | Fax: 512.628.7720 | 2525 Wallingwood Bldg. 7C Austin, TX 78746 5 of 20
- 6. Blake Taylor Taylor Real Estate Sold Properties by Month Dec-09 vs. Dec-11: The number of Sold properties is down 25% Full Market Bank Properties Non-Bank Properties Time Period # Properties Median Price Average DOM # Properties % Bank Median Price # Properties % Non-Bank Median Price Dec-11 9 237,500 44 1 11.1 210,900 8 88.9 238,750 Nov-11 5 263,000 40 0 5 100.0 263,000 Oct-11 11 265,000 93 1 9.1 175,000 10 90.9 271,000 Sep-11 13 137,500 123 1 7.7 185,000 12 92.3 126,500 Aug-11 40 178,312 87 2 5.0 293,448 38 95.0 171,562 Jul-11 32 179,000 92 0 32 100.0 179,000 Jun-11 37 193,000 85 0 37 100.0 193,000 May-11 21 215,000 65 0 21 100.0 215,000 Apr-11 23 180,000 51 1 4.3 475,000 22 95.7 177,500 Mar-11 11 185,000 60 1 9.1 160,000 10 90.9 200,000 Feb-11 9 162,000 108 0 9 100.0 162,000 Jan-11 3 192,000 23 1 33.3 226,600 2 66.7 178,000 Dec-10 15 227,500 47 2 13.3 319,250 13 86.7 227,500 Nov-10 6 357,750 102 0 6 100.0 357,750 Oct-10 10 228,750 70 0 10 100.0 228,750 Sep-10 7 230,000 158 0 7 100.0 230,000 Aug-10 15 171,000 108 1 6.7 196,210 14 93.3 167,250 Jul-10 26 152,500 84 0 26 100.0 152,500 Jun-10 31 155,000 58 1 3.2 1,100,000 30 96.8 155,000 May-10 17 210,000 73 0 17 100.0 210,000 Apr-10 16 167,900 46 0 16 100.0 167,900 Mar-10 7 226,860 110 1 14.3 255,500 6 85.7 215,930 Feb-10 10 251,000 133 0 10 100.0 251,000 Jan-10 7 180,000 134 0 7 100.0 180,000 Dec-09 12 174,500 132 0 12 100.0 174,500 Clarus MarketMetrics® 2 of 2 01/04/2012 Information not guaranteed. © 2009-2010 Terradatum and its suppliers and licensors (www.terradatum.com/about/licensors.td). www.TaylorRealEstateAustin.com | Direct: 512.796.4447 | Fax: 512.628.7720 | 2525 Wallingwood Bldg. 7C Austin, TX 78746 6 of 20
- 7. Blake Taylor Taylor Real Estate Under Contract Properties by Month Dec-09 vs. Dec-11: The number of Under Contract properties is up 88% Dec-09 vs. Dec-11 Dec-09 Dec-11 Change % 8 15 7 +88% MLS: ACTRIS Period: 2 years (monthly) Price: All Construction Type: All Bedrooms: All Bathrooms: All Lot Size: All Property Types: Residential: (House, Condo, Townhouse, Half Duplex, Modular) Sq Ft: All MLS Areas: UT Clarus MarketMetrics® 1 of 2 01/04/2012 Information not guaranteed. © 2009-2010 Terradatum and its suppliers and licensors (www.terradatum.com/about/licensors.td). www.TaylorRealEstateAustin.com | Direct: 512.796.4447 | Fax: 512.628.7720 | 2525 Wallingwood Bldg. 7C Austin, TX 78746 7 of 20
- 8. Blake Taylor Taylor Real Estate Under Contract Properties by Month Dec-09 vs. Dec-11: The number of Under Contract properties is up 88% Full Market Bank Properties Non-Bank Properties Time Period # Properties Median Price Average DOM # Properties % Bank Median Price # Properties % Non-Bank Median Price Dec-11 15 250,000 127 0 15 100.0 250,000 Nov-11 7 319,000 90 1 14.3 280,200 6 85.7 447,000 Oct-11 6 243,450 35 1 16.7 214,900 5 83.3 272,000 Sep-11 8 189,450 108 2 25.0 189,450 6 75.0 207,500 Aug-11 20 197,000 100 1 5.0 212,000 19 95.0 182,000 Jul-11 40 192,400 86 1 2.5 439,000 39 97.5 189,800 Jun-11 24 193,700 98 0 24 100.0 193,700 May-11 36 191,200 82 0 36 100.0 191,200 Apr-11 31 219,900 69 0 31 100.0 219,900 Mar-11 19 189,900 50 2 10.5 304,500 17 89.5 189,900 Feb-11 13 169,900 92 0 13 100.0 169,900 Jan-11 6 210,000 53 0 6 100.0 210,000 Dec-10 7 219,500 57 1 14.3 219,500 6 85.7 200,500 Nov-10 8 241,450 34 2 25.0 329,000 6 75.0 241,450 Oct-10 7 250,000 41 0 7 100.0 250,000 Sep-10 10 245,000 108 0 10 100.0 245,000 Aug-10 10 199,450 122 1 10.0 199,900 9 90.0 199,000 Jul-10 23 188,900 91 0 23 100.0 188,900 Jun-10 15 149,900 95 0 15 100.0 149,900 May-10 17 174,500 72 1 5.9 1,359,000 16 94.1 166,750 Apr-10 34 173,950 61 0 34 100.0 173,950 Mar-10 16 226,894 49 1 6.2 259,900 15 93.8 219,900 Feb-10 6 213,450 123 0 6 100.0 213,450 Jan-10 10 284,450 189 0 10 100.0 284,450 Dec-09 8 174,700 55 0 8 100.0 174,700 Clarus MarketMetrics® 2 of 2 01/04/2012 Information not guaranteed. © 2009-2010 Terradatum and its suppliers and licensors (www.terradatum.com/about/licensors.td). www.TaylorRealEstateAustin.com | Direct: 512.796.4447 | Fax: 512.628.7720 | 2525 Wallingwood Bldg. 7C Austin, TX 78746 8 of 20
- 9. Blake Taylor Taylor Real Estate New Properties by Month Dec-09 vs. Dec-11: The number of New properties is up 11% Dec-09 vs. Dec-11 Dec-09 Dec-11 Change % 18 20 2 +11% MLS: ACTRIS Period: 2 years (monthly) Price: All Construction Type: All Bedrooms: All Bathrooms: All Lot Size: All Property Types: Residential: (House, Condo, Townhouse, Half Duplex, Modular) Sq Ft: All MLS Areas: UT Clarus MarketMetrics® 1 of 2 01/04/2012 Information not guaranteed. © 2009-2010 Terradatum and its suppliers and licensors (www.terradatum.com/about/licensors.td). www.TaylorRealEstateAustin.com | Direct: 512.796.4447 | Fax: 512.628.7720 | 2525 Wallingwood Bldg. 7C Austin, TX 78746 9 of 20
- 10. Blake Taylor Taylor Real Estate New Properties by Month Dec-09 vs. Dec-11: The number of New properties is up 11% Full Market Bank Properties Non-Bank Properties Time Period # Properties Median Price # Properties % Bank Median Price # Properties % Non-Bank Median Price Dec-11 20 259,950 2 10.0 240,050 18 90.0 282,450 Nov-11 13 185,000 0 13 100.0 185,000 Oct-11 13 255,000 1 7.7 214,900 12 92.3 255,500 Sep-11 7 272,000 0 7 100.0 272,000 Aug-11 16 274,950 1 6.2 280,200 15 93.8 274,900 Jul-11 27 183,000 1 3.7 179,900 26 96.3 186,450 Jun-11 31 178,900 2 6.5 325,500 29 93.5 178,500 May-11 23 220,000 2 8.7 319,000 21 91.3 220,000 Apr-11 51 219,900 0 51 100.0 219,900 Mar-11 63 199,500 1 1.6 446,000 62 98.4 199,500 Feb-11 50 179,500 1 2.0 163,000 49 98.0 189,500 Jan-11 42 227,500 0 42 100.0 227,500 Dec-10 15 199,900 2 13.3 329,250 13 86.7 195,000 Nov-10 22 229,950 2 9.1 434,000 20 90.9 217,000 Oct-10 20 250,750 2 10.0 329,000 18 90.0 236,000 Sep-10 25 257,900 0 25 100.0 257,900 Aug-10 22 219,500 1 4.5 230,000 21 95.5 209,000 Jul-10 32 234,950 0 32 100.0 234,950 Jun-10 33 159,000 1 3.0 219,500 32 97.0 154,000 May-10 44 215,250 2 4.5 444,000 42 95.5 207,250 Apr-10 54 187,194 0 54 100.0 187,194 Mar-10 60 251,950 0 60 100.0 251,950 Feb-10 55 219,000 1 1.8 1,359,000 54 98.2 217,000 Jan-10 61 199,900 2 3.3 229,900 59 96.7 199,900 Dec-09 18 201,200 0 18 100.0 201,200 Clarus MarketMetrics® 2 of 2 01/04/2012 Information not guaranteed. © 2009-2010 Terradatum and its suppliers and licensors (www.terradatum.com/about/licensors.td). www.TaylorRealEstateAustin.com | Direct: 512.796.4447 | Fax: 512.628.7720 | 2525 Wallingwood Bldg. 7C Austin, TX 78746 10 of 20
- 11. Blake Taylor Taylor Real Estate For Sale Properties by Month Dec-09 vs. Dec-11: The number of For Sale properties is down 41% Dec-09 vs. Dec-11 Dec-09 Dec-11 Change % 128 76 -52 -41% MLS: ACTRIS Period: 2 years (monthly) Price: All Construction Type: All Bedrooms: All Bathrooms: All Lot Size: All Property Types: Residential: (House, Condo, Townhouse, Half Duplex, Modular) Sq Ft: All MLS Areas: UT Clarus MarketMetrics® 1 of 2 01/04/2012 Information not guaranteed. © 2009-2010 Terradatum and its suppliers and licensors (www.terradatum.com/about/licensors.td). www.TaylorRealEstateAustin.com | Direct: 512.796.4447 | Fax: 512.628.7720 | 2525 Wallingwood Bldg. 7C Austin, TX 78746 11 of 20
- 12. Blake Taylor Taylor Real Estate For Sale Properties by Month Dec-09 vs. Dec-11: The number of For Sale properties is down 41% Full Market Bank Properties Non-Bank Properties Time Period # Properties Median Price Average DOM # Properties % Bank Median Price # Properties % Non-Bank Median Price Dec-11 76 240,050 142 4 5.3 336,950 72 94.7 234,900 Nov-11 74 250,000 160 3 4.0 429,000 71 96.0 250,000 Oct-11 79 254,900 173 4 5.1 354,600 75 94.9 250,000 Sep-11 92 247,500 172 5 5.4 280,200 87 94.6 245,000 Aug-11 135 205,000 151 6 4.4 246,100 129 95.6 199,900 Jul-11 182 199,900 135 7 3.9 429,000 175 96.2 199,500 Jun-11 196 199,900 131 7 3.6 439,000 189 96.4 199,500 May-11 217 200,000 119 5 2.3 439,000 212 97.7 199,900 Apr-11 231 203,000 102 3 1.3 439,000 228 98.7 199,950 Mar-11 216 199,500 111 5 2.3 439,000 211 97.7 198,500 Feb-11 178 199,700 129 4 2.2 434,000 174 97.8 199,000 Jan-11 147 225,000 150 4 2.7 434,000 143 97.3 209,000 Dec-10 128 204,450 174 5 3.9 429,000 123 96.1 199,500 Nov-10 146 222,250 160 8 5.5 429,000 138 94.5 209,000 Oct-10 154 227,500 154 6 3.9 329,500 148 96.1 220,000 Sep-10 175 235,000 149 4 2.3 334,500 171 97.7 235,000 Aug-10 209 209,997 148 5 2.4 230,000 204 97.6 209,450 Jul-10 253 215,000 139 4 1.6 329,250 249 98.4 210,000 Jun-10 254 209,900 130 4 1.6 329,250 250 98.4 209,900 May-10 258 215,000 117 4 1.6 444,000 254 98.5 215,000 Apr-10 261 209,900 103 2 0.8 779,450 259 99.2 209,900 Mar-10 238 215,000 98 3 1.3 259,900 235 98.7 215,000 Feb-10 192 214,750 101 3 1.6 259,900 189 98.4 214,500 Jan-10 164 209,950 127 2 1.2 229,900 162 98.8 209,950 Dec-09 128 224,950 167 0 128 100.0 224,950 Clarus MarketMetrics® 2 of 2 01/04/2012 Information not guaranteed. © 2009-2010 Terradatum and its suppliers and licensors (www.terradatum.com/about/licensors.td). www.TaylorRealEstateAustin.com | Direct: 512.796.4447 | Fax: 512.628.7720 | 2525 Wallingwood Bldg. 7C Austin, TX 78746 12 of 20
- 13. Blake Taylor Taylor Real Estate Expired Properties by Month Dec-09 vs. Dec-11: The number of Expired properties is down 35% Dec-09 vs. Dec-11 Dec-09 Dec-11 Change % 17 11 -6 -35% MLS: ACTRIS Period: 2 years (monthly) Price: All Construction Type: All Bedrooms: All Bathrooms: All Lot Size: All Property Types: Residential: (House, Condo, Townhouse, Half Duplex, Modular) Sq Ft: All MLS Areas: UT Clarus MarketMetrics® 1 of 2 01/04/2012 Information not guaranteed. © 2009-2010 Terradatum and its suppliers and licensors (www.terradatum.com/about/licensors.td). www.TaylorRealEstateAustin.com | Direct: 512.796.4447 | Fax: 512.628.7720 | 2525 Wallingwood Bldg. 7C Austin, TX 78746 13 of 20
- 14. Blake Taylor Taylor Real Estate Expired Properties by Month Dec-09 vs. Dec-11: The number of Expired properties is down 35% Full Market Bank Properties Non-Bank Properties Time Period # Properties Median Price Average DOM # Properties % Bank Median Price # Properties % Non-Bank Median Price Dec-11 11 329,000 164 0 11 100.0 329,000 Nov-11 11 256,000 187 0 11 100.0 256,000 Oct-11 12 264,000 285 0 12 100.0 264,000 Sep-11 18 186,250 167 0 18 100.0 186,250 Aug-11 30 187,250 159 0 30 100.0 187,250 Jul-11 23 257,900 156 1 4.3 439,000 22 95.7 251,005 Jun-11 17 249,000 172 1 5.9 439,000 16 94.1 221,500 May-11 16 199,900 127 0 16 100.0 199,900 Apr-11 6 227,500 198 0 6 100.0 227,500 Mar-11 17 176,000 295 0 17 100.0 176,000 Feb-11 12 243,750 240 0 12 100.0 243,750 Jan-11 13 189,900 190 1 7.7 230,000 12 92.3 172,450 Dec-10 16 199,500 204 0 16 100.0 199,500 Nov-10 25 215,000 156 3 12.0 439,000 22 88.0 204,450 Oct-10 23 274,000 145 0 23 100.0 274,000 Sep-10 31 249,900 164 0 31 100.0 249,900 Aug-10 49 194,500 157 0 49 100.0 194,500 Jul-10 43 259,900 153 0 43 100.0 259,900 Jun-10 18 234,450 150 0 18 100.0 234,450 May-10 20 220,000 132 0 20 100.0 220,000 Apr-10 13 195,000 100 0 13 100.0 195,000 Mar-10 15 229,000 139 0 15 100.0 229,000 Feb-10 8 260,310 196 0 8 100.0 260,310 Jan-10 17 182,000 214 0 17 100.0 182,000 Dec-09 17 265,000 211 0 17 100.0 265,000 Clarus MarketMetrics® 2 of 2 01/04/2012 Information not guaranteed. © 2009-2010 Terradatum and its suppliers and licensors (www.terradatum.com/about/licensors.td). www.TaylorRealEstateAustin.com | Direct: 512.796.4447 | Fax: 512.628.7720 | 2525 Wallingwood Bldg. 7C Austin, TX 78746 14 of 20
- 15. Blake Taylor Taylor Real Estate Supply & Demand by Month Dec-09 vs. Dec-11: The number of for sale properties is down 41% and the number of sold properties is down 25% Dec-09 vs. Dec-11 Dec-09 vs. Dec-11 Dec-09 Dec-11 Change % Dec-09 Dec-11 Change % 128 76 -52 -41% 12 9 -3 -25% MLS: ACTRIS Period: 2 years (monthly) Price: All Construction Type: All Bedrooms: All Bathrooms: All Lot Size: All Property Types: Residential: (House, Condo, Townhouse, Half Duplex, Modular) Sq Ft: All MLS Areas: UT Clarus MarketMetrics® 1 of 2 01/04/2012 Information not guaranteed. © 2009-2010 Terradatum and its suppliers and licensors (www.terradatum.com/about/licensors.td). www.TaylorRealEstateAustin.com | Direct: 512.796.4447 | Fax: 512.628.7720 | 2525 Wallingwood Bldg. 7C Austin, TX 78746 15 of 20
- 16. Blake Taylor Taylor Real Estate Supply & Demand by Month Dec-09 vs. Dec-11: The number of for sale properties is down 41% and the number of sold properties is down 25% # Properties Average DOM # Properties Average DOM Time Period For Sale For Sale Sold Sold Dec-11 76 142 9 44 Nov-11 74 160 5 40 Oct-11 79 173 11 93 Sep-11 92 172 13 123 Aug-11 135 151 40 87 Jul-11 182 135 32 92 Jun-11 196 131 37 85 May-11 217 119 21 65 Apr-11 231 102 23 51 Mar-11 216 111 11 60 Feb-11 178 129 9 108 Jan-11 147 150 3 23 Dec-10 128 174 15 47 Nov-10 146 160 6 102 Oct-10 154 154 10 70 Sep-10 175 149 7 158 Aug-10 209 148 15 108 Jul-10 253 139 26 84 Jun-10 254 130 31 58 May-10 258 117 17 73 Apr-10 261 103 16 46 Mar-10 238 98 7 110 Feb-10 192 101 10 133 Jan-10 164 127 7 134 Dec-09 128 167 12 132 Clarus MarketMetrics® 2 of 2 01/04/2012 Information not guaranteed. © 2009-2010 Terradatum and its suppliers and licensors (www.terradatum.com/about/licensors.td). www.TaylorRealEstateAustin.com | Direct: 512.796.4447 | Fax: 512.628.7720 | 2525 Wallingwood Bldg. 7C Austin, TX 78746 16 of 20
- 17. Blake Taylor Taylor Real Estate The Average Days on Market by Month Dec-09 vs. Dec-11: The average days on market is up 132% Dec-09 vs. Dec-11 Dec-09 Dec-11 Change % 55 127 72 +132% MLS: ACTRIS Period: 2 years (monthly) Price: All Construction Type: All Bedrooms: All Bathrooms: All Lot Size: All Property Types: Residential: (House, Condo, Townhouse, Half Duplex, Modular) Sq Ft: All MLS Areas: UT Clarus MarketMetrics® 1 of 2 01/04/2012 Information not guaranteed. © 2009-2010 Terradatum and its suppliers and licensors (www.terradatum.com/about/licensors.td). www.TaylorRealEstateAustin.com | Direct: 512.796.4447 | Fax: 512.628.7720 | 2525 Wallingwood Bldg. 7C Austin, TX 78746 17 of 20
- 18. Blake Taylor Taylor Real Estate The Average Days on Market by Month Dec-09 vs. Dec-11: The average days on market is up 132% Time Period Average DOM # UC Units Dec-11 127 15 Nov-11 90 7 Oct-11 35 6 Sep-11 108 8 Aug-11 100 20 Jul-11 86 40 Jun-11 98 24 May-11 82 36 Apr-11 69 31 Mar-11 50 19 Feb-11 92 13 Jan-11 53 6 Dec-10 57 7 Nov-10 34 8 Oct-10 41 7 Sep-10 108 10 Aug-10 122 10 Jul-10 91 23 Jun-10 95 15 May-10 72 17 Apr-10 61 34 Mar-10 49 16 Feb-10 123 6 Jan-10 189 10 Dec-09 55 8 Clarus MarketMetrics® 2 of 2 01/04/2012 Information not guaranteed. © 2009-2010 Terradatum and its suppliers and licensors (www.terradatum.com/about/licensors.td). www.TaylorRealEstateAustin.com | Direct: 512.796.4447 | Fax: 512.628.7720 | 2525 Wallingwood Bldg. 7C Austin, TX 78746 18 of 20
- 19. Blake Taylor Taylor Real Estate Months Supply of Inventory Dec-09 vs. Dec-11: The average months supply of inventory is down 74% Dec-09 vs. Dec-11 Dec-09 Dec-11 Change % 12.9 3.3 -9.5 -74% MLS: ACTRIS Period: 2 years (monthly) Price: All Construction Type: All Bedrooms: All Bathrooms: All Lot Size: All Property Types: Residential: (House, Condo, Townhouse, Half Duplex, Modular) Sq Ft: All MLS Areas: UT Clarus MarketMetrics® 1 of 2 01/04/2012 Information not guaranteed. © 2009-2010 Terradatum and its suppliers and licensors (www.terradatum.com/about/licensors.td). www.TaylorRealEstateAustin.com | Direct: 512.796.4447 | Fax: 512.628.7720 | 2525 Wallingwood Bldg. 7C Austin, TX 78746 19 of 20
- 20. Blake Taylor Taylor Real Estate Months Supply of Inventory Dec-09 vs. Dec-11: The average months supply of inventory is down 74% # Units For Sale # UC Units UC Average Time Period Last Day of Month During Month MSI DOM Dec-11 50 15 3.3 127 Nov-11 56 7 8.0 90 Oct-11 61 6 10.2 35 Sep-11 66 8 8.2 108 Aug-11 85 20 4.2 100 Jul-11 119 40 3.0 86 Jun-11 155 24 6.5 98 May-11 165 36 4.6 82 Apr-11 194 31 6.3 69 Mar-11 180 19 9.5 50 Feb-11 153 13 11.8 92 Jan-11 128 6 21.3 53 Dec-10 105 7 15.0 57 Nov-10 113 8 14.1 34 Oct-10 124 7 17.7 41 Sep-10 134 10 13.4 108 Aug-10 150 10 15.0 122 Jul-10 187 23 8.1 91 Jun-10 221 15 14.7 95 May-10 221 17 13.0 72 Apr-10 214 34 6.3 61 Mar-10 207 16 12.9 49 Feb-10 178 6 29.7 123 Jan-10 137 10 13.7 189 Dec-09 103 8 12.9 55 Clarus MarketMetrics® 2 of 2 01/04/2012 Information not guaranteed. © 2009-2010 Terradatum and its suppliers and licensors (www.terradatum.com/about/licensors.td). www.TaylorRealEstateAustin.com | Direct: 512.796.4447 | Fax: 512.628.7720 | 2525 Wallingwood Bldg. 7C Austin, TX 78746 20 of 20