Weitere ähnliche Inhalte
Ähnlich wie Areas 10N, 10S South Austin
Ähnlich wie Areas 10N, 10S South Austin (20)
Mehr von Taylor Real Estate
6,7, 78704, travis heights, bouldin creek, barton hills6,7, 78704, travis heights, bouldin creek, barton hillsTaylor Real Estate
Mehr von Taylor Real Estate (11)
Areas 10N, 10S South Austin
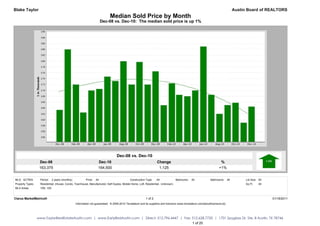
- 1. Blake Taylor Austin Board of REALTORS
Median Sold Price by Month
Dec-08 vs. Dec-10: The median sold price is up 1%
Dec-08 vs. Dec-10
Dec-08 Dec-10 Change %
163,375 164,500 1,125 +1%
MLS: ACTRIS Period: 2 years (monthly) Price: All Construction Type: All Bedrooms: All Bathrooms: All Lot Size: All
Property Types: Residential: (House, Condo, Townhouse, Manufactured, Half Duplex, Mobile Home, Loft, Residential - Unknown) Sq Ft: All
MLS Areas: 10N, 10S
Clarus MarketMetrics® 1 of 2 01/18/2011
Information not guaranteed. © 2009-2010 Terradatum and its suppliers and licensors (www.terradatum.com/about/licensors.td).
www.TaylorRealEstateAustin.com | www.EarlyBirdAustin.com | Direct: 512.796.4447 | Fax: 512.628.7720 | 1701 Spyglass Dr. Ste. 8 Austin, TX 78746
1 of 20
- 2. Blake Taylor Austin Board of REALTORS
Median Sold Price by Month
Dec-08 vs. Dec-10: The median sold price is up 1%
Time Period Median Price # Units Average DOM
Dec-10 164,500 68 91
Nov-10 159,000 60 64
Oct-10 165,798 42 67
Sep-10 165,000 57 57
Aug-10 162,000 61 58
Jul-10 168,500 61 44
Jun-10 184,968 93 36
May-10 170,000 106 38
Apr-10 168,000 115 45
Mar-10 168,500 90 39
Feb-10 172,380 54 39
Jan-10 164,950 43 48
Dec-09 176,500 56 34
Nov-09 172,000 83 40
Oct-09 179,700 100 37
Sep-09 172,000 105 46
Aug-09 179,950 98 48
Jul-09 173,202 100 45
Jun-09 174,700 120 52
May-09 170,500 82 38
Apr-09 170,000 77 53
Mar-09 162,469 62 61
Feb-09 172,000 44 64
Jan-09 184,000 33 71
Dec-08 163,375 68 67
Clarus MarketMetrics® 2 of 2 01/18/2011
Information not guaranteed. © 2009-2010 Terradatum and its suppliers and licensors (www.terradatum.com/about/licensors.td).
www.TaylorRealEstateAustin.com | www.EarlyBirdAustin.com | Direct: 512.796.4447 | Fax: 512.628.7720 | 1701 Spyglass Dr. Ste. 8 Austin, TX 78746
2 of 20
- 3. Blake Taylor Austin Board of REALTORS
Median For Sale vs. Median Sold
Dec-08 vs. Dec-10: The median price of for sale properties is down 4% and the median price of sold properties is up 1%
Dec-08 vs. Dec-10 Dec-08 vs. Dec-10
Dec-08 Dec-10 Change % Dec-08 Dec-10 Change %
177,925 170,000 -7,925 -4% 163,375 164,500 1,125 +1%
MLS: ACTRIS Period: 2 years (monthly) Price: All Construction Type: All Bedrooms: All Bathrooms: All Lot Size: All
Property Types: Residential: (House, Condo, Townhouse, Manufactured, Half Duplex, Mobile Home, Loft, Residential - Unknown) Sq Ft: All
MLS Areas: 10N, 10S
Clarus MarketMetrics® 1 of 2 01/18/2011
Information not guaranteed. © 2009-2010 Terradatum and its suppliers and licensors (www.terradatum.com/about/licensors.td).
www.TaylorRealEstateAustin.com | www.EarlyBirdAustin.com | Direct: 512.796.4447 | Fax: 512.628.7720 | 1701 Spyglass Dr. Ste. 8 Austin, TX 78746
3 of 20
- 4. Blake Taylor Austin Board of REALTORS
Median For Sale vs. Median Sold
Dec-08 vs. Dec-10: The median price of for sale properties is down 4% and the median price of sold properties is up 1%
For Sale # Properties Sold # Properties Price
Time Period Median For Sale Median Sold Difference
Dec-10 170,000 384 164,500 68 -5,500
Nov-10 171,975 431 159,000 60 -12,975
Oct-10 173,125 504 165,798 42 -7,328
Sep-10 173,000 524 165,000 57 -8,000
Aug-10 171,125 555 162,000 61 -9,125
Jul-10 172,900 555 168,500 61 -4,400
Jun-10 170,000 535 184,968 93 14,968
May-10 175,000 489 170,000 106 -5,000
Apr-10 179,800 561 168,000 115 -11,800
Mar-10 179,900 471 168,500 90 -11,400
Feb-10 180,000 375 172,380 54 -7,620
Jan-10 179,900 318 164,950 43 -14,950
Dec-09 183,400 303 176,500 56 -6,900
Nov-09 180,900 327 172,000 83 -8,900
Oct-09 183,950 348 179,700 100 -4,250
Sep-09 189,500 363 172,000 105 -17,500
Aug-09 183,995 367 179,950 98 -4,045
Jul-09 187,750 363 173,202 100 -14,548
Jun-09 184,900 363 174,700 120 -10,200
May-09 185,000 379 170,500 82 -14,500
Apr-09 185,000 385 170,000 77 -15,000
Mar-09 189,900 379 162,469 62 -27,431
Feb-09 185,000 330 172,000 44 -13,000
Jan-09 175,500 369 184,000 33 8,500
Dec-08 177,925 368 163,375 68 -14,550
Clarus MarketMetrics® 2 of 2 01/18/2011
Information not guaranteed. © 2009-2010 Terradatum and its suppliers and licensors (www.terradatum.com/about/licensors.td).
www.TaylorRealEstateAustin.com | www.EarlyBirdAustin.com | Direct: 512.796.4447 | Fax: 512.628.7720 | 1701 Spyglass Dr. Ste. 8 Austin, TX 78746
4 of 20
- 5. Blake Taylor Austin Board of REALTORS
Sold Properties by Month
Dec-08 vs. Dec-10: The number of Sold properties has not changed
Dec-08 vs. Dec-10
Dec-08 Dec-10 Change %
68 68 0 0%
MLS: ACTRIS Period: 2 years (monthly) Price: All Construction Type: All Bedrooms: All Bathrooms: All Lot Size: All
Property Types: Residential: (House, Condo, Townhouse, Manufactured, Half Duplex, Mobile Home, Loft, Residential - Unknown) Sq Ft: All
MLS Areas: 10N, 10S
Clarus MarketMetrics® 1 of 2 01/18/2011
Information not guaranteed. © 2009-2010 Terradatum and its suppliers and licensors (www.terradatum.com/about/licensors.td).
www.TaylorRealEstateAustin.com | www.EarlyBirdAustin.com | Direct: 512.796.4447 | Fax: 512.628.7720 | 1701 Spyglass Dr. Ste. 8 Austin, TX 78746
5 of 20
- 6. Blake Taylor Austin Board of REALTORS
Sold Properties by Month
Dec-08 vs. Dec-10: The number of Sold properties has not changed
Full Market Bank Properties Non-Bank Properties
Time Period # Properties Median Price Average DOM # Properties % Bank Median Price # Properties % Non-Bank Median Price
Dec-10 68 164,500 91 6 8.8 132,450 62 91.2 175,750
Nov-10 60 159,000 64 7 11.7 130,000 53 88.3 160,000
Oct-10 42 165,798 67 3 7.1 123,000 39 92.9 168,000
Sep-10 57 165,000 57 2 3.5 101,250 55 96.5 165,000
Aug-10 61 162,000 58 3 4.9 139,500 58 95.1 164,500
Jul-10 61 168,500 44 2 3.3 131,188 59 96.7 173,000
Jun-10 93 184,968 36 2 2.1 157,000 91 97.8 184,968
May-10 106 170,000 38 3 2.8 131,730 103 97.2 172,000
Apr-10 115 168,000 45 0 115 100.0 168,000
Mar-10 90 168,500 39 2 2.2 160,525 88 97.8 168,500
Feb-10 54 172,380 39 4 7.4 154,750 50 92.6 174,380
Jan-10 43 164,950 48 3 7.0 79,000 40 93.0 165,750
Dec-09 56 176,500 34 2 3.6 159,800 54 96.4 176,500
Nov-09 83 172,000 40 6 7.2 149,950 77 92.8 175,000
Oct-09 100 179,700 37 3 3.0 115,000 97 97.0 180,000
Sep-09 105 172,000 46 3 2.9 155,000 102 97.1 172,500
Aug-09 98 179,950 48 6 6.1 157,000 92 93.9 180,700
Jul-09 100 173,202 45 5 5.0 145,784 95 95.0 174,000
Jun-09 120 174,700 52 4 3.3 152,500 116 96.7 175,000
May-09 82 170,500 38 1 1.2 183,500 81 98.8 170,000
Apr-09 77 170,000 53 5 6.5 120,000 72 93.5 171,382
Mar-09 62 162,469 61 2 3.2 136,400 60 96.8 163,219
Feb-09 44 172,000 64 1 2.3 196,000 43 97.7 171,000
Jan-09 33 184,000 71 3 9.1 170,000 30 90.9 184,750
Dec-08 68 163,375 67 0 68 100.0 163,375
Clarus MarketMetrics® 2 of 2 01/18/2011
Information not guaranteed. © 2009-2010 Terradatum and its suppliers and licensors (www.terradatum.com/about/licensors.td).
www.TaylorRealEstateAustin.com | www.EarlyBirdAustin.com | Direct: 512.796.4447 | Fax: 512.628.7720 | 1701 Spyglass Dr. Ste. 8 Austin, TX 78746
6 of 20
- 7. Blake Taylor Austin Board of REALTORS
Under Contract Properties by Month
Dec-08 vs. Dec-10: The number of Under Contract properties is up 44%
Dec-08 vs. Dec-10
Dec-08 Dec-10 Change %
39 56 17 +44%
MLS: ACTRIS Period: 2 years (monthly) Price: All Construction Type: All Bedrooms: All Bathrooms: All Lot Size: All
Property Types: Residential: (House, Condo, Townhouse, Manufactured, Half Duplex, Mobile Home, Loft, Residential - Unknown) Sq Ft: All
MLS Areas: 10N, 10S
Clarus MarketMetrics® 1 of 2 01/18/2011
Information not guaranteed. © 2009-2010 Terradatum and its suppliers and licensors (www.terradatum.com/about/licensors.td).
www.TaylorRealEstateAustin.com | www.EarlyBirdAustin.com | Direct: 512.796.4447 | Fax: 512.628.7720 | 1701 Spyglass Dr. Ste. 8 Austin, TX 78746
7 of 20
- 8. Blake Taylor Austin Board of REALTORS
Under Contract Properties by Month
Dec-08 vs. Dec-10: The number of Under Contract properties is up 44%
Full Market Bank Properties Non-Bank Properties
Time Period # Properties Median Price Average DOM # Properties % Bank Median Price # Properties % Non-Bank Median Price
Dec-10 56 162,500 91 9 16.1 145,000 47 83.9 166,500
Nov-10 49 169,900 84 6 12.2 114,900 43 87.8 179,000
Oct-10 63 169,900 71 3 4.8 139,900 60 95.2 169,950
Sep-10 47 168,000 75 2 4.3 115,950 45 95.7 168,618
Aug-10 57 164,900 47 5 8.8 140,000 52 91.2 164,995
Jul-10 63 179,900 61 3 4.8 139,500 60 95.2 181,402
Jun-10 62 168,500 46 3 4.8 139,500 59 95.2 179,000
May-10 51 191,673 41 2 3.9 222,400 49 96.1 191,673
Apr-10 146 177,700 38 2 1.4 169,950 144 98.6 177,700
Mar-10 111 169,900 35 1 0.9 117,500 110 99.1 169,925
Feb-10 84 171,500 50 1 1.2 174,900 83 98.8 169,999
Jan-10 65 169,900 38 3 4.6 149,000 62 95.4 169,945
Dec-09 53 176,900 53 5 9.4 145,000 48 90.6 177,925
Nov-09 47 160,000 25 3 6.4 112,000 44 93.6 166,995
Oct-09 76 169,900 40 3 4.0 159,900 73 96.0 170,000
Sep-09 99 189,000 31 3 3.0 155,000 96 97.0 189,700
Aug-09 114 174,950 46 7 6.1 159,900 107 93.9 177,840
Jul-09 103 179,900 45 5 4.8 159,900 98 95.2 181,250
Jun-09 94 176,900 44 3 3.2 169,900 91 96.8 178,800
May-09 108 177,070 49 4 3.7 164,900 104 96.3 177,070
Apr-09 83 169,965 35 2 2.4 158,950 81 97.6 172,500
Mar-09 90 174,900 62 3 3.3 129,950 87 96.7 174,900
Feb-09 53 163,900 60 3 5.7 129,900 50 94.3 164,450
Jan-09 53 165,000 74 2 3.8 169,950 51 96.2 165,000
Dec-08 39 179,000 70 2 5.1 202,250 37 94.9 177,500
Clarus MarketMetrics® 2 of 2 01/18/2011
Information not guaranteed. © 2009-2010 Terradatum and its suppliers and licensors (www.terradatum.com/about/licensors.td).
www.TaylorRealEstateAustin.com | www.EarlyBirdAustin.com | Direct: 512.796.4447 | Fax: 512.628.7720 | 1701 Spyglass Dr. Ste. 8 Austin, TX 78746
8 of 20
- 9. Blake Taylor Austin Board of REALTORS
New Properties by Month
Dec-08 vs. Dec-10: The number of New properties is down 2%
Dec-08 vs. Dec-10
Dec-08 Dec-10 Change %
53 52 -1 -2%
MLS: ACTRIS Period: 2 years (monthly) Price: All Construction Type: All Bedrooms: All Bathrooms: All Lot Size: All
Property Types: Residential: (House, Condo, Townhouse, Manufactured, Half Duplex, Mobile Home, Loft, Residential - Unknown) Sq Ft: All
MLS Areas: 10N, 10S
Clarus MarketMetrics® 1 of 2 01/18/2011
Information not guaranteed. © 2009-2010 Terradatum and its suppliers and licensors (www.terradatum.com/about/licensors.td).
www.TaylorRealEstateAustin.com | www.EarlyBirdAustin.com | Direct: 512.796.4447 | Fax: 512.628.7720 | 1701 Spyglass Dr. Ste. 8 Austin, TX 78746
9 of 20
- 10. Blake Taylor Austin Board of REALTORS
New Properties by Month
Dec-08 vs. Dec-10: The number of New properties is down 2%
Full Market Bank Properties Non-Bank Properties
Time Period # Properties Median Price # Properties % Bank Median Price # Properties % Non-Bank Median Price
Dec-10 52 168,750 4 7.7 139,700 48 92.3 179,000
Nov-10 62 164,250 10 16.1 127,000 52 83.9 169,950
Oct-10 101 178,800 4 4.0 149,900 97 96.0 180,000
Sep-10 121 179,444 6 5.0 130,200 115 95.0 181,990
Aug-10 122 169,900 6 4.9 137,400 116 95.1 169,900
Jul-10 139 185,000 6 4.3 137,450 133 95.7 185,444
Jun-10 133 169,000 7 5.3 144,900 126 94.7 169,250
May-10 107 165,000 6 5.6 142,250 101 94.4 165,500
Apr-10 233 174,900 3 1.3 169,500 230 98.7 174,900
Mar-10 201 179,000 5 2.5 117,500 196 97.5 179,450
Feb-10 146 179,850 3 2.0 147,900 143 98.0 179,900
Jan-10 112 179,850 2 1.8 165,950 110 98.2 179,850
Dec-09 57 164,950 4 7.0 129,900 53 93.0 165,000
Nov-09 89 179,900 5 5.6 164,900 84 94.4 180,950
Oct-09 114 169,974 3 2.6 99,950 111 97.4 170,000
Sep-09 136 189,000 5 3.7 157,000 131 96.3 189,900
Aug-09 142 176,000 3 2.1 145,000 139 97.9 177,000
Jul-09 113 183,500 9 8.0 159,900 104 92.0 185,950
Jun-09 130 179,900 5 3.9 154,900 125 96.2 179,900
May-09 113 185,000 2 1.8 164,900 111 98.2 187,500
Apr-09 135 179,900 3 2.2 117,500 132 97.8 179,900
Mar-09 131 182,500 4 3.0 151,050 127 97.0 187,000
Feb-09 78 189,925 3 3.9 135,000 75 96.2 193,500
Jan-09 83 182,500 1 1.2 116,100 82 98.8 183,450
Dec-08 53 184,900 2 3.8 152,475 51 96.2 184,900
Clarus MarketMetrics® 2 of 2 01/18/2011
Information not guaranteed. © 2009-2010 Terradatum and its suppliers and licensors (www.terradatum.com/about/licensors.td).
www.TaylorRealEstateAustin.com | www.EarlyBirdAustin.com | Direct: 512.796.4447 | Fax: 512.628.7720 | 1701 Spyglass Dr. Ste. 8 Austin, TX 78746
10 of 20
- 11. Blake Taylor Austin Board of REALTORS
For Sale Properties by Month
Dec-08 vs. Dec-10: The number of For Sale properties is up 4%
Dec-08 vs. Dec-10
Dec-08 Dec-10 Change %
368 384 16 +4%
MLS: ACTRIS Period: 2 years (monthly) Price: All Construction Type: All Bedrooms: All Bathrooms: All Lot Size: All
Property Types: Residential: (House, Condo, Townhouse, Manufactured, Half Duplex, Mobile Home, Loft, Residential - Unknown) Sq Ft: All
MLS Areas: 10N, 10S
Clarus MarketMetrics® 1 of 2 01/18/2011
Information not guaranteed. © 2009-2010 Terradatum and its suppliers and licensors (www.terradatum.com/about/licensors.td).
www.TaylorRealEstateAustin.com | www.EarlyBirdAustin.com | Direct: 512.796.4447 | Fax: 512.628.7720 | 1701 Spyglass Dr. Ste. 8 Austin, TX 78746
11 of 20
- 12. Blake Taylor Austin Board of REALTORS
For Sale Properties by Month
Dec-08 vs. Dec-10: The number of For Sale properties is up 4%
Full Market Bank Properties Non-Bank Properties
Time Period # Properties Median Price Average DOM # Properties % Bank Median Price # Properties % Non-Bank Median Price
Dec-10 384 170,000 124 25 6.5 145,000 359 93.5 174,000
Nov-10 431 171,975 131 29 6.7 139,900 402 93.3 174,945
Oct-10 504 173,125 131 24 4.8 147,450 480 95.2 174,900
Sep-10 524 173,000 135 23 4.4 139,900 501 95.6 174,900
Aug-10 555 171,125 133 24 4.3 139,950 531 95.7 173,250
Jul-10 555 172,900 134 21 3.8 140,000 534 96.2 174,700
Jun-10 535 170,000 130 19 3.5 140,000 516 96.5 172,600
May-10 489 175,000 133 14 2.9 139,950 475 97.1 175,000
Apr-10 561 179,800 115 11 2.0 140,000 550 98.0 179,900
Mar-10 471 179,900 112 10 2.1 137,450 461 97.9 179,999
Feb-10 375 180,000 114 6 1.6 156,450 369 98.4 182,500
Jan-10 318 179,900 122 6 1.9 161,950 312 98.1 179,900
Dec-09 303 183,400 128 10 3.3 142,000 293 96.7 184,900
Nov-09 327 180,900 119 11 3.4 142,405 316 96.6 183,950
Oct-09 348 183,950 111 10 2.9 142,405 338 97.1 184,900
Sep-09 363 189,500 101 10 2.8 154,950 353 97.2 189,900
Aug-09 367 183,995 102 15 4.1 145,000 352 95.9 184,950
Jul-09 363 187,750 105 17 4.7 154,900 346 95.3 189,408
Jun-09 363 184,900 111 11 3.0 152,100 352 97.0 185,000
May-09 379 185,000 107 10 2.6 146,000 369 97.4 188,500
Apr-09 385 185,000 107 12 3.1 151,050 373 96.9 188,500
Mar-09 379 189,900 115 13 3.4 150,000 366 96.6 189,900
Feb-09 330 185,000 132 12 3.6 137,450 318 96.4 186,450
Jan-09 369 175,500 132 12 3.2 162,400 357 96.8 176,990
Dec-08 368 177,925 136 13 3.5 175,000 355 96.5 177,950
Clarus MarketMetrics® 2 of 2 01/18/2011
Information not guaranteed. © 2009-2010 Terradatum and its suppliers and licensors (www.terradatum.com/about/licensors.td).
www.TaylorRealEstateAustin.com | www.EarlyBirdAustin.com | Direct: 512.796.4447 | Fax: 512.628.7720 | 1701 Spyglass Dr. Ste. 8 Austin, TX 78746
12 of 20
- 13. Blake Taylor Austin Board of REALTORS
Expired Properties by Month
Dec-08 vs. Dec-10: The number of Expired properties is up 33%
Dec-08 vs. Dec-10
Dec-08 Dec-10 Change %
43 57 14 +33%
MLS: ACTRIS Period: 2 years (monthly) Price: All Construction Type: All Bedrooms: All Bathrooms: All Lot Size: All
Property Types: Residential: (House, Condo, Townhouse, Manufactured, Half Duplex, Mobile Home, Loft, Residential - Unknown) Sq Ft: All
MLS Areas: 10N, 10S
Clarus MarketMetrics® 1 of 2 01/18/2011
Information not guaranteed. © 2009-2010 Terradatum and its suppliers and licensors (www.terradatum.com/about/licensors.td).
www.TaylorRealEstateAustin.com | www.EarlyBirdAustin.com | Direct: 512.796.4447 | Fax: 512.628.7720 | 1701 Spyglass Dr. Ste. 8 Austin, TX 78746
13 of 20
- 14. Blake Taylor Austin Board of REALTORS
Expired Properties by Month
Dec-08 vs. Dec-10: The number of Expired properties is up 33%
Full Market Bank Properties Non-Bank Properties
Time Period # Properties Median Price Average DOM # Properties % Bank Median Price # Properties % Non-Bank Median Price
Dec-10 57 169,900 134 2 3.5 149,950 55 96.5 169,900
Nov-10 50 184,900 128 2 4.0 137,450 48 96.0 184,900
Oct-10 72 171,000 110 2 2.8 177,200 70 97.2 171,000
Sep-10 74 179,700 100 1 1.4 144,900 73 98.7 179,900
Aug-10 95 177,900 105 2 2.1 97,400 93 97.9 179,000
Jul-10 59 175,000 105 0 59 100.0 175,000
Jun-10 57 190,000 69 1 1.8 194,425 56 98.2 189,950
May-10 36 193,450 86 0 36 100.0 193,450
Apr-10 33 194,980 116 1 3.0 264,900 32 97.0 192,440
Mar-10 32 193,250 84 1 3.1 147,900 31 96.9 194,500
Feb-10 21 212,000 123 0 21 100.0 212,000
Jan-10 24 180,450 132 0 24 100.0 180,450
Dec-09 44 197,750 101 1 2.3 75,000 43 97.7 199,500
Nov-09 34 187,750 80 2 5.9 140,702 32 94.1 192,000
Oct-09 34 213,950 98 1 2.9 142,405 33 97.1 214,900
Sep-09 30 194,814 95 0 30 100.0 194,814
Aug-09 26 196,948 116 3 11.5 135,000 23 88.5 209,900
Jul-09 35 217,000 105 0 35 100.0 217,000
Jun-09 19 197,500 187 0 19 100.0 197,500
May-09 38 202,500 73 0 38 100.0 202,500
Apr-09 36 212,000 100 2 5.6 230,000 34 94.4 212,000
Mar-09 39 195,000 118 1 2.6 134,900 38 97.4 197,450
Feb-09 29 179,900 93 0 29 100.0 179,900
Jan-09 64 165,450 102 1 1.6 199,000 63 98.4 165,450
Dec-08 43 189,950 102 0 43 100.0 189,950
Clarus MarketMetrics® 2 of 2 01/18/2011
Information not guaranteed. © 2009-2010 Terradatum and its suppliers and licensors (www.terradatum.com/about/licensors.td).
www.TaylorRealEstateAustin.com | www.EarlyBirdAustin.com | Direct: 512.796.4447 | Fax: 512.628.7720 | 1701 Spyglass Dr. Ste. 8 Austin, TX 78746
14 of 20
- 15. Blake Taylor Austin Board of REALTORS
Supply & Demand by Month
Dec-08 vs. Dec-10: The number of for sale properties is up 4% and the number of sold properties has not changed
Dec-08 vs. Dec-10 Dec-08 vs. Dec-10
Dec-08 Dec-10 Change % Dec-08 Dec-10 Change %
368 384 16 +4% 68 68 0 0%
MLS: ACTRIS Period: 2 years (monthly) Price: All Construction Type: All Bedrooms: All Bathrooms: All Lot Size: All
Property Types: Residential: (House, Condo, Townhouse, Manufactured, Half Duplex, Mobile Home, Loft, Residential - Unknown) Sq Ft: All
MLS Areas: 10N, 10S
Clarus MarketMetrics® 1 of 2 01/18/2011
Information not guaranteed. © 2009-2010 Terradatum and its suppliers and licensors (www.terradatum.com/about/licensors.td).
www.TaylorRealEstateAustin.com | www.EarlyBirdAustin.com | Direct: 512.796.4447 | Fax: 512.628.7720 | 1701 Spyglass Dr. Ste. 8 Austin, TX 78746
15 of 20
- 16. Blake Taylor Austin Board of REALTORS
Supply & Demand by Month
Dec-08 vs. Dec-10: The number of for sale properties is up 4% and the number of sold properties has not changed
# Properties Average DOM # Properties Average DOM
Time Period For Sale For Sale Sold Sold
Dec-10 384 124 68 91
Nov-10 431 131 60 64
Oct-10 504 131 42 67
Sep-10 524 135 57 57
Aug-10 555 133 61 58
Jul-10 555 134 61 44
Jun-10 535 130 93 36
May-10 489 133 106 38
Apr-10 561 115 115 45
Mar-10 471 112 90 39
Feb-10 375 114 54 39
Jan-10 318 122 43 48
Dec-09 303 128 56 34
Nov-09 327 119 83 40
Oct-09 348 111 100 37
Sep-09 363 101 105 46
Aug-09 367 102 98 48
Jul-09 363 105 100 45
Jun-09 363 111 120 52
May-09 379 107 82 38
Apr-09 385 107 77 53
Mar-09 379 115 62 61
Feb-09 330 132 44 64
Jan-09 369 132 33 71
Dec-08 368 136 68 67
Clarus MarketMetrics® 2 of 2 01/18/2011
Information not guaranteed. © 2009-2010 Terradatum and its suppliers and licensors (www.terradatum.com/about/licensors.td).
www.TaylorRealEstateAustin.com | www.EarlyBirdAustin.com | Direct: 512.796.4447 | Fax: 512.628.7720 | 1701 Spyglass Dr. Ste. 8 Austin, TX 78746
16 of 20
- 17. Blake Taylor Austin Board of REALTORS
The Average Days on Market by Month
Dec-08 vs. Dec-10: The average days on market is up 30%
Dec-08 vs. Dec-10
Dec-08 Dec-10 Change %
70 91 21 +30%
MLS: ACTRIS Period: 2 years (monthly) Price: All Construction Type: All Bedrooms: All Bathrooms: All Lot Size: All
Property Types: Residential: (House, Condo, Townhouse, Manufactured, Half Duplex, Mobile Home, Loft, Residential - Unknown) Sq Ft: All
MLS Areas: 10N, 10S
Clarus MarketMetrics® 1 of 2 01/18/2011
Information not guaranteed. © 2009-2010 Terradatum and its suppliers and licensors (www.terradatum.com/about/licensors.td).
www.TaylorRealEstateAustin.com | www.EarlyBirdAustin.com | Direct: 512.796.4447 | Fax: 512.628.7720 | 1701 Spyglass Dr. Ste. 8 Austin, TX 78746
17 of 20
- 18. Blake Taylor Austin Board of REALTORS
The Average Days on Market by Month
Dec-08 vs. Dec-10: The average days on market is up 30%
Time Period Average DOM # UC Units
Dec-10 91 56
Nov-10 84 49
Oct-10 71 63
Sep-10 75 47
Aug-10 47 57
Jul-10 61 63
Jun-10 46 62
May-10 41 51
Apr-10 38 146
Mar-10 35 111
Feb-10 50 84
Jan-10 38 65
Dec-09 53 53
Nov-09 25 47
Oct-09 40 76
Sep-09 31 99
Aug-09 46 114
Jul-09 45 103
Jun-09 44 94
May-09 49 108
Apr-09 35 83
Mar-09 62 90
Feb-09 60 53
Jan-09 74 53
Dec-08 70 39
Clarus MarketMetrics® 2 of 2 01/18/2011
Information not guaranteed. © 2009-2010 Terradatum and its suppliers and licensors (www.terradatum.com/about/licensors.td).
www.TaylorRealEstateAustin.com | www.EarlyBirdAustin.com | Direct: 512.796.4447 | Fax: 512.628.7720 | 1701 Spyglass Dr. Ste. 8 Austin, TX 78746
18 of 20
- 19. Blake Taylor Austin Board of REALTORS
Months Supply of Inventory
Dec-08 vs. Dec-10: The average months supply of inventory is down 34%
Dec-08 vs. Dec-10
Dec-08 Dec-10 Change %
7.3 4.8 -2.5 -34%
MLS: ACTRIS Period: 2 years (monthly) Price: All Construction Type: All Bedrooms: All Bathrooms: All Lot Size: All
Property Types: Residential: (House, Condo, Townhouse, Manufactured, Half Duplex, Mobile Home, Loft, Residential - Unknown) Sq Ft: All
MLS Areas: 10N, 10S
Clarus MarketMetrics® 1 of 2 01/18/2011
Information not guaranteed. © 2009-2010 Terradatum and its suppliers and licensors (www.terradatum.com/about/licensors.td).
www.TaylorRealEstateAustin.com | www.EarlyBirdAustin.com | Direct: 512.796.4447 | Fax: 512.628.7720 | 1701 Spyglass Dr. Ste. 8 Austin, TX 78746
19 of 20
- 20. Blake Taylor Austin Board of REALTORS
Months Supply of Inventory
Dec-08 vs. Dec-10: The average months supply of inventory is down 34%
# Units For Sale # UC Units UC Average
Time Period Last Day of Month During Month MSI DOM
Dec-10 271 56 4.8 91
Nov-10 332 49 6.8 84
Oct-10 369 63 5.9 71
Sep-10 403 47 8.6 75
Aug-10 403 57 7.1 47
Jul-10 433 63 6.9 61
Jun-10 416 62 6.7 46
May-10 402 51 7.9 41
Apr-10 382 146 2.6 38
Mar-10 328 111 3.0 35
Feb-10 270 84 3.2 50
Jan-10 229 65 3.5 38
Dec-09 206 53 3.9 53
Nov-09 246 47 5.2 25
Oct-09 238 76 3.1 40
Sep-09 234 99 2.4 31
Aug-09 227 114 2.0 46
Jul-09 225 103 2.2 45
Jun-09 250 94 2.7 44
May-09 233 108 2.2 49
Apr-09 266 83 3.2 35
Mar-09 250 90 2.8 62
Feb-09 248 53 4.7 60
Jan-09 252 53 4.8 74
Dec-08 286 39 7.3 70
Clarus MarketMetrics® 2 of 2 01/18/2011
Information not guaranteed. © 2009-2010 Terradatum and its suppliers and licensors (www.terradatum.com/about/licensors.td).
www.TaylorRealEstateAustin.com | www.EarlyBirdAustin.com | Direct: 512.796.4447 | Fax: 512.628.7720 | 1701 Spyglass Dr. Ste. 8 Austin, TX 78746
20 of 20