Area 8e, 8w westlake
•
0 gefällt mir•209 views

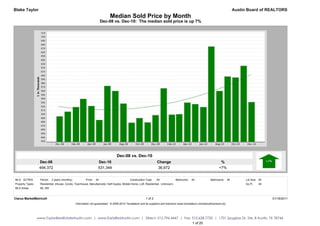
The document provides real estate data for the Austin, Texas market comparing December 2008 to December 2010. It shows that: 1) The median sold price of homes increased 7% from $494,372 in December 2008 to $531,344 in December 2010. 2) The median price of homes for sale increased 22% from $699,250 to $849,900 over the same period, while the median price of homes sold increased 7%. 3) The number of homes sold increased 27% from 30 in December 2008 to 38 in December 2010.

Empfohlen
Weitere ähnliche Inhalte
Was ist angesagt?
Was ist angesagt? (19)
Ähnlich wie Area 8e, 8w westlake
Ähnlich wie Area 8e, 8w westlake (20)
Area 8e, 8w westlake
- 1. Blake Taylor Austin Board of REALTORS Median Sold Price by Month Dec-08 vs. Dec-10: The median sold price is up 7% Dec-08 vs. Dec-10 Dec-08 Dec-10 Change % 494,372 531,344 36,972 +7% MLS: ACTRIS Period: 2 years (monthly) Price: All Construction Type: All Bedrooms: All Bathrooms: All Lot Size: All Property Types: Residential: (House, Condo, Townhouse, Manufactured, Half Duplex, Mobile Home, Loft, Residential - Unknown) Sq Ft: All MLS Areas: 8E, 8W Clarus MarketMetrics® 1 of 2 01/18/2011 Information not guaranteed. © 2009-2010 Terradatum and its suppliers and licensors (www.terradatum.com/about/licensors.td). www.TaylorRealEstateAustin.com | www.EarlyBirdAustin.com | Direct: 512.796.4447 | Fax: 512.628.7720 | 1701 Spyglass Dr. Ste. 8 Austin, TX 78746 1 of 20
- 2. Blake Taylor Austin Board of REALTORS Median Sold Price by Month Dec-08 vs. Dec-10: The median sold price is up 7% Time Period Median Price # Units Average DOM Dec-10 531,344 38 105 Nov-10 625,000 35 99 Oct-10 595,000 23 80 Sep-10 597,500 29 73 Aug-10 560,000 49 89 Jul-10 675,000 59 68 Jun-10 518,500 76 79 May-10 526,000 56 64 Apr-10 530,000 49 86 Mar-10 500,000 37 73 Feb-10 498,700 34 86 Jan-10 566,875 28 82 Dec-09 497,500 34 104 Nov-09 478,880 32 93 Oct-09 490,000 45 105 Sep-09 478,050 45 85 Aug-09 527,500 52 91 Jul-09 560,000 47 88 Jun-09 573,000 47 89 May-09 485,000 53 71 Apr-09 521,250 28 90 Mar-09 539,500 26 92 Feb-09 518,500 24 115 Jan-09 506,500 16 105 Dec-08 494,372 30 80 Clarus MarketMetrics® 2 of 2 01/18/2011 Information not guaranteed. © 2009-2010 Terradatum and its suppliers and licensors (www.terradatum.com/about/licensors.td). www.TaylorRealEstateAustin.com | www.EarlyBirdAustin.com | Direct: 512.796.4447 | Fax: 512.628.7720 | 1701 Spyglass Dr. Ste. 8 Austin, TX 78746 2 of 20
- 3. Blake Taylor Austin Board of REALTORS Median For Sale vs. Median Sold Dec-08 vs. Dec-10: The median price of for sale properties is up 22% and the median price of sold properties is up 7% Dec-08 vs. Dec-10 Dec-08 vs. Dec-10 Dec-08 Dec-10 Change % Dec-08 Dec-10 Change % 699,250 849,900 150,650 +22% 494,372 531,344 36,972 +7% MLS: ACTRIS Period: 2 years (monthly) Price: All Construction Type: All Bedrooms: All Bathrooms: All Lot Size: All Property Types: Residential: (House, Condo, Townhouse, Manufactured, Half Duplex, Mobile Home, Loft, Residential - Unknown) Sq Ft: All MLS Areas: 8E, 8W Clarus MarketMetrics® 1 of 2 01/18/2011 Information not guaranteed. © 2009-2010 Terradatum and its suppliers and licensors (www.terradatum.com/about/licensors.td). www.TaylorRealEstateAustin.com | www.EarlyBirdAustin.com | Direct: 512.796.4447 | Fax: 512.628.7720 | 1701 Spyglass Dr. Ste. 8 Austin, TX 78746 3 of 20
- 4. Blake Taylor Austin Board of REALTORS Median For Sale vs. Median Sold Dec-08 vs. Dec-10: The median price of for sale properties is up 22% and the median price of sold properties is up 7% For Sale # Properties Sold # Properties Price Time Period Median For Sale Median Sold Difference Dec-10 849,900 313 531,344 38 -318,556 Nov-10 799,999 375 625,000 35 -174,999 Oct-10 799,500 412 595,000 23 -204,500 Sep-10 799,000 430 597,500 29 -201,500 Aug-10 799,000 469 560,000 49 -239,000 Jul-10 799,000 502 675,000 59 -124,000 Jun-10 799,500 506 518,500 76 -281,000 May-10 799,900 481 526,000 56 -273,900 Apr-10 742,000 476 530,000 49 -212,000 Mar-10 719,000 415 500,000 37 -219,000 Feb-10 744,836 352 498,700 34 -246,136 Jan-10 785,000 321 566,875 28 -218,125 Dec-09 750,000 331 497,500 34 -252,500 Nov-09 789,000 400 478,880 32 -310,120 Oct-09 799,000 441 490,000 45 -309,000 Sep-09 791,500 480 478,050 45 -313,450 Aug-09 749,000 533 527,500 52 -221,500 Jul-09 739,450 542 560,000 47 -179,450 Jun-09 730,450 536 573,000 47 -157,450 May-09 732,450 510 485,000 53 -247,450 Apr-09 739,950 488 521,250 28 -218,700 Mar-09 715,000 441 539,500 26 -175,500 Feb-09 699,900 370 518,500 24 -181,400 Jan-09 699,950 352 506,500 16 -193,450 Dec-08 699,250 360 494,372 30 -204,878 Clarus MarketMetrics® 2 of 2 01/18/2011 Information not guaranteed. © 2009-2010 Terradatum and its suppliers and licensors (www.terradatum.com/about/licensors.td). www.TaylorRealEstateAustin.com | www.EarlyBirdAustin.com | Direct: 512.796.4447 | Fax: 512.628.7720 | 1701 Spyglass Dr. Ste. 8 Austin, TX 78746 4 of 20
- 5. Blake Taylor Austin Board of REALTORS Sold Properties by Month Dec-08 vs. Dec-10: The number of Sold properties is up 27% Dec-08 vs. Dec-10 Dec-08 Dec-10 Change % 30 38 8 +27% MLS: ACTRIS Period: 2 years (monthly) Price: All Construction Type: All Bedrooms: All Bathrooms: All Lot Size: All Property Types: Residential: (House, Condo, Townhouse, Manufactured, Half Duplex, Mobile Home, Loft, Residential - Unknown) Sq Ft: All MLS Areas: 8E, 8W Clarus MarketMetrics® 1 of 2 01/18/2011 Information not guaranteed. © 2009-2010 Terradatum and its suppliers and licensors (www.terradatum.com/about/licensors.td). www.TaylorRealEstateAustin.com | www.EarlyBirdAustin.com | Direct: 512.796.4447 | Fax: 512.628.7720 | 1701 Spyglass Dr. Ste. 8 Austin, TX 78746 5 of 20
- 6. Blake Taylor Austin Board of REALTORS Sold Properties by Month Dec-08 vs. Dec-10: The number of Sold properties is up 27% Full Market Bank Properties Non-Bank Properties Time Period # Properties Median Price Average DOM # Properties % Bank Median Price # Properties % Non-Bank Median Price Dec-10 38 531,344 105 1 2.6 352,500 37 97.4 533,688 Nov-10 35 625,000 99 1 2.9 390,000 34 97.1 629,625 Oct-10 23 595,000 80 1 4.3 976,000 22 95.7 572,000 Sep-10 29 597,500 73 2 6.9 396,500 27 93.1 690,000 Aug-10 49 560,000 89 2 4.1 708,500 47 95.9 560,000 Jul-10 59 675,000 68 1 1.7 999,000 58 98.3 652,750 Jun-10 76 518,500 79 1 1.3 272,500 75 98.7 520,000 May-10 56 526,000 64 1 1.8 359,900 55 98.2 530,000 Apr-10 49 530,000 86 2 4.1 295,750 47 95.9 534,000 Mar-10 37 500,000 73 0 37 100.0 500,000 Feb-10 34 498,700 86 3 8.8 392,040 31 91.2 527,400 Jan-10 28 566,875 82 1 3.6 282,500 27 96.4 568,750 Dec-09 34 497,500 104 2 5.9 1,167,500 32 94.1 472,500 Nov-09 32 478,880 93 1 3.1 671,000 31 96.9 454,500 Oct-09 45 490,000 105 1 2.2 260,000 44 97.8 495,000 Sep-09 45 478,050 85 0 45 100.0 478,050 Aug-09 52 527,500 91 5 9.6 400,000 47 90.4 538,000 Jul-09 47 560,000 88 0 47 100.0 560,000 Jun-09 47 573,000 89 0 47 100.0 573,000 May-09 53 485,000 71 2 3.8 395,000 51 96.2 489,500 Apr-09 28 521,250 90 0 28 100.0 521,250 Mar-09 26 539,500 92 2 7.7 1,100,000 24 92.3 509,450 Feb-09 24 518,500 115 0 24 100.0 518,500 Jan-09 16 506,500 105 0 16 100.0 506,500 Dec-08 30 494,372 80 1 3.3 2,050,000 29 96.7 489,745 Clarus MarketMetrics® 2 of 2 01/18/2011 Information not guaranteed. © 2009-2010 Terradatum and its suppliers and licensors (www.terradatum.com/about/licensors.td). www.TaylorRealEstateAustin.com | www.EarlyBirdAustin.com | Direct: 512.796.4447 | Fax: 512.628.7720 | 1701 Spyglass Dr. Ste. 8 Austin, TX 78746 6 of 20
- 7. Blake Taylor Austin Board of REALTORS Under Contract Properties by Month Dec-08 vs. Dec-10: The number of Under Contract properties is up 65% Dec-08 vs. Dec-10 Dec-08 Dec-10 Change % 17 28 11 +65% MLS: ACTRIS Period: 2 years (monthly) Price: All Construction Type: All Bedrooms: All Bathrooms: All Lot Size: All Property Types: Residential: (House, Condo, Townhouse, Manufactured, Half Duplex, Mobile Home, Loft, Residential - Unknown) Sq Ft: All MLS Areas: 8E, 8W Clarus MarketMetrics® 1 of 2 01/18/2011 Information not guaranteed. © 2009-2010 Terradatum and its suppliers and licensors (www.terradatum.com/about/licensors.td). www.TaylorRealEstateAustin.com | www.EarlyBirdAustin.com | Direct: 512.796.4447 | Fax: 512.628.7720 | 1701 Spyglass Dr. Ste. 8 Austin, TX 78746 7 of 20
- 8. Blake Taylor Austin Board of REALTORS Under Contract Properties by Month Dec-08 vs. Dec-10: The number of Under Contract properties is up 65% Full Market Bank Properties Non-Bank Properties Time Period # Properties Median Price Average DOM # Properties % Bank Median Price # Properties % Non-Bank Median Price Dec-10 28 436,750 121 1 3.6 426,400 27 96.4 444,500 Nov-10 30 644,000 80 1 3.3 419,900 29 96.7 649,000 Oct-10 38 599,000 86 2 5.3 775,500 36 94.7 599,000 Sep-10 19 650,000 115 1 5.3 400,000 18 94.7 650,000 Aug-10 45 599,000 71 1 2.2 465,000 44 97.8 599,000 Jul-10 45 650,000 89 2 4.4 696,950 43 95.6 650,000 Jun-10 56 697,000 79 1 1.8 999,000 55 98.2 695,000 May-10 59 595,000 74 1 1.7 279,900 58 98.3 607,000 Apr-10 70 487,000 59 1 1.4 359,900 69 98.6 489,000 Mar-10 48 549,900 70 1 2.1 500,000 47 97.9 549,900 Feb-10 41 550,000 86 1 2.4 124,900 40 97.6 562,500 Jan-10 29 599,900 83 1 3.5 849,900 28 96.5 574,950 Dec-09 31 492,000 98 2 6.5 330,350 29 93.5 575,000 Nov-09 25 469,000 129 3 12.0 812,200 22 88.0 454,425 Oct-09 41 592,500 98 0 41 100.0 592,500 Sep-09 46 521,750 93 2 4.3 458,125 44 95.7 521,750 Aug-09 49 499,900 89 1 2.0 425,000 48 98.0 509,950 Jul-09 53 524,900 84 3 5.7 324,900 50 94.3 534,950 Jun-09 45 595,000 107 1 2.2 790,000 44 97.8 592,450 May-09 39 525,000 71 0 39 100.0 525,000 Apr-09 53 540,000 72 0 53 100.0 540,000 Mar-09 41 599,900 85 3 7.3 549,900 38 92.7 599,950 Feb-09 20 492,450 111 1 5.0 1,675,000 19 95.0 489,900 Jan-09 30 534,725 106 0 30 100.0 534,725 Dec-08 17 518,960 100 0 17 100.0 518,960 Clarus MarketMetrics® 2 of 2 01/18/2011 Information not guaranteed. © 2009-2010 Terradatum and its suppliers and licensors (www.terradatum.com/about/licensors.td). www.TaylorRealEstateAustin.com | www.EarlyBirdAustin.com | Direct: 512.796.4447 | Fax: 512.628.7720 | 1701 Spyglass Dr. Ste. 8 Austin, TX 78746 8 of 20
- 9. Blake Taylor Austin Board of REALTORS New Properties by Month Dec-08 vs. Dec-10: The number of New properties is down 28% Dec-08 vs. Dec-10 Dec-08 Dec-10 Change % 40 29 -11 -28% MLS: ACTRIS Period: 2 years (monthly) Price: All Construction Type: All Bedrooms: All Bathrooms: All Lot Size: All Property Types: Residential: (House, Condo, Townhouse, Manufactured, Half Duplex, Mobile Home, Loft, Residential - Unknown) Sq Ft: All MLS Areas: 8E, 8W Clarus MarketMetrics® 1 of 2 01/18/2011 Information not guaranteed. © 2009-2010 Terradatum and its suppliers and licensors (www.terradatum.com/about/licensors.td). www.TaylorRealEstateAustin.com | www.EarlyBirdAustin.com | Direct: 512.796.4447 | Fax: 512.628.7720 | 1701 Spyglass Dr. Ste. 8 Austin, TX 78746 9 of 20
- 10. Blake Taylor Austin Board of REALTORS New Properties by Month Dec-08 vs. Dec-10: The number of New properties is down 28% Full Market Bank Properties Non-Bank Properties Time Period # Properties Median Price # Properties % Bank Median Price # Properties % Non-Bank Median Price Dec-10 29 564,900 2 6.9 582,950 27 93.1 564,900 Nov-10 48 559,250 1 2.1 299,900 47 97.9 559,500 Oct-10 54 697,500 0 54 100.0 697,500 Sep-10 62 699,450 2 3.2 324,200 60 96.8 714,950 Aug-10 59 650,000 3 5.1 377,000 56 94.9 721,500 Jul-10 91 630,000 2 2.2 696,950 89 97.8 630,000 Jun-10 114 639,950 2 1.8 842,888 112 98.2 639,950 May-10 110 806,950 2 1.8 413,200 108 98.2 814,450 Apr-10 138 649,450 3 2.2 866,900 135 97.8 639,900 Mar-10 126 684,000 4 3.2 389,900 122 96.8 699,000 Feb-10 85 699,000 2 2.4 848,000 83 97.7 699,000 Jan-10 67 695,500 3 4.5 500,000 64 95.5 695,700 Dec-09 30 644,950 2 6.7 564,900 28 93.3 644,950 Nov-09 51 630,000 2 3.9 330,350 49 96.1 635,000 Oct-09 66 757,450 0 66 100.0 757,450 Sep-09 59 729,000 0 59 100.0 729,000 Aug-09 98 644,000 4 4.1 715,475 94 95.9 644,000 Jul-09 93 679,000 2 2.1 1,419,500 91 97.8 671,000 Jun-09 104 599,000 5 4.8 425,000 99 95.2 625,000 May-09 107 625,000 0 107 100.0 625,000 Apr-09 113 659,000 1 0.9 499,000 112 99.1 659,450 Mar-09 121 699,500 4 3.3 874,950 117 96.7 699,000 Feb-09 86 649,450 4 4.7 437,400 82 95.3 654,450 Jan-09 71 699,500 1 1.4 999,900 70 98.6 699,250 Dec-08 40 587,000 2 5.0 420,450 38 95.0 589,450 Clarus MarketMetrics® 2 of 2 01/18/2011 Information not guaranteed. © 2009-2010 Terradatum and its suppliers and licensors (www.terradatum.com/about/licensors.td). www.TaylorRealEstateAustin.com | www.EarlyBirdAustin.com | Direct: 512.796.4447 | Fax: 512.628.7720 | 1701 Spyglass Dr. Ste. 8 Austin, TX 78746 10 of 20
- 11. Blake Taylor Austin Board of REALTORS For Sale Properties by Month Dec-08 vs. Dec-10: The number of For Sale properties is down 13% Dec-08 vs. Dec-10 Dec-08 Dec-10 Change % 360 313 -47 -13% MLS: ACTRIS Period: 2 years (monthly) Price: All Construction Type: All Bedrooms: All Bathrooms: All Lot Size: All Property Types: Residential: (House, Condo, Townhouse, Manufactured, Half Duplex, Mobile Home, Loft, Residential - Unknown) Sq Ft: All MLS Areas: 8E, 8W Clarus MarketMetrics® 1 of 2 01/18/2011 Information not guaranteed. © 2009-2010 Terradatum and its suppliers and licensors (www.terradatum.com/about/licensors.td). www.TaylorRealEstateAustin.com | www.EarlyBirdAustin.com | Direct: 512.796.4447 | Fax: 512.628.7720 | 1701 Spyglass Dr. Ste. 8 Austin, TX 78746 11 of 20
- 12. Blake Taylor Austin Board of REALTORS For Sale Properties by Month Dec-08 vs. Dec-10: The number of For Sale properties is down 13% Full Market Bank Properties Non-Bank Properties Time Period # Properties Median Price Average DOM # Properties % Bank Median Price # Properties % Non-Bank Median Price Dec-10 313 849,900 170 9 2.9 426,400 304 97.1 868,550 Nov-10 375 799,999 170 8 2.1 423,150 367 97.9 829,900 Oct-10 412 799,500 174 9 2.2 426,400 403 97.8 799,900 Sep-10 430 799,000 181 12 2.8 423,150 418 97.2 799,000 Aug-10 469 799,000 179 12 2.6 445,700 457 97.4 799,000 Jul-10 502 799,000 178 11 2.2 609,000 491 97.8 799,000 Jun-10 506 799,500 178 11 2.2 509,777 495 97.8 799,900 May-10 481 799,900 181 10 2.1 445,700 471 97.9 814,000 Apr-10 476 742,000 179 9 1.9 465,000 467 98.1 750,000 Mar-10 415 719,000 191 10 2.4 442,450 405 97.6 725,000 Feb-10 352 744,836 209 7 2.0 500,000 345 98.0 749,000 Jan-10 321 785,000 226 6 1.9 674,950 315 98.1 785,000 Dec-09 331 750,000 228 6 1.8 604,950 325 98.2 750,000 Nov-09 400 789,000 217 8 2.0 623,600 392 98.0 789,000 Oct-09 441 799,000 210 6 1.4 875,600 435 98.6 799,000 Sep-09 480 791,500 204 8 1.7 715,475 472 98.3 791,500 Aug-09 533 749,000 198 11 2.1 812,200 522 97.9 749,000 Jul-09 542 739,450 198 12 2.2 430,000 530 97.8 742,500 Jun-09 536 730,450 200 13 2.4 425,000 523 97.6 739,900 May-09 510 732,450 201 9 1.8 469,000 501 98.2 735,900 Apr-09 488 739,950 200 9 1.8 469,000 479 98.2 745,000 Mar-09 441 715,000 208 12 2.7 509,450 429 97.3 723,900 Feb-09 370 699,900 226 12 3.2 549,900 358 96.8 707,450 Jan-09 352 699,950 225 8 2.3 669,950 344 97.7 699,950 Dec-08 360 699,250 231 9 2.5 549,900 351 97.5 699,500 Clarus MarketMetrics® 2 of 2 01/18/2011 Information not guaranteed. © 2009-2010 Terradatum and its suppliers and licensors (www.terradatum.com/about/licensors.td). www.TaylorRealEstateAustin.com | www.EarlyBirdAustin.com | Direct: 512.796.4447 | Fax: 512.628.7720 | 1701 Spyglass Dr. Ste. 8 Austin, TX 78746 12 of 20
- 13. Blake Taylor Austin Board of REALTORS Expired Properties by Month Dec-08 vs. Dec-10: The number of Expired properties is up 3% Dec-08 vs. Dec-10 Dec-08 Dec-10 Change % 62 64 2 +3% MLS: ACTRIS Period: 2 years (monthly) Price: All Construction Type: All Bedrooms: All Bathrooms: All Lot Size: All Property Types: Residential: (House, Condo, Townhouse, Manufactured, Half Duplex, Mobile Home, Loft, Residential - Unknown) Sq Ft: All MLS Areas: 8E, 8W Clarus MarketMetrics® 1 of 2 01/18/2011 Information not guaranteed. © 2009-2010 Terradatum and its suppliers and licensors (www.terradatum.com/about/licensors.td). www.TaylorRealEstateAustin.com | www.EarlyBirdAustin.com | Direct: 512.796.4447 | Fax: 512.628.7720 | 1701 Spyglass Dr. Ste. 8 Austin, TX 78746 13 of 20
- 14. Blake Taylor Austin Board of REALTORS Expired Properties by Month Dec-08 vs. Dec-10: The number of Expired properties is up 3% Full Market Bank Properties Non-Bank Properties Time Period # Properties Median Price Average DOM # Properties % Bank Median Price # Properties % Non-Bank Median Price Dec-10 64 880,900 188 2 3.1 547,700 62 96.9 896,950 Nov-10 61 725,000 148 0 61 100.0 725,000 Oct-10 47 799,000 146 0 47 100.0 799,000 Sep-10 53 775,000 142 2 3.8 464,838 51 96.2 799,000 Aug-10 56 806,950 142 1 1.8 377,000 55 98.2 814,000 Jul-10 47 799,000 145 0 47 100.0 799,000 Jun-10 39 649,900 114 1 2.6 339,000 38 97.4 687,450 May-10 30 872,998 166 0 30 100.0 872,998 Apr-10 35 639,900 198 0 35 100.0 639,900 Mar-10 29 775,000 173 3 10.3 1,357,000 26 89.7 737,450 Feb-10 22 767,500 161 0 22 100.0 767,500 Jan-10 25 1,150,000 212 0 25 100.0 1,150,000 Dec-09 46 749,450 164 1 2.2 939,000 45 97.8 749,000 Nov-09 74 899,700 160 1 1.4 399,999 73 98.7 899,900 Oct-09 51 874,500 162 0 51 100.0 874,500 Sep-09 59 899,900 150 0 59 100.0 899,900 Aug-09 63 659,000 161 2 3.2 869,450 61 96.8 659,000 Jul-09 54 663,000 170 2 3.7 329,950 52 96.3 673,000 Jun-09 42 669,750 141 2 4.8 557,450 40 95.2 669,750 May-09 39 569,900 126 1 2.6 469,000 38 97.4 572,450 Apr-09 32 1,050,000 169 0 32 100.0 1,050,000 Mar-09 25 599,900 123 1 4.0 999,000 24 96.0 599,450 Feb-09 30 974,950 166 3 10.0 999,900 27 90.0 950,000 Jan-09 38 781,500 156 0 38 100.0 781,500 Dec-08 62 729,750 185 2 3.2 717,500 60 96.8 729,750 Clarus MarketMetrics® 2 of 2 01/18/2011 Information not guaranteed. © 2009-2010 Terradatum and its suppliers and licensors (www.terradatum.com/about/licensors.td). www.TaylorRealEstateAustin.com | www.EarlyBirdAustin.com | Direct: 512.796.4447 | Fax: 512.628.7720 | 1701 Spyglass Dr. Ste. 8 Austin, TX 78746 14 of 20
- 15. Blake Taylor Austin Board of REALTORS Supply & Demand by Month Dec-08 vs. Dec-10: The number of for sale properties is down 13% and the number of sold properties is up 27% Dec-08 vs. Dec-10 Dec-08 vs. Dec-10 Dec-08 Dec-10 Change % Dec-08 Dec-10 Change % 360 313 -47 -13% 30 38 8 +27% MLS: ACTRIS Period: 2 years (monthly) Price: All Construction Type: All Bedrooms: All Bathrooms: All Lot Size: All Property Types: Residential: (House, Condo, Townhouse, Manufactured, Half Duplex, Mobile Home, Loft, Residential - Unknown) Sq Ft: All MLS Areas: 8E, 8W Clarus MarketMetrics® 1 of 2 01/18/2011 Information not guaranteed. © 2009-2010 Terradatum and its suppliers and licensors (www.terradatum.com/about/licensors.td). www.TaylorRealEstateAustin.com | www.EarlyBirdAustin.com | Direct: 512.796.4447 | Fax: 512.628.7720 | 1701 Spyglass Dr. Ste. 8 Austin, TX 78746 15 of 20
- 16. Blake Taylor Austin Board of REALTORS Supply & Demand by Month Dec-08 vs. Dec-10: The number of for sale properties is down 13% and the number of sold properties is up 27% # Properties Average DOM # Properties Average DOM Time Period For Sale For Sale Sold Sold Dec-10 313 170 38 105 Nov-10 375 170 35 99 Oct-10 412 174 23 80 Sep-10 430 181 29 73 Aug-10 469 179 49 89 Jul-10 502 178 59 68 Jun-10 506 178 76 79 May-10 481 181 56 64 Apr-10 476 179 49 86 Mar-10 415 191 37 73 Feb-10 352 209 34 86 Jan-10 321 226 28 82 Dec-09 331 228 34 104 Nov-09 400 217 32 93 Oct-09 441 210 45 105 Sep-09 480 204 45 85 Aug-09 533 198 52 91 Jul-09 542 198 47 88 Jun-09 536 200 47 89 May-09 510 201 53 71 Apr-09 488 200 28 90 Mar-09 441 208 26 92 Feb-09 370 226 24 115 Jan-09 352 225 16 105 Dec-08 360 231 30 80 Clarus MarketMetrics® 2 of 2 01/18/2011 Information not guaranteed. © 2009-2010 Terradatum and its suppliers and licensors (www.terradatum.com/about/licensors.td). www.TaylorRealEstateAustin.com | www.EarlyBirdAustin.com | Direct: 512.796.4447 | Fax: 512.628.7720 | 1701 Spyglass Dr. Ste. 8 Austin, TX 78746 16 of 20
- 17. Blake Taylor Austin Board of REALTORS The Average Days on Market by Month Dec-08 vs. Dec-10: The average days on market is up 21% Dec-08 vs. Dec-10 Dec-08 Dec-10 Change % 100 121 21 +21% MLS: ACTRIS Period: 2 years (monthly) Price: All Construction Type: All Bedrooms: All Bathrooms: All Lot Size: All Property Types: Residential: (House, Condo, Townhouse, Manufactured, Half Duplex, Mobile Home, Loft, Residential - Unknown) Sq Ft: All MLS Areas: 8E, 8W Clarus MarketMetrics® 1 of 2 01/18/2011 Information not guaranteed. © 2009-2010 Terradatum and its suppliers and licensors (www.terradatum.com/about/licensors.td). www.TaylorRealEstateAustin.com | www.EarlyBirdAustin.com | Direct: 512.796.4447 | Fax: 512.628.7720 | 1701 Spyglass Dr. Ste. 8 Austin, TX 78746 17 of 20
- 18. Blake Taylor Austin Board of REALTORS The Average Days on Market by Month Dec-08 vs. Dec-10: The average days on market is up 21% Time Period Average DOM # UC Units Dec-10 121 28 Nov-10 80 30 Oct-10 86 38 Sep-10 115 19 Aug-10 71 45 Jul-10 89 45 Jun-10 79 56 May-10 74 59 Apr-10 59 70 Mar-10 70 48 Feb-10 86 41 Jan-10 83 29 Dec-09 98 31 Nov-09 129 25 Oct-09 98 41 Sep-09 93 46 Aug-09 89 49 Jul-09 84 53 Jun-09 107 45 May-09 71 39 Apr-09 72 53 Mar-09 85 41 Feb-09 111 20 Jan-09 106 30 Dec-08 100 17 Clarus MarketMetrics® 2 of 2 01/18/2011 Information not guaranteed. © 2009-2010 Terradatum and its suppliers and licensors (www.terradatum.com/about/licensors.td). www.TaylorRealEstateAustin.com | www.EarlyBirdAustin.com | Direct: 512.796.4447 | Fax: 512.628.7720 | 1701 Spyglass Dr. Ste. 8 Austin, TX 78746 18 of 20
- 19. Blake Taylor Austin Board of REALTORS Months Supply of Inventory Dec-08 vs. Dec-10: The average months supply of inventory is down 52% Dec-08 vs. Dec-10 Dec-08 Dec-10 Change % 16.5 7.9 -8.6 -52% MLS: ACTRIS Period: 2 years (monthly) Price: All Construction Type: All Bedrooms: All Bathrooms: All Lot Size: All Property Types: Residential: (House, Condo, Townhouse, Manufactured, Half Duplex, Mobile Home, Loft, Residential - Unknown) Sq Ft: All MLS Areas: 8E, 8W Clarus MarketMetrics® 1 of 2 01/18/2011 Information not guaranteed. © 2009-2010 Terradatum and its suppliers and licensors (www.terradatum.com/about/licensors.td). www.TaylorRealEstateAustin.com | www.EarlyBirdAustin.com | Direct: 512.796.4447 | Fax: 512.628.7720 | 1701 Spyglass Dr. Ste. 8 Austin, TX 78746 19 of 20
- 20. Blake Taylor Austin Board of REALTORS Months Supply of Inventory Dec-08 vs. Dec-10: The average months supply of inventory is down 52% # Units For Sale # UC Units UC Average Time Period Last Day of Month During Month MSI DOM Dec-10 221 28 7.9 121 Nov-10 284 30 9.5 80 Oct-10 327 38 8.6 86 Sep-10 358 19 18.8 115 Aug-10 368 45 8.2 71 Jul-10 410 45 9.1 89 Jun-10 411 56 7.3 79 May-10 392 59 6.6 74 Apr-10 371 70 5.3 59 Mar-10 338 48 7.0 70 Feb-10 289 41 7.0 86 Jan-10 267 29 9.2 83 Dec-09 254 31 8.2 98 Nov-09 301 25 12.0 129 Oct-09 349 41 8.5 98 Sep-09 375 46 8.2 93 Aug-09 421 49 8.6 89 Jul-09 435 53 8.2 84 Jun-09 449 45 10.0 107 May-09 432 39 11.1 71 Apr-09 403 53 7.6 72 Mar-09 375 41 9.1 85 Feb-09 320 20 16.0 111 Jan-09 284 30 9.5 106 Dec-08 281 17 16.5 100 Clarus MarketMetrics® 2 of 2 01/18/2011 Information not guaranteed. © 2009-2010 Terradatum and its suppliers and licensors (www.terradatum.com/about/licensors.td). www.TaylorRealEstateAustin.com | www.EarlyBirdAustin.com | Direct: 512.796.4447 | Fax: 512.628.7720 | 1701 Spyglass Dr. Ste. 8 Austin, TX 78746 20 of 20