Median Home Price Up 14
•
0 gefällt mir•201 views

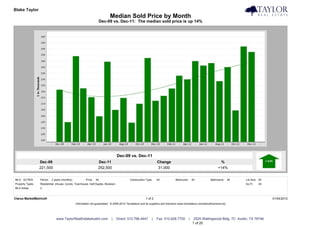
- The median sold price of homes in December 2011 was up 14% from December 2009, rising from $221,500 to $252,500. - The median price of for-sale properties was up 8% over the same period, while the median price of sold properties rose 14%. - The number of homes sold declined 10% from December 2009 to December 2011, falling from 29 homes to 26 homes. - The number of properties under contract rose 58% between December 2009 and December 2011, increasing from 12 properties to 19 properties.

Empfohlen
Weitere ähnliche Inhalte
Was ist angesagt?
Was ist angesagt? (20)
Ähnlich wie Median Home Price Up 14
Ähnlich wie Median Home Price Up 14 (12)
Median Home Price Up 14
- 1. Blake Taylor Taylor Real Estate Median Sold Price by Month Dec-09 vs. Dec-11: The median sold price is up 14% Dec-09 vs. Dec-11 Dec-09 Dec-11 Change % 221,500 252,500 31,000 +14% MLS: ACTRIS Period: 2 years (monthly) Price: All Construction Type: All Bedrooms: All Bathrooms: All Lot Size: All Property Types: Residential: (House, Condo, Townhouse, Half Duplex, Modular) Sq Ft: All MLS Areas: 2 Clarus MarketMetrics® 1 of 2 01/04/2012 Information not guaranteed. © 2009-2010 Terradatum and its suppliers and licensors (www.terradatum.com/about/licensors.td). www.TaylorRealEstateAustin.com | Direct: 512.796.4447 | Fax: 512.628.7720 | 2525 Wallingwood Bldg. 7C Austin, TX 78746 1 of 20
- 2. Blake Taylor Taylor Real Estate Median Sold Price by Month Dec-09 vs. Dec-11: The median sold price is up 14% Time Period Median Price # Units Average DOM Dec-11 252,500 26 70 Nov-11 256,950 20 42 Oct-11 204,500 26 60 Sep-11 240,000 32 44 Aug-11 228,500 46 72 Jul-11 243,325 42 42 Jun-11 241,336 56 70 May-11 245,000 34 64 Apr-11 230,000 47 57 Mar-11 233,000 29 104 Feb-11 222,500 28 92 Jan-11 216,500 31 61 Dec-10 212,450 22 60 Nov-10 247,500 22 60 Oct-10 210,000 21 88 Sep-10 194,500 26 61 Aug-10 214,750 40 64 Jul-10 205,000 27 71 Jun-10 244,500 30 49 May-10 199,750 38 66 Apr-10 215,335 60 64 Mar-10 222,650 28 56 Feb-10 249,000 15 77 Jan-10 195,000 13 129 Dec-09 221,500 29 53 Clarus MarketMetrics® 2 of 2 01/04/2012 Information not guaranteed. © 2009-2010 Terradatum and its suppliers and licensors (www.terradatum.com/about/licensors.td). www.TaylorRealEstateAustin.com | Direct: 512.796.4447 | Fax: 512.628.7720 | 2525 Wallingwood Bldg. 7C Austin, TX 78746 2 of 20
- 3. Blake Taylor Taylor Real Estate Median For Sale vs. Median Sold Dec-09 vs. Dec-11: The median price of for sale properties is up 8% and the median price of sold properties is up 14% Dec-09 vs. Dec-11 Dec-09 vs. Dec-11 Dec-09 Dec-11 Change % Dec-09 Dec-11 Change % 209,000 225,250 16,250 +8% 221,500 252,500 31,000 +14% MLS: ACTRIS Period: 2 years (monthly) Price: All Construction Type: All Bedrooms: All Bathrooms: All Lot Size: All Property Types: Residential: (House, Condo, Townhouse, Half Duplex, Modular) Sq Ft: All MLS Areas: 2 Clarus MarketMetrics® 1 of 2 01/04/2012 Information not guaranteed. © 2009-2010 Terradatum and its suppliers and licensors (www.terradatum.com/about/licensors.td). www.TaylorRealEstateAustin.com | Direct: 512.796.4447 | Fax: 512.628.7720 | 2525 Wallingwood Bldg. 7C Austin, TX 78746 3 of 20
- 4. Blake Taylor Taylor Real Estate Median For Sale vs. Median Sold Dec-09 vs. Dec-11: The median price of for sale properties is up 8% and the median price of sold properties is up 14% For Sale # Properties Sold # Properties Price Time Period Median For Sale Median Sold Difference Dec-11 225,250 166 252,500 26 27,250 Nov-11 225,500 169 256,950 20 31,450 Oct-11 231,950 186 204,500 26 -27,450 Sep-11 229,000 188 240,000 32 11,000 Aug-11 225,000 196 228,500 46 3,500 Jul-11 225,000 195 243,325 42 18,325 Jun-11 226,800 200 241,336 56 14,536 May-11 219,900 199 245,000 34 25,100 Apr-11 219,945 208 230,000 47 10,055 Mar-11 225,000 215 233,000 29 8,000 Feb-11 209,000 201 222,500 28 13,500 Jan-11 205,000 193 216,500 31 11,500 Dec-10 209,500 210 212,450 22 2,950 Nov-10 205,000 243 247,500 22 42,500 Oct-10 204,950 272 210,000 21 5,050 Sep-10 209,250 280 194,500 26 -14,750 Aug-10 219,900 300 214,750 40 -5,150 Jul-10 219,000 302 205,000 27 -14,000 Jun-10 218,000 296 244,500 30 26,500 May-10 214,500 266 199,750 38 -14,750 Apr-10 212,250 276 215,335 60 3,085 Mar-10 210,000 260 222,650 28 12,650 Feb-10 209,900 209 249,000 15 39,100 Jan-10 204,250 184 195,000 13 -9,250 Dec-09 209,000 172 221,500 29 12,500 Clarus MarketMetrics® 2 of 2 01/04/2012 Information not guaranteed. © 2009-2010 Terradatum and its suppliers and licensors (www.terradatum.com/about/licensors.td). www.TaylorRealEstateAustin.com | Direct: 512.796.4447 | Fax: 512.628.7720 | 2525 Wallingwood Bldg. 7C Austin, TX 78746 4 of 20
- 5. Blake Taylor Taylor Real Estate Sold Properties by Month Dec-09 vs. Dec-11: The number of Sold properties is down 10% Dec-09 vs. Dec-11 Dec-09 Dec-11 Change % 29 26 -3 -10% MLS: ACTRIS Period: 2 years (monthly) Price: All Construction Type: All Bedrooms: All Bathrooms: All Lot Size: All Property Types: Residential: (House, Condo, Townhouse, Half Duplex, Modular) Sq Ft: All MLS Areas: 2 Clarus MarketMetrics® 1 of 2 01/04/2012 Information not guaranteed. © 2009-2010 Terradatum and its suppliers and licensors (www.terradatum.com/about/licensors.td). www.TaylorRealEstateAustin.com | Direct: 512.796.4447 | Fax: 512.628.7720 | 2525 Wallingwood Bldg. 7C Austin, TX 78746 5 of 20
- 6. Blake Taylor Taylor Real Estate Sold Properties by Month Dec-09 vs. Dec-11: The number of Sold properties is down 10% Full Market Bank Properties Non-Bank Properties Time Period # Properties Median Price Average DOM # Properties % Bank Median Price # Properties % Non-Bank Median Price Dec-11 26 252,500 70 1 3.9 185,000 25 96.2 265,000 Nov-11 20 256,950 42 0 20 100.0 256,950 Oct-11 26 204,500 60 0 26 100.0 204,500 Sep-11 32 240,000 44 0 32 100.0 240,000 Aug-11 46 228,500 72 1 2.2 154,000 45 97.8 230,000 Jul-11 42 243,325 42 2 4.8 145,070 40 95.2 244,575 Jun-11 56 241,336 70 3 5.4 117,699 53 94.6 243,900 May-11 34 245,000 64 1 2.9 225,000 33 97.1 245,000 Apr-11 47 230,000 57 5 10.6 154,000 42 89.4 254,000 Mar-11 29 233,000 104 3 10.3 275,000 26 89.7 230,475 Feb-11 28 222,500 92 1 3.6 111,000 27 96.4 225,000 Jan-11 31 216,500 61 4 12.9 175,500 27 87.1 216,500 Dec-10 22 212,450 60 0 22 100.0 212,450 Nov-10 22 247,500 60 1 4.5 60,000 21 95.5 249,000 Oct-10 21 210,000 88 0 21 100.0 210,000 Sep-10 26 194,500 61 0 26 100.0 194,500 Aug-10 40 214,750 64 1 2.5 69,900 39 97.5 220,000 Jul-10 27 205,000 71 1 3.7 50,852 26 96.3 207,500 Jun-10 30 244,500 49 1 3.3 52,500 29 96.7 250,000 May-10 38 199,750 66 1 2.6 75,000 37 97.4 200,000 Apr-10 60 215,335 64 1 1.7 225,000 59 98.3 215,000 Mar-10 28 222,650 56 0 28 100.0 222,650 Feb-10 15 249,000 77 0 15 100.0 249,000 Jan-10 13 195,000 129 0 13 100.0 195,000 Dec-09 29 221,500 53 2 6.9 62,800 27 93.1 230,865 Clarus MarketMetrics® 2 of 2 01/04/2012 Information not guaranteed. © 2009-2010 Terradatum and its suppliers and licensors (www.terradatum.com/about/licensors.td). www.TaylorRealEstateAustin.com | Direct: 512.796.4447 | Fax: 512.628.7720 | 2525 Wallingwood Bldg. 7C Austin, TX 78746 6 of 20
- 7. Blake Taylor Taylor Real Estate Under Contract Properties by Month Dec-09 vs. Dec-11: The number of Under Contract properties is up 58% Dec-09 vs. Dec-11 Dec-09 Dec-11 Change % 12 19 7 +58% MLS: ACTRIS Period: 2 years (monthly) Price: All Construction Type: All Bedrooms: All Bathrooms: All Lot Size: All Property Types: Residential: (House, Condo, Townhouse, Half Duplex, Modular) Sq Ft: All MLS Areas: 2 Clarus MarketMetrics® 1 of 2 01/04/2012 Information not guaranteed. © 2009-2010 Terradatum and its suppliers and licensors (www.terradatum.com/about/licensors.td). www.TaylorRealEstateAustin.com | Direct: 512.796.4447 | Fax: 512.628.7720 | 2525 Wallingwood Bldg. 7C Austin, TX 78746 7 of 20
- 8. Blake Taylor Taylor Real Estate Under Contract Properties by Month Dec-09 vs. Dec-11: The number of Under Contract properties is up 58% Full Market Bank Properties Non-Bank Properties Time Period # Properties Median Price Average DOM # Properties % Bank Median Price # Properties % Non-Bank Median Price Dec-11 19 219,000 87 1 5.3 199,900 18 94.7 220,950 Nov-11 19 275,000 50 0 19 100.0 275,000 Oct-11 30 271,263 66 0 30 100.0 271,263 Sep-11 28 206,450 38 0 28 100.0 206,450 Aug-11 33 244,900 54 0 33 100.0 244,900 Jul-11 39 245,000 46 0 39 100.0 245,000 Jun-11 47 259,000 70 1 2.1 159,900 46 97.9 261,950 May-11 52 247,400 66 3 5.8 119,000 49 94.2 249,995 Apr-11 33 257,000 57 1 3.0 129,900 32 97.0 258,000 Mar-11 46 235,945 53 3 6.5 225,000 43 93.5 239,890 Feb-11 33 209,000 90 7 21.2 154,900 26 78.8 224,950 Jan-11 24 239,900 106 2 8.3 105,500 22 91.7 244,400 Dec-10 27 229,900 82 1 3.7 319,900 26 96.3 229,900 Nov-10 28 236,950 59 2 7.1 147,400 26 92.9 239,400 Oct-10 20 236,500 48 1 5.0 134,900 19 95.0 239,000 Sep-10 26 217,450 88 0 26 100.0 217,450 Aug-10 27 239,900 60 0 27 100.0 239,900 Jul-10 37 235,000 63 1 2.7 69,900 36 97.3 237,000 Jun-10 27 239,000 77 0 27 100.0 239,000 May-10 25 210,000 44 2 8.0 55,100 23 92.0 215,000 Apr-10 44 237,000 62 1 2.3 84,900 43 97.7 239,000 Mar-10 57 220,000 57 1 1.8 229,900 56 98.2 219,495 Feb-10 26 223,450 77 0 26 100.0 223,450 Jan-10 21 185,000 112 0 21 100.0 185,000 Dec-09 12 222,445 42 0 12 100.0 222,445 Clarus MarketMetrics® 2 of 2 01/04/2012 Information not guaranteed. © 2009-2010 Terradatum and its suppliers and licensors (www.terradatum.com/about/licensors.td). www.TaylorRealEstateAustin.com | Direct: 512.796.4447 | Fax: 512.628.7720 | 2525 Wallingwood Bldg. 7C Austin, TX 78746 8 of 20
- 9. Blake Taylor Taylor Real Estate New Properties by Month Dec-09 vs. Dec-11: The number of New properties is up 50% Dec-09 vs. Dec-11 Dec-09 Dec-11 Change % 24 36 12 +50% MLS: ACTRIS Period: 2 years (monthly) Price: All Construction Type: All Bedrooms: All Bathrooms: All Lot Size: All Property Types: Residential: (House, Condo, Townhouse, Half Duplex, Modular) Sq Ft: All MLS Areas: 2 Clarus MarketMetrics® 1 of 2 01/04/2012 Information not guaranteed. © 2009-2010 Terradatum and its suppliers and licensors (www.terradatum.com/about/licensors.td). www.TaylorRealEstateAustin.com | Direct: 512.796.4447 | Fax: 512.628.7720 | 2525 Wallingwood Bldg. 7C Austin, TX 78746 9 of 20
- 10. Blake Taylor Taylor Real Estate New Properties by Month Dec-09 vs. Dec-11: The number of New properties is up 50% Full Market Bank Properties Non-Bank Properties Time Period # Properties Median Price # Properties % Bank Median Price # Properties % Non-Bank Median Price Dec-11 36 239,950 3 8.3 99,900 33 91.7 250,000 Nov-11 28 239,900 0 28 100.0 239,900 Oct-11 42 222,750 2 4.8 161,750 40 95.2 224,950 Sep-11 46 254,900 0 46 100.0 254,900 Aug-11 58 239,450 2 3.5 167,750 56 96.5 239,950 Jul-11 59 222,500 5 8.5 190,000 54 91.5 239,900 Jun-11 65 255,000 0 65 100.0 255,000 May-11 44 258,750 1 2.3 117,500 43 97.7 259,000 Apr-11 58 222,495 1 1.7 168,900 57 98.3 225,000 Mar-11 70 249,950 4 5.7 154,950 66 94.3 254,450 Feb-11 50 241,200 3 6.0 119,000 47 94.0 259,000 Jan-11 40 209,975 3 7.5 165,000 37 92.5 220,000 Dec-10 27 239,900 2 7.4 185,750 25 92.6 239,900 Nov-10 35 239,900 1 2.9 109,900 34 97.1 244,450 Oct-10 53 219,900 3 5.7 134,900 50 94.3 223,450 Sep-10 58 207,500 2 3.5 160,450 56 96.5 212,450 Aug-10 58 222,450 2 3.5 144,945 56 96.5 224,950 Jul-10 67 219,000 5 7.5 159,900 62 92.5 219,900 Jun-10 78 225,000 0 78 100.0 225,000 May-10 50 219,450 2 4.0 197,450 48 96.0 219,450 Apr-10 97 229,900 2 2.1 184,900 95 97.9 229,900 Mar-10 92 232,200 2 2.2 145,100 90 97.8 234,750 Feb-10 61 215,000 0 61 100.0 215,000 Jan-10 54 189,450 1 1.9 110,000 53 98.2 189,900 Dec-09 24 199,900 2 8.3 84,900 22 91.7 202,450 Clarus MarketMetrics® 2 of 2 01/04/2012 Information not guaranteed. © 2009-2010 Terradatum and its suppliers and licensors (www.terradatum.com/about/licensors.td). www.TaylorRealEstateAustin.com | Direct: 512.796.4447 | Fax: 512.628.7720 | 2525 Wallingwood Bldg. 7C Austin, TX 78746 10 of 20
- 11. Blake Taylor Taylor Real Estate For Sale Properties by Month Dec-09 vs. Dec-11: The number of For Sale properties is down 3% Dec-09 vs. Dec-11 Dec-09 Dec-11 Change % 172 166 -6 -3% MLS: ACTRIS Period: 2 years (monthly) Price: All Construction Type: All Bedrooms: All Bathrooms: All Lot Size: All Property Types: Residential: (House, Condo, Townhouse, Half Duplex, Modular) Sq Ft: All MLS Areas: 2 Clarus MarketMetrics® 1 of 2 01/04/2012 Information not guaranteed. © 2009-2010 Terradatum and its suppliers and licensors (www.terradatum.com/about/licensors.td). www.TaylorRealEstateAustin.com | Direct: 512.796.4447 | Fax: 512.628.7720 | 2525 Wallingwood Bldg. 7C Austin, TX 78746 11 of 20
- 12. Blake Taylor Taylor Real Estate For Sale Properties by Month Dec-09 vs. Dec-11: The number of For Sale properties is down 3% Full Market Bank Properties Non-Bank Properties Time Period # Properties Median Price Average DOM # Properties % Bank Median Price # Properties % Non-Bank Median Price Dec-11 166 225,250 111 13 7.8 185,000 153 92.2 239,900 Nov-11 169 225,500 107 12 7.1 187,500 157 92.9 239,000 Oct-11 186 231,950 97 12 6.5 187,500 174 93.5 239,950 Sep-11 188 229,000 95 11 5.8 185,000 177 94.2 239,000 Aug-11 196 225,000 93 11 5.6 185,000 185 94.4 234,000 Jul-11 195 225,000 93 10 5.1 177,500 185 94.9 229,900 Jun-11 200 226,800 100 6 3.0 164,950 194 97.0 229,950 May-11 199 219,900 108 9 4.5 164,900 190 95.5 225,000 Apr-11 208 219,945 103 9 4.3 164,900 199 95.7 225,000 Mar-11 215 225,000 106 11 5.1 164,900 204 94.9 229,925 Feb-11 201 209,000 119 15 7.5 159,900 186 92.5 214,925 Jan-11 193 205,000 130 14 7.2 162,450 179 92.8 210,000 Dec-10 210 209,500 129 12 5.7 162,950 198 94.3 212,450 Nov-10 243 205,000 112 13 5.3 159,900 230 94.7 210,000 Oct-10 272 204,950 106 13 4.8 159,900 259 95.2 205,000 Sep-10 280 209,250 101 10 3.6 162,950 270 96.4 209,975 Aug-10 300 219,900 101 9 3.0 169,990 291 97.0 220,000 Jul-10 302 219,000 91 8 2.6 174,950 294 97.3 219,450 Jun-10 296 218,000 88 3 1.0 319,900 293 99.0 217,000 May-10 266 214,500 86 6 2.3 77,400 260 97.7 214,700 Apr-10 276 212,250 75 6 2.2 84,900 270 97.8 214,700 Mar-10 260 210,000 82 5 1.9 84,900 255 98.1 210,000 Feb-10 209 209,900 96 4 1.9 97,450 205 98.1 210,000 Jan-10 184 204,250 110 4 2.2 97,450 180 97.8 204,750 Dec-09 172 209,000 122 3 1.7 84,900 169 98.3 210,000 Clarus MarketMetrics® 2 of 2 01/04/2012 Information not guaranteed. © 2009-2010 Terradatum and its suppliers and licensors (www.terradatum.com/about/licensors.td). www.TaylorRealEstateAustin.com | Direct: 512.796.4447 | Fax: 512.628.7720 | 2525 Wallingwood Bldg. 7C Austin, TX 78746 12 of 20
- 13. Blake Taylor Taylor Real Estate Expired Properties by Month Dec-09 vs. Dec-11: The number of Expired properties is down 13% Dec-09 vs. Dec-11 Dec-09 Dec-11 Change % 30 26 -4 -13% MLS: ACTRIS Period: 2 years (monthly) Price: All Construction Type: All Bedrooms: All Bathrooms: All Lot Size: All Property Types: Residential: (House, Condo, Townhouse, Half Duplex, Modular) Sq Ft: All MLS Areas: 2 Clarus MarketMetrics® 1 of 2 01/04/2012 Information not guaranteed. © 2009-2010 Terradatum and its suppliers and licensors (www.terradatum.com/about/licensors.td). www.TaylorRealEstateAustin.com | Direct: 512.796.4447 | Fax: 512.628.7720 | 2525 Wallingwood Bldg. 7C Austin, TX 78746 13 of 20
- 14. Blake Taylor Taylor Real Estate Expired Properties by Month Dec-09 vs. Dec-11: The number of Expired properties is down 13% Full Market Bank Properties Non-Bank Properties Time Period # Properties Median Price Average DOM # Properties % Bank Median Price # Properties % Non-Bank Median Price Dec-11 26 256,400 154 3 11.5 165,000 23 88.5 258,900 Nov-11 20 214,250 118 2 10.0 109,000 18 90.0 243,750 Oct-11 15 229,900 128 0 15 100.0 229,900 Sep-11 16 217,450 179 1 6.2 70,000 15 93.8 224,900 Aug-11 21 243,990 105 0 21 100.0 243,990 Jul-11 18 213,450 104 1 5.6 69,000 17 94.4 217,000 Jun-11 17 149,000 141 0 17 100.0 149,000 May-11 12 187,500 189 0 12 100.0 187,500 Apr-11 20 220,000 111 0 20 100.0 220,000 Mar-11 19 256,500 172 0 19 100.0 256,500 Feb-11 23 210,000 106 1 4.3 169,990 22 95.7 212,500 Jan-11 18 215,000 140 0 18 100.0 215,000 Dec-10 30 199,000 140 0 30 100.0 199,000 Nov-10 32 211,950 116 1 3.1 119,900 31 96.9 219,900 Oct-10 44 202,250 140 0 44 100.0 202,250 Sep-10 35 239,950 112 0 35 100.0 239,950 Aug-10 51 239,000 127 1 2.0 190,000 50 98.0 239,000 Jul-10 23 189,900 101 0 23 100.0 189,900 Jun-10 34 210,000 102 0 34 100.0 210,000 May-10 23 210,000 105 1 4.3 84,900 22 95.7 212,250 Apr-10 16 167,200 96 1 6.2 110,000 15 93.8 169,900 Mar-10 24 224,450 119 0 24 100.0 224,450 Feb-10 15 229,900 136 1 6.7 220,000 14 93.3 232,450 Jan-10 15 199,000 122 0 15 100.0 199,000 Dec-09 30 198,950 150 0 30 100.0 198,950 Clarus MarketMetrics® 2 of 2 01/04/2012 Information not guaranteed. © 2009-2010 Terradatum and its suppliers and licensors (www.terradatum.com/about/licensors.td). www.TaylorRealEstateAustin.com | Direct: 512.796.4447 | Fax: 512.628.7720 | 2525 Wallingwood Bldg. 7C Austin, TX 78746 14 of 20
- 15. Blake Taylor Taylor Real Estate Supply & Demand by Month Dec-09 vs. Dec-11: The number of for sale properties is down 3% and the number of sold properties is down 10% Dec-09 vs. Dec-11 Dec-09 vs. Dec-11 Dec-09 Dec-11 Change % Dec-09 Dec-11 Change % 172 166 -6 -3% 29 26 -3 -10% MLS: ACTRIS Period: 2 years (monthly) Price: All Construction Type: All Bedrooms: All Bathrooms: All Lot Size: All Property Types: Residential: (House, Condo, Townhouse, Half Duplex, Modular) Sq Ft: All MLS Areas: 2 Clarus MarketMetrics® 1 of 2 01/04/2012 Information not guaranteed. © 2009-2010 Terradatum and its suppliers and licensors (www.terradatum.com/about/licensors.td). www.TaylorRealEstateAustin.com | Direct: 512.796.4447 | Fax: 512.628.7720 | 2525 Wallingwood Bldg. 7C Austin, TX 78746 15 of 20
- 16. Blake Taylor Taylor Real Estate Supply & Demand by Month Dec-09 vs. Dec-11: The number of for sale properties is down 3% and the number of sold properties is down 10% # Properties Average DOM # Properties Average DOM Time Period For Sale For Sale Sold Sold Dec-11 166 111 26 70 Nov-11 169 107 20 42 Oct-11 186 97 26 60 Sep-11 188 95 32 44 Aug-11 196 93 46 72 Jul-11 195 93 42 42 Jun-11 200 100 56 70 May-11 199 108 34 64 Apr-11 208 103 47 57 Mar-11 215 106 29 104 Feb-11 201 119 28 92 Jan-11 193 130 31 61 Dec-10 210 129 22 60 Nov-10 243 112 22 60 Oct-10 272 106 21 88 Sep-10 280 101 26 61 Aug-10 300 101 40 64 Jul-10 302 91 27 71 Jun-10 296 88 30 49 May-10 266 86 38 66 Apr-10 276 75 60 64 Mar-10 260 82 28 56 Feb-10 209 96 15 77 Jan-10 184 110 13 129 Dec-09 172 122 29 53 Clarus MarketMetrics® 2 of 2 01/04/2012 Information not guaranteed. © 2009-2010 Terradatum and its suppliers and licensors (www.terradatum.com/about/licensors.td). www.TaylorRealEstateAustin.com | Direct: 512.796.4447 | Fax: 512.628.7720 | 2525 Wallingwood Bldg. 7C Austin, TX 78746 16 of 20
- 17. Blake Taylor Taylor Real Estate The Average Days on Market by Month Dec-09 vs. Dec-11: The average days on market is up 105% Dec-09 vs. Dec-11 Dec-09 Dec-11 Change % 42 87 45 +105% MLS: ACTRIS Period: 2 years (monthly) Price: All Construction Type: All Bedrooms: All Bathrooms: All Lot Size: All Property Types: Residential: (House, Condo, Townhouse, Half Duplex, Modular) Sq Ft: All MLS Areas: 2 Clarus MarketMetrics® 1 of 2 01/04/2012 Information not guaranteed. © 2009-2010 Terradatum and its suppliers and licensors (www.terradatum.com/about/licensors.td). www.TaylorRealEstateAustin.com | Direct: 512.796.4447 | Fax: 512.628.7720 | 2525 Wallingwood Bldg. 7C Austin, TX 78746 17 of 20
- 18. Blake Taylor Taylor Real Estate The Average Days on Market by Month Dec-09 vs. Dec-11: The average days on market is up 105% Time Period Average DOM # UC Units Dec-11 87 19 Nov-11 50 19 Oct-11 66 30 Sep-11 38 28 Aug-11 54 33 Jul-11 46 39 Jun-11 70 47 May-11 66 52 Apr-11 57 33 Mar-11 53 46 Feb-11 90 33 Jan-11 106 24 Dec-10 82 27 Nov-10 59 28 Oct-10 48 20 Sep-10 88 26 Aug-10 60 27 Jul-10 63 37 Jun-10 77 27 May-10 44 25 Apr-10 62 44 Mar-10 57 57 Feb-10 77 26 Jan-10 112 21 Dec-09 42 12 Clarus MarketMetrics® 2 of 2 01/04/2012 Information not guaranteed. © 2009-2010 Terradatum and its suppliers and licensors (www.terradatum.com/about/licensors.td). www.TaylorRealEstateAustin.com | Direct: 512.796.4447 | Fax: 512.628.7720 | 2525 Wallingwood Bldg. 7C Austin, TX 78746 18 of 20
- 19. Blake Taylor Taylor Real Estate Months Supply of Inventory Dec-09 vs. Dec-11: The average months supply of inventory is down 41% Dec-09 vs. Dec-11 Dec-09 Dec-11 Change % 10.8 6.4 -4.5 -41% MLS: ACTRIS Period: 2 years (monthly) Price: All Construction Type: All Bedrooms: All Bathrooms: All Lot Size: All Property Types: Residential: (House, Condo, Townhouse, Half Duplex, Modular) Sq Ft: All MLS Areas: 2 Clarus MarketMetrics® 1 of 2 01/04/2012 Information not guaranteed. © 2009-2010 Terradatum and its suppliers and licensors (www.terradatum.com/about/licensors.td). www.TaylorRealEstateAustin.com | Direct: 512.796.4447 | Fax: 512.628.7720 | 2525 Wallingwood Bldg. 7C Austin, TX 78746 19 of 20
- 20. Blake Taylor Taylor Real Estate Months Supply of Inventory Dec-09 vs. Dec-11: The average months supply of inventory is down 41% # Units For Sale # UC Units UC Average Time Period Last Day of Month During Month MSI DOM Dec-11 121 19 6.4 87 Nov-11 130 19 6.8 50 Oct-11 141 30 4.7 66 Sep-11 144 28 5.1 38 Aug-11 142 33 4.3 54 Jul-11 138 39 3.5 46 Jun-11 136 47 2.9 70 May-11 135 52 2.6 66 Apr-11 155 33 4.7 57 Mar-11 150 46 3.3 53 Feb-11 145 33 4.4 90 Jan-11 151 24 6.3 106 Dec-10 153 27 5.7 82 Nov-10 183 28 6.5 59 Oct-10 208 20 10.4 48 Sep-10 219 26 8.4 88 Aug-10 222 27 8.2 60 Jul-10 242 37 6.5 63 Jun-10 235 27 8.7 77 May-10 218 25 8.7 44 Apr-10 216 44 4.9 62 Mar-10 179 57 3.1 57 Feb-10 168 26 6.5 77 Jan-10 148 21 7.0 112 Dec-09 130 12 10.8 42 Clarus MarketMetrics® 2 of 2 01/04/2012 Information not guaranteed. © 2009-2010 Terradatum and its suppliers and licensors (www.terradatum.com/about/licensors.td). www.TaylorRealEstateAustin.com | Direct: 512.796.4447 | Fax: 512.628.7720 | 2525 Wallingwood Bldg. 7C Austin, TX 78746 20 of 20