Posts Diagnostic Report - 3 best usage tips
•
1 gefällt mir•30,166 views

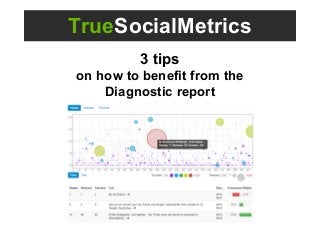
3 tips on how to benefit from the Posts Diagnostic report at TrueSocialMetrics.com. Use the Diagnostic report to find out which topics are the best at engaging your followers. That is, which topics are triggering a conversation, or are more likely to be shared or favorited.

Empfohlen
Empfohlen
Weitere ähnliche Inhalte
Kürzlich hochgeladen
Kürzlich hochgeladen (20)
Empfohlen
Empfohlen (20)
Posts Diagnostic Report - 3 best usage tips
- 1. TrueSocialMetrics 3 tips on how to benefit from the Diagnostic report
- 2. How to use the Diagnostic report 1. Analyze the posts from your Social Media Campaigns. 2. Evaluate your Content Strategy Consistency in comparison with your competitors' content. 3. Use Content Segmentation to find the most effective content tactics.
- 3. In this example, we can analyze DoubleTree Amsterdam hotel in the context of 5 different groups of hotels: 1) Amsterdam Competitors. 2) All Hilton Group hotels in Amsterdam. 3) Which DoubleTree hotel is the best in Western Europe 4) Which DoubleTree hotel is the best in Europe 5) Which DoubleTree hotel is the best among Europe hotels located in capital cities. How to use the Diagnostic report Did you know that links don’t work on the first 3 slides on SlideShare presentation? That’s why this technical slide is included here.
- 4. 1. Analyze Campaign posts Use Custom Segments feature to isolate your Campaign posts or simply select the long date range which includes the period of your Social Media Campaign to analyze the Effectiveness of the Campaign Posts. Read the full case study: Analyzing The Best Facebook Campaigns 2012 In this example Oreo’s Facebook Daily Twist Campaign lasts 100 days - 25 Jun’12 - 2 Oct’12, we used a year-long timeframe for analysis. We can see that Campaign had two peaks - at the beginning and closer to the end of the 100-days period. And we can instantly find the best performing posts of the Campaign.
- 5. 2. Compare Content Consistency Read the full case study: Soda wars: top 5 soda brands on Twitter Mountain Dew tweets From an example below, we can see that almost all of the Mountain Dew tweets demonstrate a good performance, while among Coca Cola’s tweets there is only one superstar tweet and other posts don’t get too much interaction. Coca Cola tweets Using Diagnostic report at Competitors section you can visually analyze how consistent is yours and competitors’ content strategy. Is every tweet a good performer or are there just a few one-in-a-month super-star tweets with the rest of the posts being losers?
- 6. 3. Compare Content Segments Compare several Content Segments with each other to find the most effective posting tactics. In this example, we compared Owned content (tweets created by owner of the account) and Rented content (Retweets from other accounts) segments for Coca-cola’s Twitter account. And we can clearly see that almost all of the Owned content have some social interactions. While the Rented content graph demonstrates the “purple necklace” trend - no social interactions for every tweet whatsoever. Owned content Rented content
- 7. welcome@truesocialmetrics.com Google+: +TrueSocialMetrics Twitter: @2etag Linkedin: truesocialmetrics-com necromant2005@truesocialmetrics.com tania.nikitenko@truesocialmetrics.com Skype: necromant2005, tania_nikitenko Gtalk: necromant2005, tania.nikitenko Have questions? We have answers: www.truesocialmetrics.com