On 17/10/2013 TU Delft Climate Institute organised the symposium The Greenland and Antarctic ice sheets: present, future, and unknowns. This is one of the four presentations given there.
http://www.tudelft.nl/nl/actueel/agenda/event/detail/symposium-tu-delft-climate-institute-17th-october-2013/
4. 10/18/13
Q&#$:#.)&%(5$
*,)6$'/(#..%(#$
*#/(A,#$(,/&<%-7$
3%4+0$)(T!)&%!#')&Z(%++!21!
O)(%!.+>4(5!T>4&)%$-!6(#4$&/&4!
Future SMB of Antarctica
is forced using fields of temperature, specific humidity,
zonal and meridional wind components, and surface pressure from either GCM or re-analysis output. Relaxation of
RACMO2 prognostic variables towards external forcings is
restricted to the boundary relaxation zone (Fig. 1). External
forcings are updated every six hours and linearly interpolated in time to yield accurate values in between. Sea
surface temperatures and sea-ice extent are also prescribed
from the forcing model. The version of RACMO2 used for
this study includes a snow model that calculates temperature, density and meltwater processes (percolation, retention, refreezing and runoff) in the snow (Ettema et al.
2009), and an improved albedo scheme, where the snow
albedo depends on snow grain size (Kuipers Munneke
et al. 2011). For this study, contributions from drifting
snow processes have not been included, because the
module of Lenaerts and Van den Broeke (2012) was not yet
fully implemented when we started the simulations.
For contemporary climate studies of the AIS (1–30 years),
RACMO2 has been run on grids with 27 and 5.5 km horizontal resolution (Lenaerts et al. 2012a, b). However, for the
number of simulation years considered here (660 years in
total), a horizontal resolution of 55 km is considered a good
>-)4$/&&A6A./2)-$6/?$@/'#0$)-$
Q-(#,?)./2)-$)*$)@'#,:/2)-'$B<7$6=F$5,=CG$
trade-off between computational expense and spatial detail;
doubling the grid resolution would multiply the computational time by a factor 10. Moreover, the annual integrated
SMB of the AIS at 55 km resolution (Van de Berg et al.
2006) is similar to that at 27 km resolution (Lenaerts et al.
2012a). For the scenario runs, the largest uncertainty therefore derives not from the model resolution but from the
chosen forcing model and scenario. Given this information,
and the fact that a 27 km resolution run is ten times as
expensive as a 27 km run, we chose 55 km as final resolution. The model topography, grid resolution and lateral
relaxation boundary of the domain are shown in Fig. 1.
For the period 1980–1999, a RACMO2 reference simulation, forced by ERA-40 re-analysis data from the
9)T(2#!4(5!2#'%$+-!EFCG!
European Centre for Medium-Range Weather Forecasts
(Uppala et al. 2005), was performed in order to check the
reliability of the GCM-forced RACMO2 simulations. In
this paper, ERA-40 has been used as forcing instead of its
successor ERA-Interim (Dee and et al. 2011), since the
latter only covered the period 1989–2009 at the time the
RACMO2 simulations were started. Other RACMO2
simulations forced by re-analysis data (ERA-40 or ERAInterim) yielded realistic SMB results over Antarctica
Fig. 1 Map of Antarctica
T#7%)-/.$&.%6/(#$
showing the model domain, the
boundary relaxation zone
6)0#.$T1P9ZF$
(dotted area) and model
topography in meters above sea
$ level
$
$
$
$
$
$
$
$
!
!
6$#'%$(!4(5!
2#'%$+-!EFF[!
!
M)T#%(B%$T!4(5!2#'%$+-!EFCG!
123
4
7. 10/18/13
Modelled
surface
mass
balance
(kg
m-‐2
yr-‐1)
kg
m-‐2
y-‐1
Q1
and
Q2:
Greenland
cumula2ve
mass
loss
1990-‐2010
E^ema
and
others,
2009
The
future
of
the
Greenland
ice
sheet:
an
average
warming
scenario
(RCP4.5)
Results
6.4
Conclusions
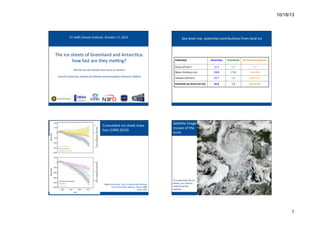
Recent mass loss from Antarctica driven by glacier acceleration
Recent mass loss from Greenland driven by glacier acceleration
but mostly by increased surface meltwater runoff
Total mass loss of both ice sheets accounts for ~1/3 of current
sea level rise, and this contribution is increasing
We have a good understanding of surface mass balance of the ice
sheets, which reasonable confidence in its predictions
Challenge: modelling ice dynamics and ice-ocean-atmosphere
interactions in a coupled system
Figure 6.10: Annual SMB for RACMO2-fHadGEM2 (grey bars), with 11-year running
Van
Angelen
and
others,
2013
average SMB for RACMO2-fERA (blue), RACMO2-fHadGEM2 (black) and RACMO2fHadGEM2, assuming the refreezing capacity remains constant at 38% throughout the
21 st century (red). 104 Gt is added to the RACMO2-fHadGEM2 SMB to correct for the
SMB bias between the two simulations for the present day (1992-2011) (Table 6.1).
uid water production increases strongly (rain and melt, +722 Gt yr 1 ), yet refreezing
only modestly increases in comparison (+133 Gt yr 1 ). In the RACMO2-fHadGEM2
simulation the refreezing capacity is reduced from 38% to 29% at the end of the 21st
century (Fig. 6.12c, blue line). This represents a 24% decrease in refreezing capacity
in less than a century’s time. The loss of refreezing capacity is concentrated in the
lower accumulation area, and marks the transformation of accumulation zone, with
net annual surface mass gain, to ablation zone, where surface mass is lost on an an-
7