

Empfohlen
Weitere ähnliche Inhalte
Was ist angesagt?
Was ist angesagt? (20)
Andere mochten auch
Andere mochten auch (20)
Ähnlich wie Ionomics
Ähnlich wie Ionomics (20)
Mehr von Senthil Natesan
Mehr von Senthil Natesan (20)
Kürzlich hochgeladen
Kürzlich hochgeladen (20)
Ionomics
- 1. Ionomics Senthil Natesan
- 2. Why ionome • Living systems are supported and sustained by the genome through the action of the transcriptome, proteome, metabolome, and ionome, the four basic biochemical pillars of functional genomics. • These pillars represent the sum of all the expressed genes, proteins, metabolites, and elements within an organism. • The dynamic response and interaction of these biochemical ‘‘omes’’ defines how a living system functions, and its study, systems biology, is now one of the biggest challenges in the life sciences • The ionome is involved in such a broad range of important biological phenomena, including electrophysiology, signaling, enzymology, osmoregulation, and transport, its study promises to yield new and significant biological insight.
- 3. What area it is covering ? • Lahner and colleagues first described the ionome to include all the metals, metalloids, and nonmetals present in an organism (Lahner et al., 2003), extending the term metallome (Outten and O’Halloran, 2001; Williams, 2001; Szpunar, 2004) to include biologically significant nonmetals such as nitrogen, phosphorus, sulfur, selenium, chlorine, and iodine. • It is important to note here that the boundaries between the ionome, metabolome, and proteome are blurred. • Compounds containing the nonmetals phosphorus, sulfur, or nitrogen, for example, would fall within both the ionome and metabolome, and metals such as zinc, copper, manganese, and iron in metalloproteins would fall within the proteome, or metalloproteome as it has been described (Szpunar, 2004). • The elements measured in the ionome will be determined by their biological importance or environmental relevance, in conjunction with their amenability to quantitation David E. Salt 2004.Update on Plant Ionomics. Plant Physiology 136: 2451–2456
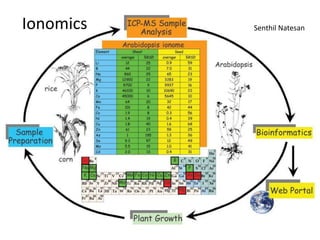
- 5. Ionome flow chart details • Figure 1. High-throughput ionomics. Putative mutants and wild-type Arabidopsis plants are grown together with known ionomic mutants, used as positive controls, under standardized conditions. • Plants are uniformly sampled, digested in concentrated nitric acid, diluted, and analyzed for numerous elements using ICP-MS. • Raw ICP-MS data are normalized using analytical standards and calculated weights based on wild- type plants (Lahner et al., 2003). • Data are processed using custom tools and stored in a searchable,World WideWeb-accessible database. • Ionomic analysis can also be applied to other plants with available genetic resources, including rice and maize. • Elements in the Periodic Table highlighted in black boxes represent those elements analyzed during our ionomic analyses using ICP-MS, elements highlighted in green are essential for plant growth, and those in red represent nonessential trace elements. • The table represents Arabidopsis (Col 0) shoot and seed ionomes, all elements presented as mg g21 dry weight. Data represent the average shoot concentrations from 60 individual plants and seed from 12 individuals 6 SD as percentage of average (%RSD), all plants grown as described by Lahner et al. (2003). David E. Salt 2004.Update on Plant Ionomics. Plant Physiology 136: 2451–2456
- 6. Natural variation –Arabidopsis ionome • Natural variation in Arabidopsis seed and shoot phosphate accumulation is known to exist between the Ler and Cvi accessions (Bentsink et al., 2003), and for potassium, sodium, calcium, magnesium, iron, mangan ese, zinc, and phosphorus in seeds of numerous ecotypes (Vreugdenhil et al., 2004). • Analyses of Ler/Cvi recombinant inbred lines revealed quantitative trait loci (QTL) that explain between 10% and 79% of this variation for the different elements (Vreugdenhil et al., 2004). Natural variation in several Arabidopsis ecotypes has also been observed for shoot caesium Baxter et al.2007 Purdue Ionomics Information Management System. An Integrated Functional Genomics Platform. Plant Physiology, 143: 600–611
- 7. Does this mutation have an ionomic phenotype?’ • Currently, PiiMS contains shoot ionomic data on over 7,500 unique Arabidopsis lines, including fastneutron, EMS, and T-DNA-mutagenized lines, natural accessions, and RILs, of which approximately 1,500 are available in the ABRC and SIGnAL collections • The database contains data on homozygous sequence indexed T-DNA lines in over 1,000 unique genes. • The lines include knockouts in transporters and kinases selected by the Arabidopsis 2010 Ionomics group (http://www.cbs.umn.edu/Arabidopsis/ionome), as well as lines sent to us by other users interested in the ionomics phenotype of knockouts in their genes of interest.
- 8. Inductively Coupled Plasma- Optical Emission Spectroscopy (ICP-OES) technology behind • The ICP is designed to generate a plasma, a gas in which atoms are present in the ionized state . • To generate a plasma a silica torch is used, situated within a water- or argon-cooled coil of a radio frequency generator (RF coil). Flowing gas (plasma gas) [typically argon (Ar)] is introduced into the plasma torch and the radio frequency field ionizes the gas, making it electrically conductive. • The plasma is maintained by the inductive heating of the flowing gas. The plasma, at up to 8000 K, is insulated both electrically and thermally from the instrument, and maintained in position by a flow of cooling argon gas (coolant gas). • The sample to be analyzed, as an aerosol, is carried into the plasma by a third argon gas stream (carrier gas). • A nebulizer in the instrument transforms the aqueous sample into an aerosol. The sample is pumped into the nebulizer via a peristaltic pump where it is converted into an aerosol, which passes into the spray chamber with the carrier argon gas. • In the spray chamber the finest sample droplets are swept into the plasma while the large sample droplets settle out and run to waste • Onintroduction into the plasma atoms in the sample are ionized, generally into singly charged positive ions. Once ionized the analyte atoms are detected using either an optical emission spectrometer or a mass spectrometer. Salt et al .2008 Ionomics and the Study of the Plant Ionome . Annu. Rev. Plant Biol. 59:709–33
- 9. Inductively Coupled Plasma Mass Spectrometry (ICP-MS) Vs ( ICP-OES) • Advantage of ICP-MS over ICP-OES is that it allows for a smaller sample size owing to its greater sensitivity. • Although ICPOES is less sensitive than ICP-MS, some of this sensitivity is won back by the robustness of ICP-OES in more concentrated sample matrices. • Whereas ICP-MS struggles with sample matrices with greater than about 0.1% solids, ICP-OES can handle up to about 3% dissolved solids • Drawbacks of ICP-MS is that the formation of polyatomic ionic species in the plasma can interfere with the measurement of particular elements; e.g., 40Ar16O+ interferes with the determination of 56Fe. • An alternative approach to the removal or reduction of interfering polyatomic ions is to utilize a single collector magnetic sector high- resolution ICP-MS (HR-ICP-MS). Salt et al .2008 Ionomics and the Study of the Plant Ionome . Annu. Rev. Plant Biol. 59:709–33
- 10. ICP-MS Analysis • eLaboratory portal, PiiMS divides the Purdue Ionomics pipeline into four process stages defined as Planting, Harvesting, Drying, and MS Analysis . • These processes can be generalized as experimental subject, sample acquisition, sample preparation, and sample analysis. Samples are first prepared for ICP-MS analysis by drying and digestion in acid. • The concentrations of various elements in the sample are then quantified using ICP-MS. Within the eManagement portal, there are tools to define the list of elements to be analyzed, providing full flexibility in the analysis. • ICP-MS analyst is satisfied with the quality of the data, it is released into the database for general searching and visualization. Baxter et al.2007 Purdue Ionomics Information Management System. An Integrated Functional Genomics Platform. Plant Physiology, 143: 600–611
- 13. Baxter et al.2007 Purdue Ionomics Information Management System. An Integrated Functional Genomics Platform. Plant Physiology, 143: 600–611
- 15. Purdue Ionomics Information Management System (PiiMS) www.purdue.edu/dp/ionomics • PiiMS currently contains data on shoot concentrations of P, Ca, K, Mg, Cu, Fe, Zn, Mn, Co, Ni, B, Se, Mo, Na, As, and Cd in over 60,000 shoot tissue samples of Arabidopsis (Arabidopsis thaliana), including ethyl methanesulfonate, fast-neutron and defined T-DNA mutants • Natural accession and populations of recombinant inbred lines from over 800 separate experiments, representing over 1,000,000 fully quantitative elemental concentrations. • Using Web services, we also plan to integrate the PiiMS ionomics dataset with other Arabidopsis resources. • Finally, we are taking the basic architectural principles of PiiMS and generalizing them across other organisms, including rice (Oryza sativa) and yeast (Saccharomyces cerevisiae), as well as other omics technologies, including proteomics and metabolomics Salt, 2004.Update on Plant Ionomics. Plant Physiology 136: 2451–2456
- 16. Applications • Once ionomics QTL have been identified, genomic tools available for A. thaliana and to some extent rice and maize can be used to locate the genes that underlie these QTL and thus describe the traits at a molecular level • Genes responsible for QTL that control Na in rice and A. thaliana ; interestingly, the responsible gene was found to be the Na- transporter HKT1 in both species. • Loudet et al. recently identified the gene that controls a major QTL for sulfate accumulation in A. thalianaadenosine 5-phosphosulfate reductase, a central enzyme in sulfate assimilation. • Researchers are also well on the way to identifying the gene that controls a major QTL for seed P content in A. thaliana, which has currently been narrowed down to only 13 open reading frames Salt et al .2008 Ionomics and the Study of the Plant Ionome . Annu. Rev. Plant Biol. 59:709–33