SlideShare ist ein Scribd-Unternehmen logo
1 von 5
Downloaden Sie, um offline zu lesen
The Lithuanian Economy
Monthly newsletter from Swedbank’s Economic Research Department
by Nerijus Mačiulis, Vaiva Šečkutė                                                                           No. 7 • 4 October 2011


       As exports decelerate, consumption increases
        The growth of exports in goods reached 38.3% during the first seven months
         of 2011 compared with the same period in 2010. Food, agricultural products,
         and mineral products have remained the major contributors to export growth
         during the past two years. However, the importance of machinery, transport,
         chemicals, and plastics has increased.

        Exports to the EU countries still amount to 60% of all exports in goods; and
         these countries by far remain the main destination for Lithuanian goods.
         During the last few years, the export share to the CIS region has expanded
         while the export share to the EU has decreased. As growth in the euro area
         ebbs, it is likely that this trend will continue. Overall, a rapid slowdown in
         growth of exports is likely.

        As exports growth decelerates, the economy is becoming more dependent
         on domestic consumption. Fortunately, global uncertainly had little impact on
         household confidence and consumption – in August, retail trade, except of
         motor vehicles, increased at the fastest pace in more than three years.

                                                                  quarter of 2006. The share of transports in total
Record breaking export growth starts to                           exports in services increased from 51.1% in 2005
decelerate                                                        (55.3% in 2004) to 58.6% in 2010, while the share
The strong growth in exports has continued this                   of tourism services decreased from 31.8% in 2004
year – the nominal growth of exports in goods                     to 25% in 2010. The transport sector, however,
reached 38.3% in the first seven months of this                   was among the hardest hit in 2009, when exports of
year, compared with the same period in 2010.                      its services declined by 23.4%.
However, the increase in exports of goods is
decelerating rapidly – growth reached 49.7% in the                Exports, million LTL
first quarter, and declined to 33.5% in the second.
                                                                   7000
The export growth in goods produced in Lithuania
                                                                   6000
decreased from 41.4% in the first quarter to 22.3%
in the second one. Exports of services increased by                5000
10.9% during the first seven months of this year,                  4000
but their growth decelerated even more rapidly –
                                                                   3000
from 24.0% in the first quarter to 4.7% in the
second.                                                            2000

Exports of goods exceeded 2007 levels at the                       1000
beginning of 2010. Export growth rates have                           0
remained above 2010 this year, except for services.                    2004    2005   2006    2007    2008    2009   2010      2011
Exports of services expanded at a much slower                                    Exports of goods
pace and, due to declining or even negative annual                               Exports of serv ices
                                                                                 Exports of goods produced in Lithuania
growth rates, exports of services dropped below the
2007 level in July.                                                Source: Statistics Lithuania, Bank of Lithuania, Swedbank

The transport sector has been the main contributor                Exports in tourism services had been decreasing for
to the growth of services exports, from the second                the seven quarters from the second half of 2008 to

                   Economic Research Department. Swedbank AB. SE-105 34 Stockholm. Phone +46-8-5859 1000
                                      E-mail: ek.sekr@swedbank.com www.swedbank.com
                              Legally responsible publisher: Cecilia Hermansson, +46-8-5859 7720.
               Nerijus Mačiulis +370 5 2582237 Lina Vrubliauskienė +370 5 258 2275. Vaiva Šečkutė +370 5 258 2156.
The Lithuanian Economy

                                                   Economic Research Department, Swedbank
                                                             No. 7 • 2011 10 04


the second quarter of 2010. However, these exports                              machinery and transport became smaller beginning
have since been rebounding at an accelerating                                   in 2008; however, the majority of these goods are
pace, and their growth exceeded the growth of                                   re-exported and therefore are not as related to the
exports of transport services during the first three                            real Lithuanian economy.
months of this year.
                                                                                Export structure, %; 2004-2011(January-July)
During 2011 or 2010, some groups of products
                                                                                 100%
demonstrated growth rates higher than those
                                                                                  90%
recorded for at least the past five years. The                                          11.9%     9%       8%      8%       6%     6.7%     6%        5.5%
                                                                                  80%
exports of chemical products increased by 59.5%                                         10.0%    11%       12%    16.0% 15.6% 15.8% 14.9% 15.9%
                                                                                  70%
this year – 5.5 percentage points more than in the
                                                                                  60%   21.8%    21%       23%                     17.3%    18%
boom year of 2008. Export growth rates of transport                                                                23%
                                                                                                                            19%                    18.9%
                                                                                  50%
(56.7%), metal (43.7%), machines and equipment
                                                                                  40%                                              21.5%    24%
(35.3%), wood (34.2%), and textiles, wearing                                            25.2%    27%       24%     14%      25%                    25.0%
                                                                                  30%
apparel, and leather (20.8%) hit record levels as                                                                  11%             9.7%     9%
                                                                                  20%                      10%              8%                        7.6%
well.                                                                                   11.4%    11%
                                                                                  10%                      14%     17%      16%    19.6%    18%    15.8%
                                                                                        11.5%    13%
Growth was also significant in the higher-value-                                   0%
added product groups. The exports of optical                                             2004 2005 2006           2007      2008     2009 2010 2011
                                                                                     Food                                  Wood, f urniture
instruments have increased by 40.0% this year.                                       Mineral products                      Machinery , transport
Even though these exports were growing faster                                        Chemicals, plastics                   Textiles. wearing. leather etc
                                                                                     Metal                                 Other
during 2007-2008 than this year, the current growth                              Source: Statistics Lithuania, Swedbank
rate of exports in optical instruments is 13.4
percentage points higher than in 2010.
                                                                                The share of food and agricultural products in total
Annual export growth, %; 2011 January-July                                      exports doubled from 11.5% in 2004 to 19.6% in
  Total except mineral products
                                                                                2009. However, this sector's growth lagged behind
                                                   37.0%
                            Total                 38.3%                         total export growth during the last two years. The
                           Other                                71.3%           export share of plastics and chemicals has
             Chemical products                              59.5%               remained stable after increasing by 6 percentage
                       Transport                           56.7%
                      Metal, etc.                     43.7%                     points to 16.0% during 2004-2007.
               Mineral products                       42.7%
            Optical instruments                     40.0%                       Contribution of main product groups to export growth, pp
                 Pulp and paper                    36.6%
                                                                                 50%                                                    Other
       Machines and equipment                     35.3%
                    Wood, etc.                    34.2%
                                                                                 40%                                                    Metal
 Food and agricultural products                  32.4%
                       Furniture              26.2%
                                                                                 30%                                      6.3%          Textiles, wearing,
              Building materials              25.1%
                                                                                        4.1%                     4.0%                   leather, etc.
 Textiles, wearing, leather, etc.           20.8%                                                                         8.1%
                                                                                 20%                             6.9%
                        Plastics           19.2%                                                                                        Chemicals,
                                                                                         18.3%                  9.8%     10.3%          plastics
                                                                                 10%
                                    0%    20%   40%      60%     80%
                                                                                                                                        Machinery ,
                                                                                         3.6%                   4.2%      5.3%
 Source: Statistics Lithuania, Swedbank                                           0%                                                    transport
                                                                                                                                        Mineral products
                                                                                                   -9.1%
                                                                                 -10%
Chemicals' and plastics' contribution to                                                           -6.6%                                Wood, f urniture
                                                                                 -20%
export growth has been increasing                                                                  -4.0%
                                                                                                                                        Food
                                                                                 -30%
There have been no significant changes in the
                                                                                          2008     2009         2010     7M 2011
structure of Lithuanian exports – mineral products                                                                                      Total
(25.0%), machinery, equipment, and transport                                     Source: Statistics Lithuania, Swedbank

(18.9%), chemicals and plastics (15.9%), and food
and agricultural products (15.8%) keep dominating                               The main contributors to growth during the last
exports.                                                                        couple of years have been mineral products and
The export share of textiles, wearing apparel, and                              machinery, equipment, and transport. During the
leather has decreased by 6.4 percentage points                                  first seven months of this year, the contribution of
from 2004 and now amounts to only 5.5% of total                                 chemicals and plastics (6.3%) increased the most.
exports. The other traditional sectors, such as wood                            Export of metals, which had been growing by 17-
and furniture, have lagged behind total export                                  44% beginning in 2004 (except for 2009, when they
growth for the last few years as well, as their share                           decreased by 31.4%), have contributed to growth
decreased from 11.4% to 7.6%. The share of                                      by 1.5-2 percentage points during last two years.


                                                                        2 (5)
The Lithuanian Economy

                                                Economic Research Department, Swedbank
                                                          No. 7 • 2011 10 04


The growth of exports of textiles, wearing apparel,                       Lithuania currently exports 6.5% of all its exports to
and leather products increased to some 21-22% in                          Belarus. This share has increased from 3.2% in
2010, and, this year, this product group’s                                2004. However, only 1.1% of goods produced in
contribution to growth has increased to 1.3-1.5                           Lithuania were exported to this country in the first
percentage points.                                                        half of 2011. Therefore, the current currency crisis
                                                                          in Belarus (the rouble has depreciated by more than
Exports to CIS region have been                                           60% since the beginning of the year) does not pose
expanding; however EU markets will remain                                 a systemic risk to Lithuania’s exports. Nevertheless,
the most important to local industry                                      the negative impact on some sectors might be
Export to CIS countries expanded the most, as this                        stronger because of the diminishing purchasing
share increased from 16.3% in 2004 to 28.3% in the                        power of Belarus.
seven months of 2011. The EU countries became
the destination for a smaller share of total exports;                     Destination of exports of goods produced in Lithuania, %;
                                                                          2004-2011(January-July)
however, more than half (60.4%) of export goods
have been sold in the EU countries this year (66.9%                        100%
in 2004). The share of total exports to the EU                              90%
                                                                                                                                          29%
                                                                                   33%     34%      33%     32%      36%    33%     32%
increased more significantly only in 2009, when                             80%
total exports fell by 26.6%.                                                70%
                                                                                                                                    5%
                                                                                                                                          5%
                                                                                    6%      6%       6%     5%               5%
                                                                            60%                                      5%
                                                                                                            5%               4%     4%    6%
Destination of exports, %; 2004-2011(January-July)                                  7%      9%       6%     6%       7%      6%     7%    6%
                                                                            50%                      6%
                                                                                    6%      6%                       6%      7%     8%    8%
                                                                            40%     6%               6%     5%
   100%                                                                                                              6%      7%     5%    7%
                                                                                    5%      6%       6%     7%
                                                                            30%     5%                               6%      8%     9%    8%
    90%                                                     24%                             6%       6%
             31%    31%    29%    28%     30%   29%   27%                                                   14%
                                                                            20%    11%     11%      11%              9%     12%     12%   13%
    80%
                                                            3%              10%     9%      8%       9%     11%      10%     8%     7%    8%
    70%                            4%           4%     4%
             5%     5%     4%             3%                                        4%      5%       5%      6%       5%     5%     5%    5%
                                                            4%               0%
    60%                            5%           4%     5%
                           4%             5%                                       2004    2005      2006   2007     2008    2009   2010 2011
    50%      5%     5%             6%                  5%   6%
                                          6%    7%                            Russia              Latv ia           Germany          Poland
                           6%                                                 Belarus             Estonia           Netherlands      UK
    40%      5%     6%             6%
                                          6%    7%     8%   7%                France              US                Sweden           Other
                           6%     10%
             5%     6%                    7%                9%             Source: Statistics Lithuania, Swedbank
    30%                    9%                   10%   10%
             10%    9%
    20%                           13%     12%          9%   10%
                           11%                  10%
             10%    10%
    10%
                           13%    15%     16%   13%   16%   16%           Such sectors as building materials, for example,
             9%     10%
     0%                                                                   made 15.3% of all its exports to Belarus in the first
             2004   2005 2006 2007 2008 2009          2010 2011           half of 2011. This share has decreased from 22.5%
   Russia
   Belarus
                      Latv ia
                      Estonia
                                    Germany
                                    Netherlands
                                                      Poland
                                                      UK
                                                                          in 2010; however it was much smaller in previous
   France             United States Sweden            Other               years (3.5% in 2004). Exporters of building
 Source: Statistics Lithuania, Swedbank                                   materials therefore might see their product demand
                                                                          dropping more significantly in this previously
Except for Russia, the export share to other BRIC                         expanding market if demand in Belarus were to
countries did not demonstrate a sustainable                               shrink significantly. Adverse events would have a
increase from 2004. Exports of goods to India,                            less sizable impact on pulp and paper exports, as
China, and Brazil have constituted only 0.7% of                           5.0% of all Lithuanian exports of this sector are
total exported goods this year (0.3% in 2004). 4.9%                       made to Belarus. Other sectors rely even less on
of all goods were exported to Canada and the US.                          this foreign market.
The main destinations for goods exports have                              The share of goods exported to Germany, which is
remained the same – Russia, Germany, and Latvia.                          the biggest market for Lithuanian goods, has
The share of total exports to Russia increased by 4                       rebounded back to 9-10% after 2008. Latvia,
percentage points, to 16%, this year. However,                            however, absorbs only 10% of Lithuanian exports,
most of this is re-exports of transport, machinery,                       below the 13% reached during the previous
and equipment and, therefore, is not as important                         economic boom. During 2007-2008, a bigger share
for the Lithuanian economy. Only 20.4% of total                           of exports was diverted to Russia as well.
exports to Russia have been of Lithuanian origin                          During 2004-2011 the share of exports to the UK
this year. And a similar situation remains in all the                     remained the most stable (4-5%); exports to the
CIS countries, where this share equals 24.6%.                             other main export partners fluctuated more. The
The growth of Lithuanian goods exports to Belarus                         share of total exports to Poland increased from
decelerated from 46.5% in 2010 to 34.7% in the first                      4.8% to 7-8%; to Belarus, by 3.3 percentage points
half of 2011 (compared with same period of 2010).                         to 6.5%. The export shares to Sweden decreased


                                                                  3 (5)
The Lithuanian Economy

                                                   Economic Research Department, Swedbank
                                                             No. 7 • 2011 10 04


by 1.7 percentage points to 3.4%; to the US, by 1.3                           expectations were barely affected by negative news
percentage points to 3.4%. France's share in total                            – they declined by 2 percentage points in August
exports declined from 6-7% to 3-4%.                                           and by 1 point in September. Retail trade sector
                                                                              confidence declined a little, but still remains
The EU market’s contribution to annual growth
                                                                              positive.
reached 22.6 percentage points in the first half of
this year (16.6% in 2010). Estonia contributed by far                         Annual change in retail trade, %, and confidence indicators
the most, as its contribution increased to 2.9% from
                                                                               30
-0.3% during 2010. Latvia’s contribution grew
                                                                               20
considerably as well. The CIS countries’
                                                                               10
contribution to growth increased from 12.4% in
                                                                                0
2010 to 15.8% in the first half of 2011.
                                                                               -10
Russia, the largest trade partner, which imports                               -20
about 16% of all Lithuanian exports, has been the                              -30
main contributor to exports’ growth. Its contribution                          -40
to annual export growth increased to 8.6                                       -50
percentage points during the first half of this year                           -60
(4.0% in 2005).                                                                      2008            2009              2010            2011
                                                                                          Retail trade conf idence indicator
                                                                                          Consumer conf idence indicator
Contribution of main trading partners to annual goods’                                    Retail trade
export growth, pp                                                                         Retail trade except of motor v ehicles and motorcy cles
                                                                                          Retail sale of f ood, bev erages and tobacco
 50%                                                      Other                Source: Statistics Lithuania, Swedbank
                                           41.2%
 40%                                                      Other CIS
                               32.7%       7.3%
         28.5%
 30%
                                                          Other EU
                                                                              Retail trade in August continued its strong growth.
        7.1%                      4.9%     9.9%
 20%                              8.1%
                                                                              Retail trade, except for motor vehicles, increased by
         9.3%                                             PL                  10.1% - the highest pace in more than three years.
                                           8.6%
 10%
          5.7%                  7.5%                      DE                  Even consumption of food, beverages, and tobacco
                    -26.6%
  0%
                                           4.2%                               increased by 1.8%, after stagnating during the first
                     -4.2%                                RU
                     -6.3%                                                    seven months of this year.
 -10%
                     -7.8%                                EE
 -20%
                                                                              It is likely that this strong growth was a
                                                          LV                  consequence of two important recent reforms
 -30%
                                                                              fighting the shadow economy – the introduction of
                                                          Total
 -40%                                                                         cashiers in food markets and restrictions on border
          2008       2009       2010      6M 2011                             crossings with a full tank of fuel (now limited to five
 Source: Statistics Lithuania, Swedbank                                       entries per month). The plan to expand the reform
                                                                              and introduce cashiers in all the markets would
It is not likely that export growth rates will remain as                      further lower shadow economy and have a positive
high as they are now. The pace of increase in                                 pact on retail trade and GDP numbers.
exports will probably be declining in the nearest                             Lithuanian economy is much better positioned to
future due to weaker growth in the EU countries –                             meet global turmoil than it was in 2008. But
the main destination for Lithuanian products. The                             memories of frequent defaults, high risk and
industrial confidence indicator dropped by 9                                  rampant uncertainty are still very fresh. Any news of
percentage points in September, the lowest level                              upcoming economic slowdown is met with
since the end of 2010. The main reasons behind                                pessimism and fear. A renewed recession in euro
this rapid decline were lower orders and export                               area and U.S. would encourage Lithuanian
expectations.                                                                 households to increase savings and cut spending;
Household consumption picks up the                                            whereas companies are likely to cautiously
                                                                              reassess their investment plans.
baton, but the risk of confidence loss is
high
The slower growth of exports will have negative                                                                               Nerijus Mačiulis
consequences for overall economic growth and the                                                                               Vaiva Šečkutė
foreign trade balance. For now, households seem
to be willing and able to offset the negative impact
of    dwindling   foreign     demand.    Household


                                                                      4 (5)
The Lithuanian Economy

                                        Economic Research Department, Swedbank
                                                  No. 7 • 2011 10 04


Swedbank
Economic Research Department           Swedbank’s monthly newsletter The Lithuanian Economy is published as a service to our
SE-105 34 Stockholm                    customers. We believe that we have used reliable sources and methods in the preparation
Phone +46-8-5859 1028                  of the analyses reported in this publication. However, we cannot guarantee the accuracy or
ek.sekr@swedbank.com                   completeness of the report and cannot be held responsible for any error or omission in the
www.swedbank.com                       underlying material or its use. Readers are encouraged to base any (investment) decisions
                                       on other material as well. Neither Swedbank nor its employees may be held responsible for
Legally responsible publisher
                                       losses or damages, direct or indirect, owing to any errors or omissions in Swedbank’s
Cecilia Hermansson, +46-8-5859 7720.
                                       monthly newsletter The Lithuanian Economy.
Nerijus Mačiulis, +370 5 2582237.
Lina Vrubliauskienė +370 5 258 2275.
Vaiva Šečkutė, +370 5 258 2156.


                                                           5 (5)

Weitere ähnliche Inhalte

Was ist angesagt? (8)

Upharmacia - March 2016
Upharmacia - March 2016Upharmacia - March 2016
Upharmacia - March 2016
 
Vieslekcija "Economic trends in Latvia"
Vieslekcija "Economic trends in Latvia"Vieslekcija "Economic trends in Latvia"
Vieslekcija "Economic trends in Latvia"
 
Economic Outlook - Derry Enterprise Week
Economic Outlook - Derry Enterprise WeekEconomic Outlook - Derry Enterprise Week
Economic Outlook - Derry Enterprise Week
 
Quarterly Report Q3 2015 Circulo de Empresarios
Quarterly Report Q3 2015 Circulo de EmpresariosQuarterly Report Q3 2015 Circulo de Empresarios
Quarterly Report Q3 2015 Circulo de Empresarios
 
Upharmacia - October 2016
Upharmacia - October 2016Upharmacia - October 2016
Upharmacia - October 2016
 
Upharmacia - November 2016
Upharmacia - November 2016Upharmacia - November 2016
Upharmacia - November 2016
 
03-Manufacturing-1.pdf
03-Manufacturing-1.pdf03-Manufacturing-1.pdf
03-Manufacturing-1.pdf
 
Upharmacia - August 2016
Upharmacia - August 2016Upharmacia - August 2016
Upharmacia - August 2016
 

Andere mochten auch

Andere mochten auch (9)

The Estonian Economy, No 3, 31 May 2011
The Estonian Economy, No 3, 31 May 2011The Estonian Economy, No 3, 31 May 2011
The Estonian Economy, No 3, 31 May 2011
 
Purchasing Managers´ Index Services, August 2011
Purchasing Managers´ Index Services, August 2011Purchasing Managers´ Index Services, August 2011
Purchasing Managers´ Index Services, August 2011
 
The Latvian Economy, 2010, May
The Latvian Economy, 2010, MayThe Latvian Economy, 2010, May
The Latvian Economy, 2010, May
 
Swedbank Analysis - June 14, 2011
Swedbank Analysis - June 14, 2011Swedbank Analysis - June 14, 2011
Swedbank Analysis - June 14, 2011
 
CEO presentation of Q1 2009 results
CEO presentation of Q1 2009 resultsCEO presentation of Q1 2009 results
CEO presentation of Q1 2009 results
 
Capital Market Days 2008 - Mikael Inglander
Capital Market Days 2008 - Mikael InglanderCapital Market Days 2008 - Mikael Inglander
Capital Market Days 2008 - Mikael Inglander
 
The Estonian Economy, 2010 May
The Estonian Economy, 2010 MayThe Estonian Economy, 2010 May
The Estonian Economy, 2010 May
 
Swedbank företagspresentation, 25 oktober 2016
Swedbank företagspresentation, 25 oktober 2016Swedbank företagspresentation, 25 oktober 2016
Swedbank företagspresentation, 25 oktober 2016
 
Swedbank Corporate Presentation, October 25 2016
Swedbank Corporate Presentation, October 25 2016Swedbank Corporate Presentation, October 25 2016
Swedbank Corporate Presentation, October 25 2016
 

Ähnlich wie The Lithuanian Economy - No 7, October 4, 2011

Lithuania go for business 2009
Lithuania go for business 2009Lithuania go for business 2009
Lithuania go for business 2009
Denis Senin
 
Apl investor presentation may 2012 final version
Apl investor presentation may 2012 final versionApl investor presentation may 2012 final version
Apl investor presentation may 2012 final version
Parish Aggarwal
 

Ähnlich wie The Lithuanian Economy - No 7, October 4, 2011 (20)

Economy... at a glance July-August 2020 Círculo de Empresarios
Economy... at a glance July-August 2020 Círculo de EmpresariosEconomy... at a glance July-August 2020 Círculo de Empresarios
Economy... at a glance July-August 2020 Círculo de Empresarios
 
Development of textile production with an overview of the export shifting
Development of textile production with an overview of the export shiftingDevelopment of textile production with an overview of the export shifting
Development of textile production with an overview of the export shifting
 
Lithuanian Economy, No. 3 - April 10, 2012
Lithuanian Economy, No. 3 - April 10, 2012Lithuanian Economy, No. 3 - April 10, 2012
Lithuanian Economy, No. 3 - April 10, 2012
 
The Lithuanian Economy, No. 1/2011
The Lithuanian Economy, No. 1/2011The Lithuanian Economy, No. 1/2011
The Lithuanian Economy, No. 1/2011
 
Lithuanian Economy, No. 2 - March 9, 2012
Lithuanian Economy, No. 2 - March 9,  2012Lithuanian Economy, No. 2 - March 9,  2012
Lithuanian Economy, No. 2 - March 9, 2012
 
2008 Shanghai Compensation and Benefits Study
2008 Shanghai Compensation and Benefits Study2008 Shanghai Compensation and Benefits Study
2008 Shanghai Compensation and Benefits Study
 
growth and_investment
growth and_investmentgrowth and_investment
growth and_investment
 
The Estonian Economy, No 5, September 27, 2011
The Estonian Economy, No 5, September 27, 2011The Estonian Economy, No 5, September 27, 2011
The Estonian Economy, No 5, September 27, 2011
 
Lithuania go for business 2009
Lithuania go for business 2009Lithuania go for business 2009
Lithuania go for business 2009
 
EMEA Economic Insight August 2010
EMEA Economic Insight August 2010EMEA Economic Insight August 2010
EMEA Economic Insight August 2010
 
Vieslekcija "Current Economic Trends in Latvia"
Vieslekcija "Current Economic Trends in Latvia"Vieslekcija "Current Economic Trends in Latvia"
Vieslekcija "Current Economic Trends in Latvia"
 
The Lithuanian Economy - No 5, August 5, 2011
The Lithuanian Economy - No 5, August 5,  2011The Lithuanian Economy - No 5, August 5,  2011
The Lithuanian Economy - No 5, August 5, 2011
 
Flash comment: Latvia - June 8, 2012
Flash comment: Latvia  - June 8, 2012Flash comment: Latvia  - June 8, 2012
Flash comment: Latvia - June 8, 2012
 
Apl investor presentation may 2012 final version
Apl investor presentation may 2012 final versionApl investor presentation may 2012 final version
Apl investor presentation may 2012 final version
 
Uzbekistan 2030, Defining the Pattern of Growth and Policies for Accelerated ...
Uzbekistan 2030, Defining the Pattern of Growth and Policies for Accelerated ...Uzbekistan 2030, Defining the Pattern of Growth and Policies for Accelerated ...
Uzbekistan 2030, Defining the Pattern of Growth and Policies for Accelerated ...
 
Business at a glance may 2018 Circulo de Empresarios
Business at  a glance may 2018 Circulo de EmpresariosBusiness at  a glance may 2018 Circulo de Empresarios
Business at a glance may 2018 Circulo de Empresarios
 
The Estonian Economy, No. 1, 10 March 2011
The Estonian Economy, No. 1, 10 March 2011The Estonian Economy, No. 1, 10 March 2011
The Estonian Economy, No. 1, 10 March 2011
 
Swedbank Analysis No.8 - June 28, 2012
Swedbank Analysis No.8 - June 28, 2012Swedbank Analysis No.8 - June 28, 2012
Swedbank Analysis No.8 - June 28, 2012
 
Flash comment: Latvia - March 9, 2012
Flash comment: Latvia - March 9, 2012Flash comment: Latvia - March 9, 2012
Flash comment: Latvia - March 9, 2012
 
Flash comment: Lithuania - May 9, 2012
Flash comment: Lithuania - May 9, 2012Flash comment: Lithuania - May 9, 2012
Flash comment: Lithuania - May 9, 2012
 

Mehr von Swedbank

Mehr von Swedbank (20)

Swedbank corporate presentation April 25 2017
Swedbank corporate presentation April 25 2017Swedbank corporate presentation April 25 2017
Swedbank corporate presentation April 25 2017
 
Swedbank foretagspresentation 25 april 2017
Swedbank foretagspresentation 25 april 2017Swedbank foretagspresentation 25 april 2017
Swedbank foretagspresentation 25 april 2017
 
Delårsrapport kv1 2017
Delårsrapport kv1 2017Delårsrapport kv1 2017
Delårsrapport kv1 2017
 
Interim report q1 2017
Interim report q1 2017Interim report q1 2017
Interim report q1 2017
 
Year end report 2016
Year end report 2016Year end report 2016
Year end report 2016
 
Bokslutskommuniké 2016
Bokslutskommuniké 2016Bokslutskommuniké 2016
Bokslutskommuniké 2016
 
Swedbank företagspresentation, 2 februari 2017
Swedbank företagspresentation, 2 februari 2017Swedbank företagspresentation, 2 februari 2017
Swedbank företagspresentation, 2 februari 2017
 
Swedbank corporate presentation, February 2 2017
Swedbank corporate presentation, February 2 2017Swedbank corporate presentation, February 2 2017
Swedbank corporate presentation, February 2 2017
 
Swedbank Corporate Presentation, June 30 2016
Swedbank Corporate Presentation, June 30 2016Swedbank Corporate Presentation, June 30 2016
Swedbank Corporate Presentation, June 30 2016
 
Swedbank företagspresentation, 30 juni 2016
Swedbank företagspresentation, 30 juni 2016Swedbank företagspresentation, 30 juni 2016
Swedbank företagspresentation, 30 juni 2016
 
Swedbank corporate presentation Q1, 2016
Swedbank corporate presentation Q1, 2016Swedbank corporate presentation Q1, 2016
Swedbank corporate presentation Q1, 2016
 
Swedbank företagspresentation kvartal 1, 2016.
Swedbank företagspresentation kvartal 1, 2016.Swedbank företagspresentation kvartal 1, 2016.
Swedbank företagspresentation kvartal 1, 2016.
 
Swedbank corporate presentation Q4, 2015
Swedbank corporate presentation Q4, 2015Swedbank corporate presentation Q4, 2015
Swedbank corporate presentation Q4, 2015
 
Swedbank företagspresentation kvartal 4,2015
Swedbank företagspresentation kvartal 4,2015Swedbank företagspresentation kvartal 4,2015
Swedbank företagspresentation kvartal 4,2015
 
Year end report 2015
Year end report 2015Year end report 2015
Year end report 2015
 
Bokslutskommuniké 2015
Bokslutskommuniké 2015Bokslutskommuniké 2015
Bokslutskommuniké 2015
 
Swedbank Företagspresentation, September 2015
Swedbank Företagspresentation, September 2015Swedbank Företagspresentation, September 2015
Swedbank Företagspresentation, September 2015
 
Swedbank Corporate Presentation, September 2015
Swedbank Corporate Presentation, September 2015Swedbank Corporate Presentation, September 2015
Swedbank Corporate Presentation, September 2015
 
Swedbank's third quarter 2015 results
Swedbank's third quarter 2015 resultsSwedbank's third quarter 2015 results
Swedbank's third quarter 2015 results
 
Swedbank Interim report third quarter 2015
Swedbank Interim report third quarter 2015Swedbank Interim report third quarter 2015
Swedbank Interim report third quarter 2015
 

Kürzlich hochgeladen

VIP Call Girl in Mumbai Central 💧 9920725232 ( Call Me ) Get A New Crush Ever...
VIP Call Girl in Mumbai Central 💧 9920725232 ( Call Me ) Get A New Crush Ever...VIP Call Girl in Mumbai Central 💧 9920725232 ( Call Me ) Get A New Crush Ever...
VIP Call Girl in Mumbai Central 💧 9920725232 ( Call Me ) Get A New Crush Ever...
dipikadinghjn ( Why You Choose Us? ) Escorts
 
VIP Call Girl Service Andheri West ⚡ 9920725232 What It Takes To Be The Best ...
VIP Call Girl Service Andheri West ⚡ 9920725232 What It Takes To Be The Best ...VIP Call Girl Service Andheri West ⚡ 9920725232 What It Takes To Be The Best ...
VIP Call Girl Service Andheri West ⚡ 9920725232 What It Takes To Be The Best ...
dipikadinghjn ( Why You Choose Us? ) Escorts
 
VIP Call Girl in Mira Road 💧 9920725232 ( Call Me ) Get A New Crush Everyday ...
VIP Call Girl in Mira Road 💧 9920725232 ( Call Me ) Get A New Crush Everyday ...VIP Call Girl in Mira Road 💧 9920725232 ( Call Me ) Get A New Crush Everyday ...
VIP Call Girl in Mira Road 💧 9920725232 ( Call Me ) Get A New Crush Everyday ...
dipikadinghjn ( Why You Choose Us? ) Escorts
 
VIP Call Girl in Mumbai 💧 9920725232 ( Call Me ) Get A New Crush Everyday Wit...
VIP Call Girl in Mumbai 💧 9920725232 ( Call Me ) Get A New Crush Everyday Wit...VIP Call Girl in Mumbai 💧 9920725232 ( Call Me ) Get A New Crush Everyday Wit...
VIP Call Girl in Mumbai 💧 9920725232 ( Call Me ) Get A New Crush Everyday Wit...
dipikadinghjn ( Why You Choose Us? ) Escorts
 
( Jasmin ) Top VIP Escorts Service Dindigul 💧 7737669865 💧 by Dindigul Call G...
( Jasmin ) Top VIP Escorts Service Dindigul 💧 7737669865 💧 by Dindigul Call G...( Jasmin ) Top VIP Escorts Service Dindigul 💧 7737669865 💧 by Dindigul Call G...
( Jasmin ) Top VIP Escorts Service Dindigul 💧 7737669865 💧 by Dindigul Call G...
dipikadinghjn ( Why You Choose Us? ) Escorts
 
call girls in Sant Nagar (DELHI) 🔝 >༒9953056974 🔝 genuine Escort Service 🔝✔️✔️
call girls in Sant Nagar (DELHI) 🔝 >༒9953056974 🔝 genuine Escort Service 🔝✔️✔️call girls in Sant Nagar (DELHI) 🔝 >༒9953056974 🔝 genuine Escort Service 🔝✔️✔️
call girls in Sant Nagar (DELHI) 🔝 >༒9953056974 🔝 genuine Escort Service 🔝✔️✔️
9953056974 Low Rate Call Girls In Saket, Delhi NCR
 
VIP Call Girl in Thane 💧 9920725232 ( Call Me ) Get A New Crush Everyday With...
VIP Call Girl in Thane 💧 9920725232 ( Call Me ) Get A New Crush Everyday With...VIP Call Girl in Thane 💧 9920725232 ( Call Me ) Get A New Crush Everyday With...
VIP Call Girl in Thane 💧 9920725232 ( Call Me ) Get A New Crush Everyday With...
dipikadinghjn ( Why You Choose Us? ) Escorts
 
VIP Independent Call Girls in Mira Bhayandar 🌹 9920725232 ( Call Me ) Mumbai ...
VIP Independent Call Girls in Mira Bhayandar 🌹 9920725232 ( Call Me ) Mumbai ...VIP Independent Call Girls in Mira Bhayandar 🌹 9920725232 ( Call Me ) Mumbai ...
VIP Independent Call Girls in Mira Bhayandar 🌹 9920725232 ( Call Me ) Mumbai ...
dipikadinghjn ( Why You Choose Us? ) Escorts
 
VIP Independent Call Girls in Andheri 🌹 9920725232 ( Call Me ) Mumbai Escorts...
VIP Independent Call Girls in Andheri 🌹 9920725232 ( Call Me ) Mumbai Escorts...VIP Independent Call Girls in Andheri 🌹 9920725232 ( Call Me ) Mumbai Escorts...
VIP Independent Call Girls in Andheri 🌹 9920725232 ( Call Me ) Mumbai Escorts...
dipikadinghjn ( Why You Choose Us? ) Escorts
 

Kürzlich hochgeladen (20)

Stock Market Brief Deck (Under Pressure).pdf
Stock Market Brief Deck (Under Pressure).pdfStock Market Brief Deck (Under Pressure).pdf
Stock Market Brief Deck (Under Pressure).pdf
 
VIP Call Girl in Mumbai Central 💧 9920725232 ( Call Me ) Get A New Crush Ever...
VIP Call Girl in Mumbai Central 💧 9920725232 ( Call Me ) Get A New Crush Ever...VIP Call Girl in Mumbai Central 💧 9920725232 ( Call Me ) Get A New Crush Ever...
VIP Call Girl in Mumbai Central 💧 9920725232 ( Call Me ) Get A New Crush Ever...
 
Call Girls Service Pune ₹7.5k Pick Up & Drop With Cash Payment 9352852248 Cal...
Call Girls Service Pune ₹7.5k Pick Up & Drop With Cash Payment 9352852248 Cal...Call Girls Service Pune ₹7.5k Pick Up & Drop With Cash Payment 9352852248 Cal...
Call Girls Service Pune ₹7.5k Pick Up & Drop With Cash Payment 9352852248 Cal...
 
TEST BANK For Corporate Finance, 13th Edition By Stephen Ross, Randolph Weste...
TEST BANK For Corporate Finance, 13th Edition By Stephen Ross, Randolph Weste...TEST BANK For Corporate Finance, 13th Edition By Stephen Ross, Randolph Weste...
TEST BANK For Corporate Finance, 13th Edition By Stephen Ross, Randolph Weste...
 
VIP Call Girl Service Andheri West ⚡ 9920725232 What It Takes To Be The Best ...
VIP Call Girl Service Andheri West ⚡ 9920725232 What It Takes To Be The Best ...VIP Call Girl Service Andheri West ⚡ 9920725232 What It Takes To Be The Best ...
VIP Call Girl Service Andheri West ⚡ 9920725232 What It Takes To Be The Best ...
 
VIP Call Girl in Mira Road 💧 9920725232 ( Call Me ) Get A New Crush Everyday ...
VIP Call Girl in Mira Road 💧 9920725232 ( Call Me ) Get A New Crush Everyday ...VIP Call Girl in Mira Road 💧 9920725232 ( Call Me ) Get A New Crush Everyday ...
VIP Call Girl in Mira Road 💧 9920725232 ( Call Me ) Get A New Crush Everyday ...
 
VIP Call Girl in Mumbai 💧 9920725232 ( Call Me ) Get A New Crush Everyday Wit...
VIP Call Girl in Mumbai 💧 9920725232 ( Call Me ) Get A New Crush Everyday Wit...VIP Call Girl in Mumbai 💧 9920725232 ( Call Me ) Get A New Crush Everyday Wit...
VIP Call Girl in Mumbai 💧 9920725232 ( Call Me ) Get A New Crush Everyday Wit...
 
( Jasmin ) Top VIP Escorts Service Dindigul 💧 7737669865 💧 by Dindigul Call G...
( Jasmin ) Top VIP Escorts Service Dindigul 💧 7737669865 💧 by Dindigul Call G...( Jasmin ) Top VIP Escorts Service Dindigul 💧 7737669865 💧 by Dindigul Call G...
( Jasmin ) Top VIP Escorts Service Dindigul 💧 7737669865 💧 by Dindigul Call G...
 
Top Rated Pune Call Girls Aundh ⟟ 6297143586 ⟟ Call Me For Genuine Sex Servi...
Top Rated  Pune Call Girls Aundh ⟟ 6297143586 ⟟ Call Me For Genuine Sex Servi...Top Rated  Pune Call Girls Aundh ⟟ 6297143586 ⟟ Call Me For Genuine Sex Servi...
Top Rated Pune Call Girls Aundh ⟟ 6297143586 ⟟ Call Me For Genuine Sex Servi...
 
Top Rated Pune Call Girls Shikrapur ⟟ 6297143586 ⟟ Call Me For Genuine Sex S...
Top Rated  Pune Call Girls Shikrapur ⟟ 6297143586 ⟟ Call Me For Genuine Sex S...Top Rated  Pune Call Girls Shikrapur ⟟ 6297143586 ⟟ Call Me For Genuine Sex S...
Top Rated Pune Call Girls Shikrapur ⟟ 6297143586 ⟟ Call Me For Genuine Sex S...
 
Booking open Available Pune Call Girls Talegaon Dabhade 6297143586 Call Hot ...
Booking open Available Pune Call Girls Talegaon Dabhade  6297143586 Call Hot ...Booking open Available Pune Call Girls Talegaon Dabhade  6297143586 Call Hot ...
Booking open Available Pune Call Girls Talegaon Dabhade 6297143586 Call Hot ...
 
WhatsApp 📞 Call : 9892124323 ✅Call Girls In Chembur ( Mumbai ) secure service
WhatsApp 📞 Call : 9892124323  ✅Call Girls In Chembur ( Mumbai ) secure serviceWhatsApp 📞 Call : 9892124323  ✅Call Girls In Chembur ( Mumbai ) secure service
WhatsApp 📞 Call : 9892124323 ✅Call Girls In Chembur ( Mumbai ) secure service
 
call girls in Sant Nagar (DELHI) 🔝 >༒9953056974 🔝 genuine Escort Service 🔝✔️✔️
call girls in Sant Nagar (DELHI) 🔝 >༒9953056974 🔝 genuine Escort Service 🔝✔️✔️call girls in Sant Nagar (DELHI) 🔝 >༒9953056974 🔝 genuine Escort Service 🔝✔️✔️
call girls in Sant Nagar (DELHI) 🔝 >༒9953056974 🔝 genuine Escort Service 🔝✔️✔️
 
Webinar on E-Invoicing for Fintech Belgium
Webinar on E-Invoicing for Fintech BelgiumWebinar on E-Invoicing for Fintech Belgium
Webinar on E-Invoicing for Fintech Belgium
 
Solution Manual for Financial Accounting, 11th Edition by Robert Libby, Patri...
Solution Manual for Financial Accounting, 11th Edition by Robert Libby, Patri...Solution Manual for Financial Accounting, 11th Edition by Robert Libby, Patri...
Solution Manual for Financial Accounting, 11th Edition by Robert Libby, Patri...
 
VIP Call Girl in Thane 💧 9920725232 ( Call Me ) Get A New Crush Everyday With...
VIP Call Girl in Thane 💧 9920725232 ( Call Me ) Get A New Crush Everyday With...VIP Call Girl in Thane 💧 9920725232 ( Call Me ) Get A New Crush Everyday With...
VIP Call Girl in Thane 💧 9920725232 ( Call Me ) Get A New Crush Everyday With...
 
VIP Independent Call Girls in Mira Bhayandar 🌹 9920725232 ( Call Me ) Mumbai ...
VIP Independent Call Girls in Mira Bhayandar 🌹 9920725232 ( Call Me ) Mumbai ...VIP Independent Call Girls in Mira Bhayandar 🌹 9920725232 ( Call Me ) Mumbai ...
VIP Independent Call Girls in Mira Bhayandar 🌹 9920725232 ( Call Me ) Mumbai ...
 
Kharghar Blowjob Housewife Call Girls NUmber-9833754194-CBD Belapur Internati...
Kharghar Blowjob Housewife Call Girls NUmber-9833754194-CBD Belapur Internati...Kharghar Blowjob Housewife Call Girls NUmber-9833754194-CBD Belapur Internati...
Kharghar Blowjob Housewife Call Girls NUmber-9833754194-CBD Belapur Internati...
 
Call Girls in New Friends Colony Delhi 💯 Call Us 🔝9205541914 🔝( Delhi) Escort...
Call Girls in New Friends Colony Delhi 💯 Call Us 🔝9205541914 🔝( Delhi) Escort...Call Girls in New Friends Colony Delhi 💯 Call Us 🔝9205541914 🔝( Delhi) Escort...
Call Girls in New Friends Colony Delhi 💯 Call Us 🔝9205541914 🔝( Delhi) Escort...
 
VIP Independent Call Girls in Andheri 🌹 9920725232 ( Call Me ) Mumbai Escorts...
VIP Independent Call Girls in Andheri 🌹 9920725232 ( Call Me ) Mumbai Escorts...VIP Independent Call Girls in Andheri 🌹 9920725232 ( Call Me ) Mumbai Escorts...
VIP Independent Call Girls in Andheri 🌹 9920725232 ( Call Me ) Mumbai Escorts...
 

The Lithuanian Economy - No 7, October 4, 2011

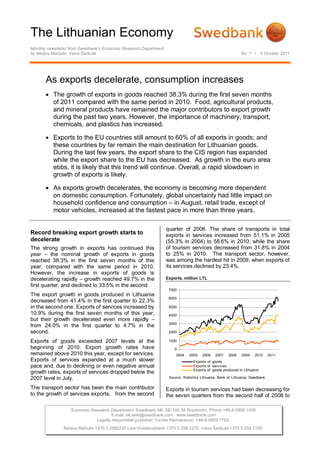
  • 1. The Lithuanian Economy Monthly newsletter from Swedbank’s Economic Research Department by Nerijus Mačiulis, Vaiva Šečkutė No. 7 • 4 October 2011 As exports decelerate, consumption increases  The growth of exports in goods reached 38.3% during the first seven months of 2011 compared with the same period in 2010. Food, agricultural products, and mineral products have remained the major contributors to export growth during the past two years. However, the importance of machinery, transport, chemicals, and plastics has increased.  Exports to the EU countries still amount to 60% of all exports in goods; and these countries by far remain the main destination for Lithuanian goods. During the last few years, the export share to the CIS region has expanded while the export share to the EU has decreased. As growth in the euro area ebbs, it is likely that this trend will continue. Overall, a rapid slowdown in growth of exports is likely.  As exports growth decelerates, the economy is becoming more dependent on domestic consumption. Fortunately, global uncertainly had little impact on household confidence and consumption – in August, retail trade, except of motor vehicles, increased at the fastest pace in more than three years. quarter of 2006. The share of transports in total Record breaking export growth starts to exports in services increased from 51.1% in 2005 decelerate (55.3% in 2004) to 58.6% in 2010, while the share The strong growth in exports has continued this of tourism services decreased from 31.8% in 2004 year – the nominal growth of exports in goods to 25% in 2010. The transport sector, however, reached 38.3% in the first seven months of this was among the hardest hit in 2009, when exports of year, compared with the same period in 2010. its services declined by 23.4%. However, the increase in exports of goods is decelerating rapidly – growth reached 49.7% in the Exports, million LTL first quarter, and declined to 33.5% in the second. 7000 The export growth in goods produced in Lithuania 6000 decreased from 41.4% in the first quarter to 22.3% in the second one. Exports of services increased by 5000 10.9% during the first seven months of this year, 4000 but their growth decelerated even more rapidly – 3000 from 24.0% in the first quarter to 4.7% in the second. 2000 Exports of goods exceeded 2007 levels at the 1000 beginning of 2010. Export growth rates have 0 remained above 2010 this year, except for services. 2004 2005 2006 2007 2008 2009 2010 2011 Exports of services expanded at a much slower Exports of goods pace and, due to declining or even negative annual Exports of serv ices Exports of goods produced in Lithuania growth rates, exports of services dropped below the 2007 level in July. Source: Statistics Lithuania, Bank of Lithuania, Swedbank The transport sector has been the main contributor Exports in tourism services had been decreasing for to the growth of services exports, from the second the seven quarters from the second half of 2008 to Economic Research Department. Swedbank AB. SE-105 34 Stockholm. Phone +46-8-5859 1000 E-mail: ek.sekr@swedbank.com www.swedbank.com Legally responsible publisher: Cecilia Hermansson, +46-8-5859 7720. Nerijus Mačiulis +370 5 2582237 Lina Vrubliauskienė +370 5 258 2275. Vaiva Šečkutė +370 5 258 2156.
  • 2. The Lithuanian Economy Economic Research Department, Swedbank No. 7 • 2011 10 04 the second quarter of 2010. However, these exports machinery and transport became smaller beginning have since been rebounding at an accelerating in 2008; however, the majority of these goods are pace, and their growth exceeded the growth of re-exported and therefore are not as related to the exports of transport services during the first three real Lithuanian economy. months of this year. Export structure, %; 2004-2011(January-July) During 2011 or 2010, some groups of products 100% demonstrated growth rates higher than those 90% recorded for at least the past five years. The 11.9% 9% 8% 8% 6% 6.7% 6% 5.5% 80% exports of chemical products increased by 59.5% 10.0% 11% 12% 16.0% 15.6% 15.8% 14.9% 15.9% 70% this year – 5.5 percentage points more than in the 60% 21.8% 21% 23% 17.3% 18% boom year of 2008. Export growth rates of transport 23% 19% 18.9% 50% (56.7%), metal (43.7%), machines and equipment 40% 21.5% 24% (35.3%), wood (34.2%), and textiles, wearing 25.2% 27% 24% 14% 25% 25.0% 30% apparel, and leather (20.8%) hit record levels as 11% 9.7% 9% 20% 10% 8% 7.6% well. 11.4% 11% 10% 14% 17% 16% 19.6% 18% 15.8% 11.5% 13% Growth was also significant in the higher-value- 0% added product groups. The exports of optical 2004 2005 2006 2007 2008 2009 2010 2011 Food Wood, f urniture instruments have increased by 40.0% this year. Mineral products Machinery , transport Even though these exports were growing faster Chemicals, plastics Textiles. wearing. leather etc Metal Other during 2007-2008 than this year, the current growth Source: Statistics Lithuania, Swedbank rate of exports in optical instruments is 13.4 percentage points higher than in 2010. The share of food and agricultural products in total Annual export growth, %; 2011 January-July exports doubled from 11.5% in 2004 to 19.6% in Total except mineral products 2009. However, this sector's growth lagged behind 37.0% Total 38.3% total export growth during the last two years. The Other 71.3% export share of plastics and chemicals has Chemical products 59.5% remained stable after increasing by 6 percentage Transport 56.7% Metal, etc. 43.7% points to 16.0% during 2004-2007. Mineral products 42.7% Optical instruments 40.0% Contribution of main product groups to export growth, pp Pulp and paper 36.6% 50% Other Machines and equipment 35.3% Wood, etc. 34.2% 40% Metal Food and agricultural products 32.4% Furniture 26.2% 30% 6.3% Textiles, wearing, Building materials 25.1% 4.1% 4.0% leather, etc. Textiles, wearing, leather, etc. 20.8% 8.1% 20% 6.9% Plastics 19.2% Chemicals, 18.3% 9.8% 10.3% plastics 10% 0% 20% 40% 60% 80% Machinery , 3.6% 4.2% 5.3% Source: Statistics Lithuania, Swedbank 0% transport Mineral products -9.1% -10% Chemicals' and plastics' contribution to -6.6% Wood, f urniture -20% export growth has been increasing -4.0% Food -30% There have been no significant changes in the 2008 2009 2010 7M 2011 structure of Lithuanian exports – mineral products Total (25.0%), machinery, equipment, and transport Source: Statistics Lithuania, Swedbank (18.9%), chemicals and plastics (15.9%), and food and agricultural products (15.8%) keep dominating The main contributors to growth during the last exports. couple of years have been mineral products and The export share of textiles, wearing apparel, and machinery, equipment, and transport. During the leather has decreased by 6.4 percentage points first seven months of this year, the contribution of from 2004 and now amounts to only 5.5% of total chemicals and plastics (6.3%) increased the most. exports. The other traditional sectors, such as wood Export of metals, which had been growing by 17- and furniture, have lagged behind total export 44% beginning in 2004 (except for 2009, when they growth for the last few years as well, as their share decreased by 31.4%), have contributed to growth decreased from 11.4% to 7.6%. The share of by 1.5-2 percentage points during last two years. 2 (5)
  • 3. The Lithuanian Economy Economic Research Department, Swedbank No. 7 • 2011 10 04 The growth of exports of textiles, wearing apparel, Lithuania currently exports 6.5% of all its exports to and leather products increased to some 21-22% in Belarus. This share has increased from 3.2% in 2010, and, this year, this product group’s 2004. However, only 1.1% of goods produced in contribution to growth has increased to 1.3-1.5 Lithuania were exported to this country in the first percentage points. half of 2011. Therefore, the current currency crisis in Belarus (the rouble has depreciated by more than Exports to CIS region have been 60% since the beginning of the year) does not pose expanding; however EU markets will remain a systemic risk to Lithuania’s exports. Nevertheless, the most important to local industry the negative impact on some sectors might be Export to CIS countries expanded the most, as this stronger because of the diminishing purchasing share increased from 16.3% in 2004 to 28.3% in the power of Belarus. seven months of 2011. The EU countries became the destination for a smaller share of total exports; Destination of exports of goods produced in Lithuania, %; 2004-2011(January-July) however, more than half (60.4%) of export goods have been sold in the EU countries this year (66.9% 100% in 2004). The share of total exports to the EU 90% 29% 33% 34% 33% 32% 36% 33% 32% increased more significantly only in 2009, when 80% total exports fell by 26.6%. 70% 5% 5% 6% 6% 6% 5% 5% 60% 5% 5% 4% 4% 6% Destination of exports, %; 2004-2011(January-July) 7% 9% 6% 6% 7% 6% 7% 6% 50% 6% 6% 6% 6% 7% 8% 8% 40% 6% 6% 5% 100% 6% 7% 5% 7% 5% 6% 6% 7% 30% 5% 6% 8% 9% 8% 90% 24% 6% 6% 31% 31% 29% 28% 30% 29% 27% 14% 20% 11% 11% 11% 9% 12% 12% 13% 80% 3% 10% 9% 8% 9% 11% 10% 8% 7% 8% 70% 4% 4% 4% 5% 5% 4% 3% 4% 5% 5% 6% 5% 5% 5% 5% 4% 0% 60% 5% 4% 5% 4% 5% 2004 2005 2006 2007 2008 2009 2010 2011 50% 5% 5% 6% 5% 6% 6% 7% Russia Latv ia Germany Poland 6% Belarus Estonia Netherlands UK 40% 5% 6% 6% 6% 7% 8% 7% France US Sweden Other 6% 10% 5% 6% 7% 9% Source: Statistics Lithuania, Swedbank 30% 9% 10% 10% 10% 9% 20% 13% 12% 9% 10% 11% 10% 10% 10% 10% 13% 15% 16% 13% 16% 16% Such sectors as building materials, for example, 9% 10% 0% made 15.3% of all its exports to Belarus in the first 2004 2005 2006 2007 2008 2009 2010 2011 half of 2011. This share has decreased from 22.5% Russia Belarus Latv ia Estonia Germany Netherlands Poland UK in 2010; however it was much smaller in previous France United States Sweden Other years (3.5% in 2004). Exporters of building Source: Statistics Lithuania, Swedbank materials therefore might see their product demand dropping more significantly in this previously Except for Russia, the export share to other BRIC expanding market if demand in Belarus were to countries did not demonstrate a sustainable shrink significantly. Adverse events would have a increase from 2004. Exports of goods to India, less sizable impact on pulp and paper exports, as China, and Brazil have constituted only 0.7% of 5.0% of all Lithuanian exports of this sector are total exported goods this year (0.3% in 2004). 4.9% made to Belarus. Other sectors rely even less on of all goods were exported to Canada and the US. this foreign market. The main destinations for goods exports have The share of goods exported to Germany, which is remained the same – Russia, Germany, and Latvia. the biggest market for Lithuanian goods, has The share of total exports to Russia increased by 4 rebounded back to 9-10% after 2008. Latvia, percentage points, to 16%, this year. However, however, absorbs only 10% of Lithuanian exports, most of this is re-exports of transport, machinery, below the 13% reached during the previous and equipment and, therefore, is not as important economic boom. During 2007-2008, a bigger share for the Lithuanian economy. Only 20.4% of total of exports was diverted to Russia as well. exports to Russia have been of Lithuanian origin During 2004-2011 the share of exports to the UK this year. And a similar situation remains in all the remained the most stable (4-5%); exports to the CIS countries, where this share equals 24.6%. other main export partners fluctuated more. The The growth of Lithuanian goods exports to Belarus share of total exports to Poland increased from decelerated from 46.5% in 2010 to 34.7% in the first 4.8% to 7-8%; to Belarus, by 3.3 percentage points half of 2011 (compared with same period of 2010). to 6.5%. The export shares to Sweden decreased 3 (5)
  • 4. The Lithuanian Economy Economic Research Department, Swedbank No. 7 • 2011 10 04 by 1.7 percentage points to 3.4%; to the US, by 1.3 expectations were barely affected by negative news percentage points to 3.4%. France's share in total – they declined by 2 percentage points in August exports declined from 6-7% to 3-4%. and by 1 point in September. Retail trade sector confidence declined a little, but still remains The EU market’s contribution to annual growth positive. reached 22.6 percentage points in the first half of this year (16.6% in 2010). Estonia contributed by far Annual change in retail trade, %, and confidence indicators the most, as its contribution increased to 2.9% from 30 -0.3% during 2010. Latvia’s contribution grew 20 considerably as well. The CIS countries’ 10 contribution to growth increased from 12.4% in 0 2010 to 15.8% in the first half of 2011. -10 Russia, the largest trade partner, which imports -20 about 16% of all Lithuanian exports, has been the -30 main contributor to exports’ growth. Its contribution -40 to annual export growth increased to 8.6 -50 percentage points during the first half of this year -60 (4.0% in 2005). 2008 2009 2010 2011 Retail trade conf idence indicator Consumer conf idence indicator Contribution of main trading partners to annual goods’ Retail trade export growth, pp Retail trade except of motor v ehicles and motorcy cles Retail sale of f ood, bev erages and tobacco 50% Other Source: Statistics Lithuania, Swedbank 41.2% 40% Other CIS 32.7% 7.3% 28.5% 30% Other EU Retail trade in August continued its strong growth. 7.1% 4.9% 9.9% 20% 8.1% Retail trade, except for motor vehicles, increased by 9.3% PL 10.1% - the highest pace in more than three years. 8.6% 10% 5.7% 7.5% DE Even consumption of food, beverages, and tobacco -26.6% 0% 4.2% increased by 1.8%, after stagnating during the first -4.2% RU -6.3% seven months of this year. -10% -7.8% EE -20% It is likely that this strong growth was a LV consequence of two important recent reforms -30% fighting the shadow economy – the introduction of Total -40% cashiers in food markets and restrictions on border 2008 2009 2010 6M 2011 crossings with a full tank of fuel (now limited to five Source: Statistics Lithuania, Swedbank entries per month). The plan to expand the reform and introduce cashiers in all the markets would It is not likely that export growth rates will remain as further lower shadow economy and have a positive high as they are now. The pace of increase in pact on retail trade and GDP numbers. exports will probably be declining in the nearest Lithuanian economy is much better positioned to future due to weaker growth in the EU countries – meet global turmoil than it was in 2008. But the main destination for Lithuanian products. The memories of frequent defaults, high risk and industrial confidence indicator dropped by 9 rampant uncertainty are still very fresh. Any news of percentage points in September, the lowest level upcoming economic slowdown is met with since the end of 2010. The main reasons behind pessimism and fear. A renewed recession in euro this rapid decline were lower orders and export area and U.S. would encourage Lithuanian expectations. households to increase savings and cut spending; Household consumption picks up the whereas companies are likely to cautiously reassess their investment plans. baton, but the risk of confidence loss is high The slower growth of exports will have negative Nerijus Mačiulis consequences for overall economic growth and the Vaiva Šečkutė foreign trade balance. For now, households seem to be willing and able to offset the negative impact of dwindling foreign demand. Household 4 (5)
  • 5. The Lithuanian Economy Economic Research Department, Swedbank No. 7 • 2011 10 04 Swedbank Economic Research Department Swedbank’s monthly newsletter The Lithuanian Economy is published as a service to our SE-105 34 Stockholm customers. We believe that we have used reliable sources and methods in the preparation Phone +46-8-5859 1028 of the analyses reported in this publication. However, we cannot guarantee the accuracy or ek.sekr@swedbank.com completeness of the report and cannot be held responsible for any error or omission in the www.swedbank.com underlying material or its use. Readers are encouraged to base any (investment) decisions on other material as well. Neither Swedbank nor its employees may be held responsible for Legally responsible publisher losses or damages, direct or indirect, owing to any errors or omissions in Swedbank’s Cecilia Hermansson, +46-8-5859 7720. monthly newsletter The Lithuanian Economy. Nerijus Mačiulis, +370 5 2582237. Lina Vrubliauskienė +370 5 258 2275. Vaiva Šečkutė, +370 5 258 2156. 5 (5)