SlideShare ist ein Scribd-Unternehmen logo
1 von 57
Downloaden Sie, um offline zu lesen
Interim report January–September 2015, 20 October 2015
Q3 2015
Swedbank –Interim report January-September 2015 Page 1 of 57
Interim report for the third quarter 2015
Third quarter compared with second quarter 2015
 Improved net interest income despite lower market
interest rates
 Continued lending growth in Sweden and Baltic countries
 Weaker stock market reduced net commission income
 Lower net gains and losses on financial items at fair
value caused by wider credit spreads and lower
customer activity
 Successful cost control allows investments to be made
at an earlier stage. The goal to reduce total expenses to
SEK 16bn for 2016 remains unchanged
 Continued high credit quality
 Stronger capitalisation
 Negative sales trend continues for funds
“Efficiency
improvements are
progressing faster
than expected and
are now allowing
us to invest more to
enhance customer
value”
Michael Wolf,
President and CEO
Financial information Q3 Q2 Jan-Sep Jan-Sep
SEKm 2015 2015 % 2015 2014 %
Total income 9 234 9 315 -1 28 167 29 925 -6
of which net interest income 5 811 5 704 2 17 234 16 833 2
Total expenses 3 879 4 047 -4 12 094 13 309 -9
Profit before impairments 5 355 5 268 2 16 073 16 616 -3
Impairment of intangible assets 254 0 254 1
Credit impairments 130 6 195 165 18
Tax expense1)
1 012 1 538 -34 3 651 3 301 11
Profit for the period attributable to the shareholders of Swedbank AB 3 928 3 666 7 11 914 12 652 -6
Earnings per share total operations, SEK, after dilution 3.51 3.30 10.69 11.40
Return on equity, total operations, % 13.5 13.4 13.8 15.6
C/I-ratio 0.42 0.43 0.43 0.44
Common Equity Tier 1 capital ratio, % 23.0 22.4 23.0 20.7
Credit impairment ratio, % 0.04 0.00 0.02 0.02
1)
One-off tax expense of SEK 447m during second quarter 2015.
Swedbank –Interim report January-September 2015 Page 2 of 57
CEO Comment
Increased concerns about global economy
Growth prospects in China’s economy were called into
question in the third quarter, which led to revised global
growth projections, falling commodity prices and
uncertainty in the securities markets. Concern
surrounding the political situation in Greece continued
as well.
The refugee crisis affects us deeply. All of us can help.
We at Swedbank are currently working with colleagues
in the industry and the authorities to find solutions that
will make it easier for newly arrived persons to gain
access to banking services. Among the challenges are
language difficulties and a lack of personal identification,
as well as laws that require us to know our customers.
The Riksbank’s repo rate cut of an additional 10 basis
points could exacerbate the imbalances in the economy.
House prices continue to rise and the housing shortage
is growing – not least due to population growth. To take
advantage of the economic opportunities that a growing
population offers, more resources should be devoted to
resolving the acute housing shortage. We need new
infrastructure at the same time that laws and regulations
need to be re-evaluated to simplify new construction. It
is positive, however, to see that new construction has
increased this year.
At Swedbank we are ready to help finance these
initiatives. At the same time we remain focused on our
customers’ financial security and are making sure that
they have sufficient buffers in their personal finances to
handle unforeseen events.
We welcome new customers
Market volatility and greater uncertainty led to slightly
lower customer activity during the quarter, which was
marked by a sense of hesitancy.
Lending growth remained stable in the Swedish
business. In the Baltic countries the positive trend
continued and we saw another quarter of lending
growth. Through the agreement to acquire Danske
Bank’s retail banking business, we are strengthening
our position mainly in Lithuania, and in Latvia, and gain
a total of 127 000 new customers.
The integration of Sparbanken Öresund took a big step
forward in October when around 100 000 customers
were transferred to Swedbank’s system. Our new
customers now have access to a broader product range
and a better mobile bank and internet bank. The
transition has been an important priority this year, and I
am proud of the outcome, which has been made
possible by the hard work and fantastic commitment of
our employees. I would like to welcome our new
customers to Swedbank.
Improved customer value – our highest priority
The results of our annual customer satisfaction survey
were published during the quarter. While Swedbank’s
results are moving in the right direction we have a lot left
to do as regards Swedish retail customers. It is positive
that customers continue to appreciate our digital
services. For the second quarter in a row Swedbank
was ranked as having the “best customer service in
social media” among global banks. And in the Baltic
countries we ranked fourth among “Most Loved Brands”
for the second consecutive year. The three top brands
were Google, Facebook and Gmail.
The service our customers demand is closely tied to the
functionality of our digital services. Dependability and
security as well as the new challenges that digitisation
poses are therefore priority issues when we examine
operational risks. Many of our IT investments are
focused on ensuring functionality and raising the level of
service.
Stable result in uncertain environment
The financial results for the quarter were stable.
Increased lending volumes helped to offset the pressure
on earnings from lower interest rates. Credit
impairments remained very low. The low risk in the bank
has led to lower funding costs. During the first half-year
we were more active in our long-term funding and
capitalised on favourable market conditions. The
issuance pace was maintained in the third quarter
despite somewhat more turbulent capital markets.
Cost control remains very good. This puts us in a better
position to enhance our customer offering and give
employees opportunities to develop. We have also been
able to bring forward several investments.
Our financial position has never been stronger. We are
in a fantastic position to meet new challenges and
opportunities, providing us all with inspiration and
motivation. There is a lot of positive energy in the
organisation to strengthen customer value.
Michael Wolf
President and CEO
Swedbank –Interim report January-September 2015 Page 3 of 57
Table of contents
Page
Financial summary 4
Overview 5
Market 5
Third quarter 2015 compared with second quarter 2015 5
Result 5
January – September 2015 compared with January – September 2014 6
Result 6
Volume trend 7
Credit and asset quality 7
Operational risks 8
Funding and liquidity 8
Ratings 8
Capital and capital adequacy 8
Other events 9
Events after 30 September 9
Business segments
Swedish Banking 10
Baltic Banking 12
Large Corporates & Institutions 14
Group Functions & Other 16
Eliminations 17
Product areas 18
Financial information
Group
Income statement, condensed 24
Statement of comprehensive income, condensed 25
Key ratios 25
Balance sheet, condensed 26
Statement of changes in equity, condensed 27
Cash flow statement, condensed 28
Notes 29
Parent company 51
Signatures of the Board of Directors and the President 56
Review report 56
Contact information 57
More detailed information can be found in Swedbank’s fact book, www.swedbank.com/ir, under
Financial information and publications.
Swedbank –Interim report January-September 2015 Page 4 of 57
Financial summary
Income statement Q3 Q2 Q3 Jan-Sep Jan-Sep
SEKm 2015 2015 % 2014 % 2015 2014 %
Net interest income 5 811 5 704 2 5 829 0 17 234 16 833 2
Net commission income 2 736 2 842 -4 2 816 -3 8 322 8 322 0
Net gains and losses on financial items at fair value 4 82 -95 799 -99 406 1 917 -79
Other income 683 687 -1 706 -3 2 205 2 853 -23
Total income 9 234 9 315 -1 10 150 -9 28 167 29 925 -6
Staff costs 2 257 2 375 -5 2 469 -9 7 104 7 807 -9
Other expenses 1 622 1 672 -3 1 695 -4 4 990 5 502 -9
Total expenses 3 879 4 047 -4 4 164 -7 12 094 13 309 -9
Profit before impairments 5 355 5 268 2 5 986 -11 16 073 16 616 -3
Impairment of intangible assets 254 0 0 254 1
Impairment of tangible assets 16 22 -27 19 -16 53 223 -76
Credit impairments 130 6 235 -45 195 165 18
Operating profit 4 955 5 240 -5 5 732 -14 15 571 16 227 -4
Tax expense 1 012 1 538 -34 1 164 -13 3 651 3 301 11
Profit for the period from continuing operations 3 943 3 702 7 4 568 -14 11 920 12 926 -8
Profit for the period from discontinued operations, after tax -11 -32 -66 -2 6 -259
Profit for the period 3 932 3 670 7 4 566 -14 11 926 12 667 -6
Profit for the period attributable to the shareholders of
Swedbank AB 3 928 3 666 7 4 560 -14 11 914 12 652 -6
Q3 Q2 Q3 Jan-Sep Jan-Sep
Key ratios and data per share 2015 2015 2014 2015 2014
Return on equity, continuing operations, % 13.5 13.5 16.6 13.8 15.9
Return on equity, total operations, % 13.5 13.4 16.6 13.8 15.6
Earnings per share before dilution,
continuing operations, SEK 1)
3.57 3.34 4.14 10.78 11.72
Earnings per share after dilution,
continuing operations, SEK 1)
3.52 3.32 4.10 10.68 11.63
Cost/income ratio 0.42 0.43 0.41 0.43 0.44
Equity per share, SEK 1)
107.5 103.1 101.1 107.5 101.1
Loan/deposit ratio, % 187 172 193 187 193
Common Equity Tier 1 capital ratio, % 23.0 22.4 20.7 23.0 20.7
Tier 1 capital ratio, % 25.7 25.0 21.9 25.7 21.9
Total capital ratio, % 28.9 28.2 24.9 28.9 24.9
Credit impairment ratio, % 0.04 0.00 0.07 0.02 0.02
Share of impaired loans, gross, % 0.35 0.36 0.47 0.35 0.47
Total provision ratio for impaired loans, % 58 55 55 58 55
Liquidity coverage ratio (LCR), % 135 136 132 135 132
Net stable funding ratio (NSFR), % 2)
104 101 102 104 102
Balance sheet data 30 Sep 31 Dec 30 Sep
SEKbn 2015 2014 % 2014 %
Loans to the public, excluding the Swedish National Debt Office
and repurchase agreements 1 370 1 325 3 1 287 6
Deposits and borrowings from the public, excluding the
Swedish National Debt Office and repurchase agreements
734 661 11 667 10
Shareholders' equity 119 117 1 111 7
Total assets 2 312 2 121 9 2 078 11
Risk exposure amount 404 414 -2 410 -1
1)
The number of shares and calculation of earnings per share are specified on page 50.
2)
NSFR according to Swedbank’s best understanding of the Basel Committee’s new recommendation (BCBS295).
The key ratios are based on profit and shareholders’ equity attributable to shareholders of Swedbank.
Key ratios and text comments regarding lending and deposits relate to volumes excluding Swedish National Debt Office and repos.
Swedbank –Interim report January-September 2015 Page 5 of 57
Overview
Market
The US economy continued to strengthen, mainly driven
by a stronger labour market, lower energy prices and
low interest rates. However, the Federal Reserve
decided not to raise its benchmark rate in September
due to growing uncertainty about the global economy,
led by China. Commodity prices fell during the summer
and early autumn, which dampened global inflation. The
European economy continued to improve, not least due
to the ECB’s expansionary monetary policy.
The Swedish economy grew by 3.3 per cent in the
second quarter, driven by consumption and housing
investment. The Riksbank’s expansionary monetary
policy and low interest rates with rising house prices, as
well as a housing shortage, helped to further accelerate
lending towards households in the third quarter. Retail
sales slowed during the summer. Households became
more pessimistic about the Swedish economy, while
businesses became more optimistic about economic
prospects. In July the Riksbank cut the repo rate by 10
basis points to -0.35 per cent, but kept it unchanged in
September at the same time that the underlying inflation
rate rose. The ECB’s expansionary monetary policy and
Norges Bank’s rate cut raised the pressure on the
Riksbank, however, to take additional monetary action
to reach its inflation target of two per cent.
The Baltic countries continued to grow in the second
quarter at an annualised rate of 1.4 per cent in
Lithuania, 2 per cent in Estonia and 2.7 per cent in
Latvia. Growth was mainly the result of household
consumption, supported by 5-7 per cent wage
increases. Baltic exports to Russia have fallen by 20-40
per cent during the year at the same time that exports to
other markets have risen by more or less a similar
amount. The pace of investment has to increase in
order to contribute to higher productivity and higher
competitiveness as wages rise. Falling global
commodity prices contributed to lower or marginal
inflation. The inflation impact from the labour market
was still limited despite higher wage increases and
declining unemployment.
The Stockholm stock exchange (OMXSPI) gained
0.4 per cent during the first nine months, but fell by
6 per cent in the third quarter. The Tallinn stock
exchange (OMXTGI) rose by 14 per cent, the Riga stock
exchange (OMXRGI) by 40 per cent and the Vilnius
stock exchange (OMXVGI) by 6 per cent during the
year. During the third quarter the Tallinn stock exchange
(OMXTGI) rose by 2 per cent, the Riga stock exchange
(OMXRGI) by 30 per cent, and the Vilnius stock
exchange (OMXVGI) by 8 per cent.
Third quarter 2015
Compared with second quarter 2015
Result
The quarterly result increased by 7 per cent to
SEK 3 928m (3 666). A one-off tax expense negatively
affected profit in the second quarter. Income and
expenses both decreased, while credit impairments
were higher. Profit before impairments improved to
SEK 5 355m (5 268). Profit increased in Baltic Banking
as well as in Group Functions & Other, mainly due to a
higher result within Group Treasury. Swedish Banking’s
profit was stable, while it decreased in Large Corporates
& Institutions (LC&I). The return on equity increased to
13.5 per cent (13.4). The cost/income ratio improved to
0.42 (0.43).
Profit before
impairments
by business segment
excl FX effects Q3 Q2 Q3
SEKm 2015 2015 2014
Swedish Banking 3 161 3 172 3 002
Baltic Banking 961 940 922
Large Corporates &
Institutions 956 1 110 947
Group Functions & Other 277 46 1 104
Total excl FX effects 5 355 5 268 5 975
FX effects 0 11
Total 5 355 5 268 5 986
Income decreased by 1 per cent to SEK 9 234m
(9 315). Net interest income increased, while net
commission income and net gains and losses on
financial items at fair value decreased.
Net interest income increased by 2 per cent to
SEK 5 811m (5 704). Net interest income increased in
Swedish Banking and Baltic Banking and was stable in
LC&I. In Group Functions & Other net interest income
fell slightly in Group Treasury. Deposit margins
decreased in all business areas due to lower interest
rates, while higher lending volumes contributed
positively. Lending margins on Swedish mortgages
increased. An extra day during the quarter affected net
interest income positively.
Net commission income fell by 4 per cent to
SEK 2 736m (2 842). Net commission income
decreased in Swedish Banking but was stable in Baltic
Banking and LC&I. Net commission income from cards
was seasonally higher. Lending related commissions
were stable. Net commission income from asset
management decreased mainly due to a declining stock
market, but also to net outflows. Net commission
income in corporate finance and securities trading was
seasonally lower.
Net gains and losses on financial items at fair value
decreased to SEK 4m (82). This was mainly due to a
lower result in LC&I, which was seasonally lower and
adversely affected by poor liquidity in the fixed income
market and wider credit spreads. Net gains and losses
on financial items improved in Group Treasury within
Group Functions & Other as wider credit spreads had a
less negative effect than in the second quarter.
Other income was stable at SEK 683m (687).
Expenses decreased by 4 per cent to SEK 3 879m
(4 047), mainly in Swedish Banking and LC&I. Staff
costs decreased, mainly due to a lower number of full-
time positions and seasonally lower expenses. The
number of full-time employees was reduced by 95,
mainly in Swedish Banking and Baltic Banking.
Impairment of intangible assets increased to SEK 254m
(0) and consisted of IT system impairment within Group
Products and the writedown of a previously acquired
asset management assignment.
Swedbank –Interim report January-September 2015 Page 6 of 57
Credit impairments increased to SEK 130m (6).
Impairments rose within LC&I due to increased
provisions for a previously known problem loan.
Swedish Banking continued to report low credit
impairments, while recoveries decreased in Baltic
Banking.
The tax expense amounted to SEK 1 012m (1 538),
corresponding to an effective tax rate of 20.4 per cent
(29.4). The second quarter was affected by one-off
items related to the Estonian and US operations, which
raised the tax expense by SEK 447m. Excluding these
one-off items, the second quarter’s effective tax rate
would have been 20.8 per cent. As previously
estimated, the effective tax rate is expected to be 19-21
per cent in the medium term.
The result from discontinued operations improved to
SEK -11m (-32).
January-September 2015
Compared with January-September 2014
Result
The result for the period decreased by 6 per cent to
SEK 11 914m (12 652), mainly due to a one-off tax
expense in the second quarter 2015 and intangible
assets impairment in the third quarter 2015. Income and
expenses both decreased. Changes in exchange rates,
primarily the depreciation of the Swedish krona against
the euro, raised profit by SEK 25m. The return on equity
fell to 13.8 per cent (15.6), affected equally by a lower
result and a larger capital base. The cost/income ratio
improved to 0.43 (0.44).
Profit before impairments decreased by 3 per cent to
SEK 16 073m (16 616). Profit rose in Swedish Banking
but was stable in Baltic Banking. Profit in LC&I and
Group Treasury within Group Functions & Other fell.
Profit before
impairments
by business segment
excl FX effects Jan-Sep Jan-Sep ∆
SEKm 2015 2014 SEKm
Swedish Banking 9 303 9 045 258
Baltic Banking 2 773 2 826 -53
Large Corporates &
Institutions 3 185 3 345 -160
Group Functions & Other 812 1 463 -651
Total excl FX effects 16 073 16 679 -606
FX effects -63 63
Total 16 073 16 616 -543
Income decreased by 6 per cent to SEK 28 167m
(29 925), mainly in Group Treasury within Group
Functions & Other. Income was stable in Baltic Banking
and decreased in other business areas. In 2014
Swedish Banking had one-off income mainly related to
the acquisition of Sparbanken Öresund. Net interest
income increased and commission income was stable.
Net gains and losses on financial items at fair value and
other income fell. Changes in exchange rates increased
income by SEK 155m.
Net interest income rose by 2 per cent to SEK 17 234m
(16 833). Group Treasury’s net interest income
improved supported by falling market interest rates. Net
interest income decreased slightly within Swedish
Banking. Lower market interest rates adversely affected
deposit margins, while increased lending volumes and
higher mortgage margins contributed positively. Net
interest income within Baltic Banking was pressured by
lower deposit margins. Net interest income was stable
within LC&I, where lower deposit margins were offset by
higher lending volumes. Higher stability fees reduced
net interest income by SEK 143m. Changes in
exchange rates raised net interest income by SEK 98m.
Net commission income was unchanged at
SEK 8 322m. Insurance related income and income
from card commissions contributed positively, while
income from corporate finance and payment
commissions fell, the latter due to the euro transition in
Lithuania and a one-off item of SEK 35m in 2014. Asset
management commissions were stable, the net affected
by higher average assets under management due to a
rising stock market and price cuts on fund fees.
Net gains and losses on financial items at fair value
decreased by 79 per cent to SEK 406m (1 917). The
lower result in Group Treasury within Group Functions &
Other is mainly due to the negative valuation effects
from covered bond repurchases and increased credit
spreads. Net gains and losses on financial items within
LC&I were stable.
Other income decreased by 23 per cent to SEK 2 205m
(2 853). Income decreased in all business areas except
LC&I, where it was stable. Swedish Banking recognised
one-off income of SEK 461m in 2014 related to the
acquisition of Sparbanken Öresund. Within Group
Functions & Other income from repossessed assets
decreased as the property portfolio was sold off.
Expenses decreased by 9 per cent to SEK 12 094m
(13 309). The biggest decrease was in Swedish
Banking, where one-off expenses of SEK 615m were
recognised in connection with the acquisition of
Sparbanken Öresund in 2014, but also due to
efficiencies. Expenses decreased in Group Functions &
Other mainly as a result of efficiency improvements, but
also one-off expenses in 2014 related to the move of the
head office. Expenses decreased within Baltic Banking
in local currency. Expenses within LC&I were stable.
Changes in exchange rates increased expenses by
SEK 92m.
The number of full-time employees decreased. In
Swedish Banking and Baltic Banking as well as Group
Products within Group Functions & Other the decrease
was due to efficiencies and digitised processes. In
Swedish Banking it was also the result of the integration
of Sparbanken Öresund. In LC&I the number of full-time
employees increased slightly.
Impairment of intangible assets increased to SEK 254m
(1) and consisted of IT system impairment within Group
Products and the writedown of a previously acquired
asset management assignment.
Impairment of tangible assets decreased to SEK 53m
(223) as a result of a lower property portfolio.
Credit impairments increased to SEK 195m (165),
mainly because Baltic Banking posted lower recoveries.
Impairments decreased within LC&I. Within Swedish
Banking credit impairments remained low, though
slightly higher than in 2014.
Swedbank –Interim report January-September 2015 Page 7 of 57
The tax expense amounted to SEK 3 651m (3 301),
corresponding to an effective tax rate of 23.4 per cent
(20.3). During the second quarter the effective tax rate
was affected by one-off items in the Estonian and US
operations. Excluding these items, the effective tax rate
would have been 20.6 per cent. As previously
estimated, the effective tax rate is expected to be 19-21
per cent in the medium term.
The result for discontinued operations amounted to
SEK 6m (-259). A reclassification of SEK -223m was
recognised in 2014 to wind down the Russian
operations.
Volume trend
Lending to mortgage customers in Sweden increased by
SEK 28bn during the period to SEK 667bn, of which
SEK 8bn in the third quarter. Swedbank’s market share
of net growth was 21 per cent during the first eight
months of the year, compared with a total market share
of 25 per cent (25 per cent as of 31 December).
Mortgage volumes in Baltic Banking increased by 2 per
cent in local currency to SEK 55bn. In Estonia and
Lithuania the portfolios grew by 4 and 5 per cent,
respectively, while it decreased by 2 per cent in Latvia.
Household lending other than mortgages grew by
SEK 3bn during the nine-month period to SEK 137bn.
The largest increase was in lending to tenant-owner
associations, which rose by SEK 3bn to SEK 101bn.
Baltic Banking’s volumes grew by 8 per cent in local
currency to SEK 11bn. Estonia and Lithuania saw
growth, while volumes in Latvia decreased slightly.
Corporate lending within Swedish Banking and LC&I
rose by SEK 11bn during the period to SEK 445bn.
During the third quarter the growth rate slowed and
volumes increased by SEK 1bn. Swedbank’s market
share of net growth in Sweden was 34 per cent during
the first eight months of the year and the total market
share increased to 19.0 per cent (18.7) as of 31 August.
Corporate lending in Baltic Banking increased by 3 per
cent in local currency to SEK 63bn. The lending portfolio
grew by 4 per cent in Lithuania, 3 per cent in Estonia
and 1 per cent in Latvia.
Swedbank’s deposits increased by SEK 73bn from the
beginning of the year to a total of SEK 734bn. The
increase was mainly due to Group Treasury and related
to higher deposits from US money market funds.
Swedish Banking’s volumes grew by SEK 19bn, of
which SEK 18bn was from private individuals. In LC&I
deposits decreased by SEK 3bn during the year. In
Baltic Banking deposits rose by 5 per cent in local
currency, with increases in all three countries. Market
shares in Sweden declined somewhat as of 31 August
to 20.9 per cent (21.1) for household deposits and
17.9 per cent (18.7) for corporate deposits.
Fund assets under management decreased by SEK 6bn
from the beginning of the year to SEK 709bn, of which
SEK 678bn relates to the Swedish operations.
Discretionary assets under management amounted to
SEK 338bn (337). During the year Swedbank Robur had
a net outflow of SEK 14bn in the Swedish market, where
the outflow was SEK 10bn in the third quarter. The
previous trend with outflows from fixed income funds
and inflows to mixed funds continued. Equity funds also
reported outflows. The net outflow from Swedbank
Robur’s equity funds was SEK 16bn, of which SEK 5bn
in the third quarter, affected by a declining stock market.
Discretionary management has seen a net inflow of
SEK 7bn for the year, but an outflow of SEK 3bn in the
third quarter. Swedbank Robur’s market share for net
inflows was negative (13 per cent for 2014).
For more information on the product areas, see
page 18.
Credit and asset quality
The quality of Swedbank’s credit portfolio remains good.
During the quarter lending to solvent customers grew at
a stable pace. Credit impairments remained at very low
levels despite that macroeconomic uncertainty and
political concerns continue to have an impact on
economic growth in the bank’s home markets. Thanks
to Swedbank’s focus on stable customers with low risk,
coupled with efforts to help them maintain a sound and
sustainable financial situation, the credit portfolio has
not been affected despite the market turbulence.
Measures are also being taken to continuously adapt
the bank’s procedures and governance to changing
global conditions as well as to offset potentially negative
effects.
Mortgage lending in Sweden continued to grow during
the year. The increase has mainly been in large urban
areas with solid economic growth. Low risk is
maintained in the mortgage portfolio through good
controls and monitoring as well as strict lending terms,
where Swedbank is working to instil a clearer culture
where borrowers pay off their loans. New amortisation
guidelines were introduced during the quarter for new
loans, in line with the Swedish Financial Supervisory
Authority’s previous proposal. These measures have
become more important against the backdrop of the
continued rise in house prices. During the third quarter
95 per cent (94 in Q2) of new mortgages granted in
Sweden with a loan-to-value ratio of over 70 per cent
were being amortised, as were 64 per cent (53 in Q2) of
those with a loan-to-value ratio of between 50 and 70
per cent. Amortisations in the Swedish mortgage
portfolio amounted to around SEK 11bn during the last
12-month period. The average loan-to-value ratio for
Swedbank’s mortgages in Sweden was 57.9 per cent
(60.1 as of 31 December 2014). In Estonia it was 49.7
per cent (53.9), in Latvia 96.1 per cent (108.2) and in
Lithuania 79.0 per cent (84.8), based on property level.
For more information, see the loan section on page 18
and page 52 of the fact book.
Lending to non-housing related property companies in
Sweden rose by SEK 6bn to SEK 125bn during the
nine-month period. The portfolio risk remained low
thanks to the good solvency of customers.
Impaired loans continued to decrease during the year
and corresponded to 0.35 per cent (0.41) of total
lending. The provision ratio for impaired loans was
39 per cent (35) and including portfolio provisions was
58 per cent (53). For more information on credit risk,
see pages 45-51 of the fact book.
Swedbank –Interim report January-September 2015 Page 8 of 57
Credit impairments, net
by business segment Q3 Q2 Q3
SEKm 2015 2015 2014
Swedish Banking 35 48 43
Baltic Banking -2 -49 -59
Estonia 21 -9 -3
Latvia -17 -95 -42
Lithuania -6 55 -14
Large Corporates & Institutions 97 7 269
Group Functions & Other 0 0 -18
Total 130 6 235
Credit impairments amounted to SEK 195m (165) during
the nine-month period, of which SEK 130m in the third
quarter, mainly related to provisions for anticipated
credit impairments from a few commitments in Sweden.
Baltic Banking reported further net recoveries, but at a
lower level.
Repossessed assets continued to decrease to
SEK 575m (933). For more information on repossessed
assets, see page 50 of the fact book.
Operational risks
Rapid digitisation has led to very high functionality and
security demands. Operational risks are therefore a top
priority. The direct losses attributable to operational
risks remained low during the third quarter. The trend
from the previous year is continuing and the number of
IT incidents is on the decline.
During the second quarter Swedbank applied to the
SFSA to use the Advanced Measurement Method
(AMA) to calculate operational risks. A decision is
expected during the first half of 2016.
Funding and liquidity
The nine-month period saw continued positive demand
for Swedbank’s bonds. In 2015 Swedbank has issued
larger volumes of long-term bonds and taken advantage
of favourable market conditions partly to pre-finance
upcoming maturities, but also to match higher lending
volumes. Economic and political uncertainty increased
slightly during the third quarter with greater uncertainty
regarding China, which led to continued high market
volatility and higher credit spreads. During the first nine
months Swedbank issued SEK 188bn in long-term debt,
of which SEK 55bn related to the third quarter. Covered
bonds, which are the most important source of financing
for the bank, accounted for SEK 42bn. The higher share
of senior unsecured funding contributed positively to the
Net Stable Funding Ratio (NSFR). According to the
updated definition (Basel 3) of how to calculate NSFR, a
larger share of assets has to be financed with long-term
financing. According to Swedbank’s interpretation of the
update, the bank’s NSFR amounts to 104 per cent as of
30 September, compared with an anticipated
requirement of 100 per cent.
On 30 September the total volume of short-term funding
amounted to SEK 251bn (195bn as of 31 December,
2014) at the same time that SEK 269bn was placed with
central banks.
Swedbank’s most important liquidity measure is the
survival horizon, which showed that the bank as of 30
September would survive more than 12 months with the
capital markets completely shut down. This applies to
total liquidity as well as liquidity in USD and EUR. For
more information on the bank’s funding and liquidity,
see pages 66-77 of the fact book.
Ratings
There were no changes in Swedbank’s ratings in the
third quarter.
Capital and capital adequacy
The Common Equity Tier 1 capital ratio was 23.0 per
cent on 30 September 2015 (22.4 per cent as of 30
June 2015 and 21.2 per cent as of 31 December 2014).
Common Equity Tier 1 capital increased by SEK 1.8bn
during the quarter to SEK 93.0bn. The bank’s profit after
deducting the anticipated dividend positively affected
Common Equity Tier 1 capital by SEK 0.7bn. The
revaluation of the estimated pension liability according
to IAS 19 increased Common Equity Tier 1 capital by
about SEK 0.5bn, mainly due to a higher discount rate
and lower inflation assumptions.
Change in Common Equity Tier 1 capital, 2015, Swedbank
consolidated situation
87.9
93.00.5 0.5
3.7
-2.9
91.2
50
55
60
65
70
75
80
85
90
95
100
SEKbn
Increase Decrease
REA decreased by SEK 2.6bn in the third quarter to
SEK 404.2bn as of 30 September. REA for credit risks
increased by SEK 0.4bn. Increased exposures to
mortgages and corporate customers mainly in Sweden,
as well as exchange rate effects, raised REA. Positive
PD changes reduced REA by SEK 3.3bn with an
updated PD model within Baltic Banking contributing
with a decrease of SEK 2.9bn. Increased collateral
values had a positive effect on LGD, helping to reduce
REA by SEK 1.9bn.
REA for market risks decreased by SEK 3.1bn, mainly
due to a lower interest rate risk compared with the
previous quarter. REA for operational risks was
unchanged during the quarter.
Swedbank –Interim report January-September 2015 Page 9 of 57
Change in REA, 2015, Swedbank consolidated situation
-3.3
4.5
-1.9
1.0 0.2
-3.1
414.2
406.8
404.2
360
370
380
390
400
410
420
Q4 2014 Q2 2015 Exposure
change
Rating
migration
(PD)
LGD
changes
Other
credit risk
CVA risk Market
risk
Q3 2015
SEKbn
Increase Decrease
Uncertainty about capital regulations persists –
Swedbank well positioned
As of September the countercyclical buffer value of
1 per cent decided by the SFSA in September 2014 is
applied. The countercyclical buffer requirement also
affects Swedbank’s capital requirement through the risk
weight floor of 25 per cent for the Swedish mortgage
portfolio.
The SFSA has completed its Supervisory Review and
Evaluation Process (SREP) for 2015 for Swedbank. In
its SREP decision, the SFSA has used the methods it
announced in May 2015 to assess capital requirements
within Pillar 2 for credit related concentration risk,
interest rate risk in the banking book and pension risk.
On this basis, Swedbank’s Common Equity Tier 1
capital requirement for individual Pillar 2 risks is
estimated at 0.9 per cent (1.1).
The total Common Equity Tier 1 capital requirement for
Swedbank was unchanged during the quarter at 19.6
per cent, compared with Swedbank’s Common Equity
Tier 1 capital ratio of 23.0 per cent as of 30 September.
The requirement increased because the capital
requirement for the risk weight floor for mortgages in
Pillar 2 is increasing in relation to the total risk exposure
amount. At the same time the requirement decreased by
a corresponding amount because the capital
requirement for individual Pillar 2 risks is lower than
previously estimated. The total requirement takes into
account an impending increase in the countercyclical
buffer value to 1.5 per cent (June 2016).
The SFSA has announced that it will continue to review
Swedish banks’ IRB A, especially with regard to
corporate risk weights, to improve the models. The
SFSA expects this work to be completed in 2016 and to
lead to an increase in the capital requirements for
corporate exposures. At the same time international
work is underway regarding capital requirements. The
Basel Committee, among others, is working to improve
the comparability of banks’ capital ratios. This work
comprises future standard methods to calculate capital
requirements for credit, market and operational risks,
where the possibility of a capital floor is being discussed
for banks that use internal models. Owing to uncertainty
about the new requirements and how and when they will
be implemented, it is still too early to draw any
conclusions about the possible impact on Swedbank.
With its robust profitability and strong capitalisation,
Swedbank is well positioned to meet future changes in
the capital requirements.
An evaluation of the leverage ratio is also underway
ahead of the possible introduction of any minimum
requirement in 2018. Swedbank’s leverage ratio as of
30 September was 4.5 per cent (4.5 per cent on 30
June).
Other events
In September Swedbank agreed to acquire Danske
Bank’s retail banking business in Lithuania and Latvia.
The agreement, which requires the approval of
regulatory authorities in Lithuania and Latvia,
strengthens Swedbank’s presence in the Baltic
countries, mainly in Lithuania.
Annual General Meeting 2016
Swedbank’s 2016 Annual General Meeting will be held
in Malmö on Tuesday, 5 April. More information on the
AGM will be available on the bank’s website:
www.swedbank.com under the heading About
Swedbank/ Corporate governance.
The Nomination Committee comprises the following
members: Lennart Anderberg, appointed by owner-
group Föreningen Sparbanksintressenter and Chair of
the Nomination Committee; Ramsay Brufer, appointed
by Alecta; Jens Henriksson, appointed by owner-group
Folksam; Peter Karlström, appointed by owner-group
Sparbanksstiftelserna; and Anders Sundström, Chair of
the Board of Directors of Swedbank AB.
Shareholders who wish to submit a proposal to the
Nomination Committee must do so no later than 7
January 2016 either by e-mail to
valberedningen@swedbank.se or by mail to:
Valberedningen
c/o Swedbank AB
Valberedningens sekreterare, Group Legal
SE-105 34 Stockholm, Sweden
Events after 30 September 2015
On 1 October Sparbanken Öresund AB was merged
with Swedbank AB. As a result, Swedbank took over
Sparbanken Öresund’s role as the issuer of outstanding
bond and subordinated loans.
In mid-October a major technological conversion was
completed in which around 100 000 customers were
transferred from Sparbanken Öresund’s system to
Swedbank. The transfer and integration of Sparbanken
Öresund have been one of Swedbank’s highest
priorities and biggest challenges during the year. The
conversion went well and progressed as planned.
Swedbank –Interim report January-September 2015 Page 10 of 57
Swedish Banking
 Improved net interest income due to higher lending volumes and margins
 Weaker stock market resulted in lower net commission income
 Efficiency improvements contributed to lower expenses
Income statement
Q3 Q2 Q3 Jan-Sep Jan-Sep
SEKm 2015 2015 % 2014 % 2015 2014 %
Net interest income 3 404 3 281 4 3 372 1 9 875 10 049 -2
Net commission income 1 717 1 916 -10 1 739 -1 5 414 5 149 5
Net gains and losses on financial items at fair value 64 63 2 47 36 181 150 21
Share of profit or loss of associates 201 228 -12 221 -9 707 886 -20
Other income 187 180 4 177 6 593 936 -37
Total income 5 573 5 668 -2 5 556 0 16 770 17 170 -2
Staff costs 861 883 -2 928 -7 2 663 3 117 -15
Variable staff costs 42 34 24 52 -19 130 152 -14
Other expenses 1 483 1 552 -4 1 545 -4 4 593 4 796 -4
Depreciation/amortisation 26 27 -4 29 -10 81 61 33
Total expenses 2 412 2 496 -3 2 554 -6 7 467 8 126 -8
Profit before impairments 3 161 3 172 0 3 002 5 9 303 9 044 3
Credit impairments 35 48 -27 43 -19 135 99 36
Operating profit 3 126 3 124 0 2 959 6 9 168 8 945 2
Tax expense 666 676 -1 629 6 1 953 1 827 7
Profit for the period 2 460 2 448 0 2 330 6 7 215 7 118 1
Profit for the period attributable to the shareholders of
Swedbank AB 2 456 2 444 0 2 324 6 7 203 7 104 1
Non-controlling interests 4 4 0 6 -33 12 14 -14
Return on allocated equity, % 19.0 18.9 26.3 18.6 28.3
Loan/deposit ratio, % 246 245 250 246 250
Credit impairment ratio, % 0.01 0.02 0.02 0.02 0.01
Cost/income ratio 0.43 0.44 0.46 0.45 0.47
Loans, SEKbn 1 059 1 050 1 1 004 5 1 059 1 004 5
Deposits, SEKbn 431 428 1 402 7 431 402 7
Full-time employees 4 571 4 651 -2 5 053 -10 4 571 5 053 -10
Development January - September
The result for the period was stable at SEK 7 203m
(7 104). Income and expenses both decreased, mainly
due to larger one-off items in the second quarter 2014 in
connection with the acquisition of Sparbanken Öresund.
Income was pressured by lower deposit margins, while
the focus on further cost efficiencies led to a reduction in
the number of employees and lower staff costs.
Net interest income decreased by 2 per cent compared
with the first nine months of 2014 as a result of lower
deposit margins, which were adversely affected by
lower market interest rates. This was largely offset by
higher lending volumes and increased mortgage
margins on both new lending and the portfolio as a
whole. Margins have gradually risen since mid-year
2014 to compensate for higher capital requirements in
the form of higher risk weights on mortgages. As of the
fourth quarter 2014 capital equivalent to a 25 per cent
risk weight floor for Swedish mortgages is allocated to
the business area, which increases allocated capital and
reduces its return. Compared with the second quarter
net interest income rose. Increased lending volumes, an
extra day in the quarter and improved mortgage margins
contributed positively, while deposit margins continued
to decline.
Household deposit volumes increased by SEK 18bn
from the beginning of the year, of which SEK 5bn in the
third quarter. Swedbank’s share of household deposits
was 20.9 per cent as of 31 August (21.1 per cent as of
31 December 2014). Corporate deposits within Swedish
Banking increased by SEK 1bn from the beginning of
the year, but decreased by SEK 2bn in the quarter.
Swedbank’s market share, including corporate deposits
within LC&I, decreased to 17.9 per cent as of 31 August
(18.7 per cent as of 31 December 2014).
Swedbank’s household mortgage volume increased by
SEK 28bn from the beginning of the year. Swedbank’s
market share of net growth was 21 per cent during the
first eight months. Swedbank’s share of the total market
was 25 per cent (25 per cent as of 31 December 2014).
Corporate lending increased by SEK 4bn from the
beginning of the year and was stable during the quarter.
The market share, including corporate lending within
LC&I, improved to 19.0 per cent (18.7 per cent as of 31
December 2014).
Net commission income rose by 5 per cent during the
first nine months compared with the same period in
2014. The increase was mainly due to higher income
from structured products as well as card and payment
commissions resulting from higher volumes. Asset
management commissions decreased slightly, the net
mainly affected by higher average assets under
management and price cuts on fund fees. The
reductions in fund fees were implemented primarily in
the fourth quarter 2014 and first quarter 2015 to create
a more attractive customer offering and adapt the fees
to a low interest rate environment. Swedbank’s market
Swedbank –Interim report January-September 2015 Page 11 of 57
share of total assets under management was 22 per
cent (23 per cent as of 31 December 2014). A larger
share of the savings related to deposit accounts and a
significantly smaller share to funds. During the third
quarter net commission income fell by 10 per cent,
mainly due to a decrease in fund management income
caused by a declining stock market as well as lower
sales of structured products during the summer. The
trend away from equity and fixed income funds toward
mixed funds continued. The net flow was negative. A
clear shift was evident in customers’ risk appetite. The
bank’s advice in this low interest rate environment
focused more on lower risk savings.
The share of associates’ profit decreased compared
with the previous year, mainly due to one-off income of
SEK 230m related to Entercard in 2014.
Other income was lower than in the previous year due
to one-off income in 2014 mainly related to the
acquisition of Sparbanken Öresund.
Expenses decreased during the first nine months
compared with the same period in 2014, when one-off
expenses in connection with the acquisition of
Sparbanken Öresund contributed to higher expenses.
The increased focus on efficiencies also reduced
expenses, mainly related to staff. Expenses fell
compared with the second quarter as well, mainly due to
lower staff costs and lower marketing expenses.
Increased use of digital channels has changed the way
customers interact with the bank and is gradually
contributing to lower staff costs.
Credit quality remained good and credit impairments
were again low, although they increased slightly
compared with the first nine months of 2014. The share
of impaired loans was 0.14 per cent (0.15 per cent).
The number of customers who use Swedbank’s digital
channels continues to grow. The Internet Bank had 3.8
million users as of 30 September, an increase of over
100 000 during the year. The Mobile Bank had 2.3
million (+335 000). Industry-wide banking solutions are
growing as well. The Swish service is now used by over
3.3 million private individuals and around 30 000
corporate customers, and the number of identifications
using Mobile BankID rose by 122 per cent to 50 million
in the third quarter. Increasing digitisation strongly
contributed to a year-on-year decrease of 16 per cent in
the number of teller transactions in branches. At the
same time the number of advisory meetings decreased
by 19 per cent.
Sweden is Swedbank’s largest market, with around 4 million private customers and more than 250 000 corporate
customers. This makes it Sweden’s largest bank by number of customers. Through our digital channels (Telephone Bank,
Internet Bank, Mobile Bank and iPad Bank) and branches, and with the cooperation of savings banks and franchisees, we
are always available. Swedbank is part of the local community. The bank’s branch managers have a strong mandate to
act in their local communities. The bank’s presence and engagement are expressed in various ways. A project called
“Young Jobs”, which has created several thousand trainee positions for young people, has played an important part in
recent years. Swedbank has 291 branches in Sweden. The various product areas are described beginning on page 18.
Swedbank –Interim report January-September 2015 Page 12 of 57
Baltic Banking
 Stable operating results
 Growing lending volumes in light of increased consumer confidence
 Acquisition of Danske Bank’s retail banking business
Income statement
Q3 Q2 Q3 Jan-Sep Jan-Sep
SEKm 2015 2015 % 2014 % 2015 2014 %
Net interest income 900 865 4 865 4 2 596 2 633 -1
Net commission income 511 524 -2 500 2 1 504 1 451 4
Net gains and losses on financial items at fair value 48 45 7 60 -20 143 175 -18
Other income 107 102 5 87 23 358 314 14
Total income 1 566 1 536 2 1 512 4 4 601 4 573 1
Staff costs 204 209 -2 187 9 623 567 10
Variable staff costs 20 18 11 19 5 57 58 -2
Other expenses 349 350 0 375 -7 1 044 1 112 -6
Depreciation/amortisation 32 34 -6 36 -11 104 107 -3
Total expenses 605 611 -1 617 -2 1 828 1 844 -1
Profit before impairments 961 925 4 895 7 2 773 2 729 2
Impairment of intangible assets 0 0 0 0 1
Impairment of tangible assets 6 1 2 5 0
Credit impairments -2 -49 -96 -59 -97 -60 -176 -66
Operating profit 957 973 -2 952 1 2 828 2 904 -3
Tax expense 132 1 064 -88 142 -7 1 327 437
Profit for the period 825 -91 810 2 1 501 2 467 -39
Profit for the period attributable to the shareholders of
Swedbank AB 825 -91 810 2 1 501 2 467 -39
Return on allocated equity, % 16.2 -1.8 15.7 9.7 15.4
Loan/deposit ratio, % 90 92 97 90 97
Credit impairment ratio, % -0.01 -0.16 -0.19 -0.06 -0.20
Cost/income ratio 0.39 0.40 0.41 0.40 0.40
Loans, SEKbn 129 126 2 121 7 129 121 7
Deposits, SEKbn 144 138 4 125 15 144 125 15
Full-time employees 3 786 3 841 -1 3 853 -2 3 786 3 853 -2
Development January - September
Profit for the first nine months of 2015 amounted to
SEK 1 501m, a decrease of 39 per cent compared with
the same period in 2014. The decrease is due to a
higher tax expense caused by an extra dividend from
the Estonian sub-group during the second quarter and
lower recoveries. Changes in exchange rates improved
profit for the period by SEK 61m.
Net interest income decreased by 5 per cent in local
currency compared with the nine-month period in 2014
as low market interest rates put pressure on deposit
margins. Mortgage portfolio margins were stable, but
slightly higher on new lending. Higher consumer finance
volume contributed positively at the same time that tight
competition and better credit quality pressured
corporate lending margins. Resolution fee accruals
reduced net interest income by SEK 42m. Changes in
exchange rates increased net interest income by
SEK 91m. Compared with the previous quarter net
interest income rose by 2 per cent in local currency,
supported by growing lending volumes and one more
day in the quarter.
Lending volumes increased by 3 per cent in local
currency compared with 31 December 2014, driven by
increased credit demand in light of continued economic
growth in the Baltic countries. The main driver remained
private consumption supported by strong wage growth.
The positive trend was seen in all major portfolios:
corporate lending, leasing, consumer finance and
mortgages. Lending volume grew in all three countries
compared with year-end 2014. In the third quarter
lending volumes increased in Estonia and Latvia.
Swedbank’s market share in lending was 29 per cent as
of 30 June 2015 (29 per cent as of 31 December 2014).
Deposit volumes increased by 5 per cent in local
currency from 31 December 2014. Deposits increased
in all three countries. Swedbank’s market share in
deposits was 29 per cent as of 30 June 2015 (28 per
cent as of 31 December 2014). The loan-to-deposit ratio
was 90 per cent (91 per cent as of 31 December 2014).
Net commission income in local currency was stable
compared with the nine-month period in 2014. Higher
customer activity increased commissions related to
cards and the number of card transactions rose by
12 per cent. Payment commissions decreased due to
Lithuania’s adoption of the euro and a reversal of a
previous fine (SEK 35m) last year. Compared with the
previous quarter net commission income decreased by
4 per cent in local currency due to changes in the
reporting of insurance income, which had a positive
effect of SEK 22m on net commissions during the
second quarter and the opposite effect on other income.
Net gains and losses on financial items at fair value
decreased by 21 per cent in local currency compared
with the first nine months of 2014. The decrease was
mainly due to lower income from the Lithuanian FX
trading business as a result of the euro adoption.
Swedbank –Interim report January-September 2015 Page 13 of 57
Other income increased by 10 per cent in local currency
compared with the nine-month period in 2014. Income
increased due to higher insurance-related income,
which rose largely because of changes in the
assumptions used to calculate provisions for guaranteed
return products in traditional life during the first quarter,
but also due to improved underlying business results.
Premium income increased by 16 per cent for life
insurance products and by 15 per cent for non-life
products from the same period in 2014.
Total expenses decreased by 4 per cent in local
currency year-on-year, mainly as a result of lower
expenses for premises, consultancy and IT. Staff costs
rose due to wage increases. As customers increasingly
choose digital services, the bank has been able in the
last year to reduce its number of branches by 11 to 147,
of which 51 are cash-smart branches that focus on
advisory services. The emphasis on digital sales is
continuing through automated campaigns and
specifically targeted offers. Starting in the third quarter
customers can obtain small loans through Swedbank’s
mobile app. Around 40 per cent of new sales to private
customers are made through the bank’s digital
channels. IT expenses decreased after work related to
the euro transition in Lithuania was completed.
Compared with the previous quarter expenses
decreased by 3 per cent, mainly due to seasonally lower
staff costs during the summer months.
Net recoveries amounted to SEK 60m (176 in the first
nine months of 2014). Latvia reported recoveries, while
Estonia and Lithuania reported credit impairments
related to a few customers.
The situation in Russia has had no financial impact. The
sectors most affected by the Russian recession are
agriculture and transportation, but Swedbank’s
exposure to them directly or indirectly is limited.
Swedbank continues to take preventive measures to
help customers that could be affected by the Russian
situation.
During the second quarter Swedbank decided to take an
extra dividend of SEK 3.7bn from the Estonian sub-
group to the parent company. Since profits in Estonia
are first taxed upon distribution, this generated an extra
tax expense of SEK 929m.
Swedbank has reached an agreement with Danske
Bank to acquire its retail banking business in Lithuania
and Latvia. The acquisition includes around 120 000
private customers in Lithuania with approximately
EUR 525m in loans and 7 000 private customers in
Latvia with approximately EUR 116m in loans. The
acquisition, which is subject to regulatory approval in
both Lithuania and Latvia, is targeted for closing in the
first quarter of 2016.
In the annual survey of “Most Loved Brands” Swedbank
took fourth place in the Baltics, the same position as last
year, with the highest score among financial institutions.
The three top brands were the global brands Google,
Facebook and Gmail.
Swedbank is the largest bank by number of customers in Estonia, Latvia and Lithuania, with more than 3 million private
customers and more than 300 000 corporate customers. According to surveys, Swedbank is also the most respected
company in the financial sector. Through its digital channels (Telephone Bank, Internet Bank and Mobile Bank) and
branches, the bank is always available. Swedbank is part of the local community. Its local social engagement is
expressed in many ways, with initiatives to promote education, entrepreneurship and social welfare. Swedbank has 37
branches in Estonia, 42 in Latvia and 68 in Lithuania. The various product areas are described on page 18.
Swedbank –Interim report January-September 2015 Page 14 of 57
Large Corporates & Institutions
 Stable net interest income and commission income
 Stronger position in euro bond issues
 Declining bond trading in volatile market
Income statement
Q3 Q2 Q3 Jan-Sep Jan-Sep
SEKm 2015 2015 % 2014 % 2015 2014 %
Net interest income 865 862 0 878 -1 2 589 2 595 0
Net commission income 509 491 4 566 -10 1 496 1 699 -12
Net gains and losses on financial items at fair value 315 576 -45 354 -11 1 478 1 495 -1
Other income 33 39 -15 36 -8 107 101 6
Total income 1 722 1 968 -13 1 834 -6 5 670 5 890 -4
Staff costs 328 363 -10 344 -5 1 050 1 001 5
Variable staff costs 57 72 -21 72 -21 211 221 -5
Other expenses 365 390 -6 418 -13 1 175 1 233 -5
Depreciation/amortisation 16 17 -6 14 14 49 52 -6
Total expenses 766 842 -9 848 -10 2 485 2 507 -1
Profit before impairments 956 1 126 -15 986 -3 3 185 3 383 -6
Credit impairments 97 7 269 -64 120 261 -54
Operating profit 859 1 119 -23 717 20 3 065 3 122 -2
Tax expense 193 16 150 29 460 663 -31
Profit for the period 666 1 103 -40 567 17 2 605 2 459 6
Profit for the period attributable to the shareholders of
Swedbank AB 666 1 103 -40 567 17 2 605 2 459 6
Return on allocated equity, % 13.3 21.2 13.6 17.2 20.9
Loan/deposit ratio, % 177 172 155 177 155
Credit impairment ratio, % 0.14 0.01 0.46 0.09 0.16
Cost/income ratio 0.44 0.43 0.46 0.44 0.43
Loans, SEKbn 182 182 0 162 12 182 162 12
Deposits, SEKbn 103 106 -3 104 -1 103 104 -1
Full-time employees 1 205 1 201 0 1 161 4 1 205 1 161 4
Development January - September
The result for the period increased by 6 per cent
compared with the first nine months in 2014, influenced
by a positive tax effect in the second quarter 2015.
Net interest income was stable compared with the first
nine months of 2014. Lower deposit margins were offset
by increased volumes and stable lending margins.
Lending volumes increased by SEK 7bn from the
beginning of the year, of which SEK 2bn was due to
changes in exchange rates. The strategy to gradually
grow the business with existing customers and
selectively expand the customer base contributed to the
increase. The biggest increase was in the retail sector.
Deposit volumes were stable. Net interest income was
also stable compared with the previous quarter. Lending
volumes were stable, as was the margin on the existing
portfolio. Credit demand remained low due to good
liquidity and relatively low investments among large
corporate customers. Deposit margins continued to
shrink. Due to the negative interest rate, Swedbank
charges financial institutions for deposits in a few
currencies. Deposit volumes decreased by SEK 3bn as
a result of lower deposits from a few customers.
Net commission income decreased by 12 per cent year-
on-year to SEK 1 496m. The decrease mainly relates to
lower income from bond issues in Norway and from
IPOs and preference share issues in Sweden.
Swedbank’s market share of Swedish bond issues
(SEK) was 22 per cent in 2015 (20 per cent as of 31
December) and in Norway (NOK) was 16 per cent
(18 per cent as of 31 December). This made Swedbank
the largest player in Sweden and the third largest in
Norway. Swedbank has gradually strengthened its
position in EUR issues and its market share has grown
during the year. Compared with the second quarter net
commission income increased by 4 per cent to
SEK 509m. Funding activity was seasonally low. Income
generated from M&A activity in Norway increased.
Earnings from unrated corporate bond issues in Norway
as well as preference share issues and IPOs were low.
Card income was seasonally higher.
Net gains and losses on financial items at fair value
were stable compared with the same period in 2014. In
the third quarter customer activity was seasonally lower
and net gains and losses on financial items fell by 45
per cent. Wider credit spreads and low liquidity had a
negative effect on earnings from fixed income trading.
Lower oil prices and concerns how the impact could
spread through the Norwegian economy led to a price
adjustment in investment grade bonds, negatively
affecting the bank’s earnings. At the same time the
holdings were reduced significantly. Market volatility
was higher at the end of the quarter, which benefited
customer activity primarily in equity and FX trading.
Total expenses for the period were stable compared
with the same period in 2014. Staff costs increased as a
result of deliberate investments. Compared with the
previous quarter total expenses fell by 9 per cent,
mainly as a result of seasonally lower staff costs in
Norway and lower other expenses.
Swedbank –Interim report January-September 2015 Page 15 of 57
The tax expense in the second quarter 2015 was
positively affected by a one-off item of SEK 230m
related to the US operations.
Credit impairments for the nine-month period decreased
to SEK 120m (261). The losses during the year were
primarily attributable to increased provisions during the
third quarter for a single commitment in the
manufacturing sector. The share of impaired loans was
0.13 per cent (0.22). Credit quality in the loan portfolio is
good. After stabilising somewhat in the second quarter,
oil prices continued to fall in the third quarter and the
investment level in the oil sector is expected to remain
low for an extended period. Companies in the offshore
and other oil-related sectors continue to take measures
to adapt to the lower investment level. Swedbank
closely dialogues with customers in these sectors, which
mainly consists of listed companies with high credit
ratings and long-term customer contracts.
Large Corporates & Institutions is responsible for Swedbank’s offering to customers with revenues above SEK 2 billion
and those whose needs are considered complex due to multinational operations or a need for sophisticated financing
solutions. They are also responsible for developing corporate and capital market products for other parts of the bank and
the Swedish savings banks. LC&I works closely with customers, who receive advice on decisions that create sustainable
profits and growth. LC&I is represented in Sweden, Norway, Estonia, Latvia, Lithuania, Finland, Luxembourg, China, the
US and South Africa.
Swedbank –Interim report January-September 2015 Page 16 of 57
Group Functions & Other
Income statement
Q3 Q2 Q3 Jan-Sep Jan-Sep
SEKm 2015 2015 % 2014 % 2015 2014 %
Net interest income 642 696 -8 714 -10 2 174 1 552 40
Net commission income -22 -109 -80 -7 -151 -31
Net gains and losses on financial items at fair value -423 -600 -30 338 -1 395 97
Share of profit or loss of associates 0 0 0 1 1 0
Other income 210 188 12 253 -17 587 830 -29
Total income 407 175 1 298 -69 1 216 2 449 -50
Staff costs 697 748 -7 808 -14 2 191 2 515 -13
Variable staff costs 48 48 0 59 -19 179 176 2
Other expenses -705 -760 -7 -780 -10 -2 247 -2 020 -11
Depreciation/amortisation 90 94 -4 108 -17 281 318 -12
Total expenses 130 130 0 195 -33 404 989 -59
Profit before impairments 277 45 1 103 -75 812 1 460 -44
Impairment of intangible assets 254 0 0 254 0
Impairment of tangible assets 10 21 -52 17 -41 48 223 -78
Credit impairments 0 0 -18 0 -19
Operating profit 13 24 -46 1 104 -99 510 1 256 -59
Tax expense 21 -218 243 -91 -89 374
Profit for the period from continuing operations -8 242 861 599 882 -32
Profit for the period from discontinued operations, after tax -11 -32 -66 -2 6 -259
Profit for the period -19 210 859 605 623 -3
Profit for the period attributable to the shareholders of
Swedbank AB -19 210 859 605 622 -3
Non-controlling interests 0 0 0 0 1
Full-time employees 4 367 4 331 1 4 537 -4 4 367 4 537 -4
Net interest income and net gains and losses on financial items mainly stem from Group Treasury. Other income mainly refers to income from the savings
banks. Expenses mainly relate to Group Products and Group staffs and are allocated to a large extent. The product areas are described in more detail
starting on page 18.
Development January - September
The result for continuing operations fell to SEK 599m in
the first nine months of the year (882), mainly due to a
lower result within Group Treasury. The result for Group
Treasury decreased to SEK 784m (1 377).
Net interest income increased to SEK 2 174m (1 552)
year-on-year. This is mainly due to Group Treasury,
where net interest income rose to SEK 2 227m (1 646)
as a result of falling market interest rates. During the
third quarter net interest income in Group Treasury
decreased to SEK 662m, compared with SEK 717m in
the second quarter.
Net gains and losses on financial items at fair value for
the nine-month period decreased to SEK -1 395m (97).
Net gains and losses on financial items within Group
Treasury decreased to SEK -1 403m (161). The effects
of covered bond repurchases were the main reason for
the negative result, which is reflected by corresponding
positive effects in net interest income over time.
Increased credit spreads also contributed negatively.
During the third quarter Group Treasury’s result
improved to SEK -417m (-600). The negative effect of
wider credit spreads was less than in the second
quarter.
Other income fell year-on-year due to lower income
from repossessed assets as a result of the significantly
reduced portfolio. A capital gain of SEK 45m on property
sales was recognised in the third quarter 2015,
compared with one-off income of SEK 82m in 2014.
Expenses decreased compared with 2014 to SEK 404m
(989). Excluding the net of services purchased and sold
internally, expenses fell by 8 per cent to SEK 4 683m
(5 118) as a result of efficiency improvements.
Expenses for repossessed assets have been reduced
as the property portfolio is sold off. During the first nine
months of 2014 one-off expenses of SEK 136m were
recognised in connection with the move of the head
office.
Impairment of intangible assets increased to SEK 254m
(0) and consisted of a writedown of IT systems within
Group Products and a writedown of a previously
acquired asset management assignment.
Impairment of tangible assets decreased to SEK 48m
(223).
Discontinued operations
The result for discontinued operations amounted to
SEK 6m (-259). In 2014 SEK -223m related to the
winding down of the Russian operations was
reclassified. Swedbank’s net lending in Russia
amounted to SEK 0.1bn.
Group Functions & Other consists of centralised business support units and the product organisation Group Products.
The centralised units serve as strategic and administrative support and comprise Accounting & Finance, Communication,
Risk, IT, Compliance, Public Affairs, HR and Legal. Group Products’ purpose is to improve efficiency in the development
and maintenance of Swedbank’s products. Group Treasury is responsible for the bank’s funding, liquidity and capital
planning. Group Treasury sets the prices on all internal deposit and loan flows in the Group through internal interest rates,
where the most important parameters are maturity, interest fixing period, currency and need for liquidity reserves.
Swedbank –Interim report January-September 2015 Page 17 of 57
Eliminations
Income statement
Q3 Q2 Q3 Jan-Sep Jan-Sep
SEKm 2015 2015 % 2014 % 2015 2014 %
Net interest income 0 0 0 0 4
Net commission income 21 20 5 18 17 59 54 9
Net gains and losses on financial items at fair value 0 -2 0 -1 0
Other income -55 -50 -10 -68 19 -148 -215 31
Total income -34 -32 -6 -50 -32 -90 -157 43
Staff costs 0 0 0 0 0
Variable staff costs 0 0 0 0 0
Other expenses -34 -32 -6 -50 -32 -90 -157 43
Depreciation/amortisation 0 0 0 0 0
Total expenses -34 -32 -6 -50 -32 -90 -157 43
Group eliminations mainly consist of eliminations of internal transactions between Group Functions
and the other business segments.
Swedbank –Interim report January-September 2015 Page 18 of 57
Product areas
Responsibility for the product areas rests with Group Products (GP) within Group Functions & Other. GP’s role is to
increase efficiency in the development and maintenance of Swedbank’s products and to ensure that the customer offering
is relevant, is competitive and is of high quality. This puts a priority on harmonising, improving efficiencies and digitising
the processes for every product. The number of products will be reduced to make it easier for the bank’s customers while
also increasing cost efficiencies. The number of funds is being reduced and efficiencies are being achieved in the
mortgage lending process at the same time that digital availability is being improved. In mobile e-commerce new card
payment solutions are being introduced to meet increased demand for e-commerce solutions. The product areas’ results
are reported in several legal units and in the three business segments. For more information, see below and in the three
business segment descriptions.
Swedbank is a leader in a number of product areas,
including asset management, cards and payments,
mortgage lending and deposits. Most customers want
more digital solutions and the greater availability they
provide. Digitisation is therefore an important area for
Swedbank. The number of customers connected to the
bank’s digital channels and their usage continue to rise.
Number of customers Jan-Sep Jan-Sep
million 2015 2014 %
Internet Bank 6.8 6.7 3
of which Sweden 3.8 3.7 4
of which Baltic countries 3.0 3.0 1
Mobile Bank 3.3 2.6 27
of which Sweden 2.3 1.9 24
of which Baltic countries 1.0 0.7 34
Mobile Bank ID, Sweden 1.9 1.2 57
Teller transactions in branches 3.0 3.8 -20
of which Sweden 2.3 2.7 -16
of which Baltic countries 0.7 1.0 -30
Loans and financing
Market factors
Mortgage demand has remained high as the housing
shortage and low interest rates continue to drive up
house prices. Credit demand within the property sector
has accounted for most of the growth in corporate
lending since 2014. To slow the pace of price increases
and the build-up of household debt, amortisation
requirements and revised interest deductions are being
discussed. Neither proposal solves the fundamental
problem in the housing market, however, of too little
supply relative to demand.
Higher capital requirements for mortgages and growing
demands for transparency from customers and
authorities are creating new opportunities for Swedish
mortgage lenders. At the same time digitisation is
making it easier for customers to compare offerings
from different providers, as well as raising customer
expectations of digital offerings. The market for
consumer credit is a clear example where simplicity and
speed have taken precedence in recent years and
where Swedbank has to be better at promoting its
offerings to customers whenever they make a purchase.
Operations and market position
Swedbank’s lending operations are concentrated in its
home markets as well as in Norway. Lending products
account for the majority of the assets on the balance
sheet, and lending amounted to SEK 1 370bn as of 30
September (1 325 as of 31 December 2014). The
largest share was lending to households, mainly
mortgages to private customers and tenant owner
associations in Sweden. The market share for
mortgages was 25 per cent as of 31 August. Swedbank
is also a major corporate lender in Sweden, with a
market share of 19 per cent. The bank has a strong
position in property management, the service sector and
retail as well as in forestry and agriculture. In Swedish
consumer credit Swedbank has a market share of about
10 per cent, corresponding to a volume of SEK 24bn.
In the Baltic countries Swedbank is the largest lender,
with market shares of 20-45 per cent. The Baltic
countries account for 9 per cent of Swedbank’s total
lending, with about an equal mix of private and
corporate customers. Estonia accounts for nearly half of
the Baltic portfolio.
Loans 30 Sep 31 Dec 30 Sep
SEKbn 2015 2014 2014
Loans, private mortgage 725 696 683
of which Sweden 667 639 628
of which Baltic countries 55 54 52
Loans, private other incl tenant owner
associations 137 134 129
of which Sweden 125 122 118
of which Baltic countries 11 10 10
Loans, corporate 508 495 475
of which Sweden 393 381 366
of which Baltic countries 63 61 59
of which Norway 36 37 35
Total 1 370 1 325 1 287
Lending to private individuals – development
Lending to private individuals amounted to SEK 862bn,
an increase of SEK 32bn during the first nine months, of
which SEK 10bn in the third quarter. Swedish
mortgages account for a total of SEK 667bn. The growth
rate in the Swedish mortgage market remained high,
with annual growth of 7.6 per cent as of August 2015.
Swedbank’s market share of net growth was 21 per cent
for the first eight months of the year. Margins increased
somewhat during the quarter. The mortgage portfolio in
the Baltic countries rose by 2 per cent in local currency.
A new law that will allow for mandatory amortisation
requirements is in preparation. This suggests that they
will be introduced in spring 2016. The requirements are
expected to comply with the SFSA’s previous proposal
where loans with a loan-to-value ratio of 70 per cent will
have to be amortised by at least 2 per cent per year. For
loans with a loan-to-value ratio of between 70 and 50
per cent, the proposal is to amortise 1 per cent per year.
As Sweden’s leading mortgage lender, Swedbank wants
to help its customers achieve financial stability and
avoid excessive debt. As of 1 September it therefore
tightened its amortisation guidelines. The guidelines are
in line with the SFSA’s previous proposal. In addition,
Swedbank tightened its loan requirements in the second
quarter to ensure that its customers can handle an
economic slowdown.
The process of converting loans from Sparbanken
Öresund to Swedbank is continuing. A large share of
customers from Sparbanken Öresund have mortgages
Swedbank –Interim report January-September 2015 Page 19 of 57
with other lenders. To date nearly SEK 5bn has been
transferred to Swedbank. About SEK 11bn remains.
Swedbank’s consumer credit volume in Sweden has
risen slightly since 2014. A review is underway of
product terms and processes in order to provide a
faster, more efficient offering. The Baltic consumer
credit portfolio grew by 7 per cent in local currency
during the nine month period and margins improved.
Corporate lending – development
Corporate lending amounted to SEK 508bn, an increase
of SEK 13bn during the nine-month period, of which
SEK 2bn in the third quarter. Swedbank’s share of new
corporate lending in Sweden is 34 per cent for the year,
compared with an underlying market share of 19 per
cent. Corporate lending in the Baltic countries grew by
3 per cent in local currency during the nine-month
period to SEK 63bn. The lending portfolio in local
currency grew by 4 per cent in Lithuania, 4 per cent in
Estonia and 1 per cent in Latvia.
The negative repo rate affects a number of corporate
loan products. Older loans tied to Stibor have a negative
reference rate (base rate). Interest rate floors have been
introduced on new corporate loans, whereby the
reference rate (Stibor) is set at 0.
Save and invest
Market factors
The savings market is undergoing change. A
demographic structure with an ageing population,
coupled with greater individual responsibility for
pensions and other long-term savings, is creating higher
demand for savings and investment products and a
great need for advisory services. Increasing digitisation
and changing regulations have contributed to greater
transparency and competition as well as to more
standardised products, leading to price pressure.
Upcoming regulations in Sweden that would prohibit
commissions are one example and would mean that
commissions can no longer be paid to distributors that
sell products on an advisory basis. The regulations are
expected to be introduced in 2017. Another trend is that
customers are more willing to switch savings providers
now that transfers are much easier and that they are
now reacting faster to changes in the market than
previously. Swedbank is positive to the debate on freer
transfers of pension savings and is not averse to
increased regulation to create an efficient transfer
market with greater transparency for customers. A
higher share of new savings is being placed in pension
products and passively managed funds with lower
margins. At the same time deposit margins are under
pressure from low interest rates as well as the prices of
other investments such as equities, fixed income funds
and index-linked bonds. Swedbank is addressing
margin pressure mainly through efficiencies and cost
savings.
Operations and market position
Swedbank is the leader in deposits in its home markets.
Its market share in Sweden was 20.9 per cent for
private deposits and 17.9 per cent for corporate
deposits. The market shares in the Baltic countries for
private deposits ranged between 27 and 54 per cent
and for corporate deposits between 11 and 36 per cent.
The shares were highest in Estonia.
Asset management is provided through Swedbank
Robur in Swedbank’s four home markets as well as in
Norway. In Sweden Swedbank Robur is the largest
player with a market share of 22.0 per cent based on
fund assets under management.
Swedbank is the seventh largest life insurance company
in Sweden, with a market share of about 7 per cent in
terms of premium payments excluding capital transfers.
The market share for transferred capital is nearly 5 per
cent, putting Swedbank in fifth place. Swedbank is the
largest life insurance company in Estonia, with
increasing market share in 2015, and the second largest
in Lithuania. As of 31 August the market shares were 40
and 22 per cent, respectively. The market share in
Latvia was 20 per cent. The market shares for Baltic
non-life insurance operations based on total premium
income ranged between 2 and 15 per cent, with the
largest share in Estonia. In homeowner’s and vehicle
insurance in Estonia the market shares were 29 per
cent and 25 per cent, respectively. Non-life insurance is
offered in Sweden through the insurance company Tre
Kronor.
Deposits – development
Deposits 30 Sep 31 Dec 30 Sep
SEKbn 2015 2014 2014
Deposits, private 391 372 358
of which Sweden 307 289 285
of which Baltic countries 83 82 73
Deposits, corporate 343 289 309
of which Sweden 214 211 212
of which Baltic countries 69 62 57
of which other countries 60 16 40
Total 734 661 667
During the first nine months of the year deposits
increased by SEK 73bn. The largest increase was in
Group Treasury, where deposits from US money market
funds increased by SEK 45bn. In Swedish Banking
volumes increased by SEK 19bn, of which SEK 18bn
from private customers. In LC&I volumes decreased by
SEK 3bn. In Baltic Banking deposits in local currency
increased by 5 per cent. Deposits increased in all three
countries. The market share for household deposits in
Sweden was unchanged at 20.9 per cent as of 31
August. Corporate deposits were stable at 17.9 per
cent. Sweden accounts for just over 70 per cent of
Swedbank’s total deposit volume.
The product range in deposits is being simplified by
reducing the number of savings account options.
Asset management – development
Fund assets under management amounted to
SEK 709bn (715), of which SEK 678bn is attributable to
the Swedish operations. Discretionary assets under
management amounted to SEK 338bn (337).
During the first nine months of the year Swedbank
Robur had a net outflow of SEK 14bn in the Swedish
fund market. Of this amount, SEK 10bn related to the
third quarter, of which SEK 4bn was withdrawals by a
few institutional customers. The trend from the first half-
year with outflows from fixed income funds and inflows
to mixed funds continued, although the outflow from
fixed income funds decreased and the inflow to mixed
funds levelled off. Equity funds continued to see large
outflows due to stock market jitters. The net outflow
Swedbank –Interim report January-September 2015 Page 20 of 57
from Swedbank’s equity funds was SEK 16bn during the
nine-month period, of which SEK 5bn was in the third
quarter.
Net inflow Swedish Total
Of which
Robur Total
Of which
Robur
fund market, SEKbn 2015 2015 Q3 2015 Q3 2015
Fixed income funds 17 -11 6 -6
Mixed funds 59 13 6 1
Equity funds -41 -16 -18 -5
of which index funds 10 0 1 0
Other funds 13 0 3 0
Total net inflow 48 -14 -3 -10
Swedbank’s market share of the net flow in Sweden in
January-September was negative. Swedbank is also a
distributor of other funds, and its share of total net sales
was also negative (22 per cent for 2014), with lower
sales of external funds as well. To strengthen the fund
offering, management fees have been reduced on 23
actively managed funds and 11 mixed funds in 2015.
Measures to simplify and develop the offering, reduce
the number of funds and improve management
performance are continuing. Changes were made
earlier in the management process to streamline the
selection of companies that the funds invest in and add
a larger share of global investments. During the second
quarter a new policy was adopted for responsible
investing, which is being implemented in the fund
offering this autumn. This primarily means influencing
companies in a sustainable direction, but also
eliminating companies that do not meet the
sustainability criteria. The percentage of sustainable
funds increased during the quarter through the launch of
four funds with special sustainability criteria, which at
the same time absorbed eight existing funds, four of
which were ethical funds. In 2015 the return on assets
has improved, as has the average rating from
Morningstar.
The investment savings account offering was improved
during the period by having contracts and terms
managed digitally. The number of new accounts
increased by over 50 per cent from the beginning of the
year and continues to rise, albeit at a slower rate.
Asset management Jan-Sep Jan-Sep
Key ratios, SEKbn 2015 2014 %
Total income, SEKm 3 309 3 348 -1
Assets under management 709 677 5
of which Sweden 678 649 4
of which Baltic countries 28 24 13
of which Norway 3 3 -1
Discretionary asset management 338 319 6
Asset management income was stable for 2015
compared with the same period in 2014. The price cuts
that have been implemented have squeezed income,
while higher average assets under management due to
a rising stock market has affected income positively.
Compared with the second quarter income decreased
by 7 per cent, mainly due to a declining stock market,
but also to net outflows.
Insurance – development
Premium income Jan-Sep Jan-Sep
SEKm 2015 2014 %
Sweden 12 723 11 563 10
of which collective occupational
pensions 3 281 3 317 -1
of which endowment insurance 6 785 5 556 22
of which occupational pensions 1 634 1 649 -1
of which risk insurance 606 558 9
of which other 418 484 -14
Baltic countries 1 063 888 20
of which life insurance 657 547 20
of which non-life insurance 406 342 19
During the period life insurance premium income in
Sweden rose by 10 per cent year-on-year. Sales of
corporate endowment insurance improved primarily due
to new policies, but also to higher volumes from existing
contracts. The decrease in collective occupational
pensions mainly relates to the SAF-LO collective
agreement after Swedbank decided to no longer offer
traditional management products. On the other hand,
capital transferred from other insurers more than
doubled. Sales of life and health insurance increased.
Premium income in the Baltic life insurance business
rose by 16 per cent in local currency year-on-year, with
the biggest gain in risk products, where demand has
grown. The increase is due to a high number of contract
renewals in the previous year and a further increase in
new policies. Customer demand for digital solutions is
on the rise. Swedbank’s electronic identification solution
allows customers to obtain and revise insurance policies
and file claims online. Around 31 per cent (12) of claims
and 40 per cent (36) of insurance transactions are now
handled online, which has made it possible to manage
more cases with the same number of employees. The
positive trend in premium income in Baltic non-life
insurance continued. In total, premiums increased by
15 per cent in local currency. The increase related to all
products, but especially homeowner’s insurance, where
advertising campaigns and more active sales by bank
branches led to higher volumes. Increasing online sales
contributed to higher premium income primarily for
travel and vehicle insurance. Sales of travel insurance
sold solely online increased by around 30 per cent
compared with the same period in 2014.
Assets under management 30 Sep 31 Dec 30 Sep
SEKbn 2015 2014 2014
Sweden 140 136 131
of which collective occupational
pensions 60 58 55
of which endowment insurance 55 54 53
of which occupational pensions 16 15 14
of which other 9 9 9
Baltic countries 4 4 4
Assets under management in the Swedish insurance
business decreased by nearly SEK 9bn in the third
quarter to SEK 140bn due to a declining stock market. A
rising stock market, coupled with net inflows, explain the
year-on-year increase in assets under management as
of 30 September 2015. Assets under management in
the Baltic life insurance business rose by 5 per cent in
local currency, mainly tied to a rising stock market, but
also to net inflows.
Swedbank –Interim report January-September 2015 Page 21 of 57
Insurance related income Jan-Sep Jan-Sep
SEKm 2015 2014 %
Total insurance related income 1 477 1 382 7
Sweden 1 097 1 095 0
of which life insurance 1 057 1 056 0
of which non-life insurance 40 39 4
Baltic countries 380 287 32
of which life insurance 209 130 60
of which non-life insurance 171 157 9
Swedbank’s total insurance related income rose by
7 per cent year-on-year. Income from the Swedish life
insurance business was stable. Increased assets under
management led to a higher result for savings products,
while the risk result rose due to increased volumes and
fewer claims in the group life business. Lower market
interest rates had a negative effect on the result. Income
from Baltic life insurance rose by 54 per cent in local
currency compared with the same period in 2014. The
increase is mainly due to changes in the assumptions to
calculate provisions for guaranteed return products in
traditional life. Income from the Baltic non-life business
increased due to rising premium volumes, while a lower
return on investments due to lower interest rates and
increased claims affected income negatively. The claims
ratio for the period rose to 57.8 per cent (54.8); the level
is in line with the competition but low compared with the
Swedish non-life insurance market.
Pay
Market factors
The payment and card areas are undergoing change
through both increased regulation and deregulation,
which have altered customer behaviour. Many sectors
are seeing more of their sales shift to online and mobile
solutions. At the same time the differences between
brick-and-mortar payments and online and mobile
payments are being erased as more payments are
made in stores using mobile devices. This trend is
reinforced by the growth of mobile identification (Mobile
BankID) in Sweden. The number of mobile
identifications increased by 122 per cent to 50 million in
the third quarter. Shared bank services are also
developing strongly. Due to digitisation, globalisation
and deregulation, the payment area in Swedbank’s
home markets is being challenged by new international
players. A new regulation, for example, requires banks,
at a customer’s request, to make their accounts
available to new payment providers, which is placing
new demands on the banks’ infrastructure. Regulations
in the payment market are also increasing demands on
banks in terms of fees, stability, security and availability.
The purpose of the regulations is to speed up the
transition to digital payments, increase competition and
not least empower customers. This puts increasing
demands on cost efficiency and product development
and has created a wave of consolidation in card
acquiring in Europe.
Operations and market position
Swedbank is a leader in payment and cash
management products in its four home markets. In
Sweden it has a market share of 34 per cent for bank
giro payments. In the Baltic countries its market shares
for domestic payments range between 41 and 59 per
cent and for international payments between 26 and
29 per cent, with the highest share in Estonia.
In Sweden over 80 per cent of store payments are made
by card and market growth is expected to remain good,
with annual growth of about 9 per cent. In Estonia the
corresponding figure is 50 per cent and in Latvia and
Lithuania it is lower but steadily rising. In Estonia annual
growth is 6 per cent, compared with between 13 and 21
per cent in Latvia and Lithuania.
Swedbank issues cards to the public (card issuance)
and acquires card payments from merchants via card
terminals and online payments (card acquiring) in all its
home markets as well as in Norway, Denmark, Finland
and Poland to support the international businesses of its
home market customers. Online payments are acquired
in a number of other EU countries. Swedbank is
Europe’s fifth largest acquirer based on the number of
acquired card purchases. Market shares in the bank’s
home markets range between 60 per cent (Sweden)
and 33 per cent (Latvia). Swedbank is the 11th largest
debit card issuer in Europe, with market shares of
between 45 and 60 per cent.
Payments – development
Number of payments Jan-Sep Jan-Sep
2015 2014 %
International payments (million) 8.6 7.8 10
of which Sweden 3.7 3.5 6
of which Baltic countries 4.9 4.3 14
Domestic payments (million) 1)
671.1 650.3 3
of which Sweden 498.0 481.8 3
of which Baltic countries 173.1 168.5 3
E-services payments (million) 2)
53.7 33.7 59
of which Sweden 35.2 17.0
of which Baltic countries 18.5 16.7 11
Other Digital solutions (million)3)
451.8 222.5
of which Sweden 438.0 211.2
of which Baltic countries 13.8 11.3 22
1)
Domestic payments include salary payments, giro payments, direct
debit payments, internet payments.
2)
E-payments include direct debit payments, Swish, Top-up
3)
Other digital solutions include e-invoices, ID transactions through E-ID
and BankID
The number of payments has continued to increase – a
combination of economic growth and the shift from cash
to cards and e-payments. Swish users among the
Swedish banks now include over 3.3 million private
customers and approximately 30 000 corporate
customers.
Payments Jan-Sep Jan-Sep
Net commission income, SEKm 2015 2014 %
Net commission income 646 707 -9
of which Nordic countries 303 293 3
of which Baltic countries 343 414 -17
Net payment commissions decreased by 9 per cent
year-on-year. In the Nordic region income increased,
mainly due to lower commission expenses. Income in
the Baltic countries decreased due to the euro transition
in Lithuania and a one-off effect of SEK 35m in 2014. In
Estonia and Latvia income increased by 9 and 5 per
cent, respectively.
Swedbank –Interim report January-September 2015 Page 22 of 57
Cards – development
Jan-Sep Jan-Sep
Key ratios, cards 2015 2014 %
Acquired transactions, million 1 662 1 445 15
of which Nordic countries 1 435 1 224 17
of which Baltic countries 227 220 3
Acquired volumes, SEKbn 407 353 15
of which Nordic countries 373 321 16
of which Baltic countries 35 32 9
Issued cards, millon 7.7 7.7 0
of which Nordic countries 4.0 3.9 2
of which Baltic countries 3.8 3.8 -2
Number of card purchases, million 1 072 979 9
of which Nordic countries 785 723 9
of which Baltic countries 287 256 12
Increased card usage is the main reason for transaction
growth in the Nordic region and Baltic countries, along
with declining cash withdrawals. The value of payments
with Swedbank cards in Sweden rose by 8 per cent
year-on-year at the same time that ATM withdrawals
were down 6 per cent. The trend was similar in Estonia.
In Lithuania, where Swedbank is actively encouraging
more card payments, they increased by 22 per cent. In
Latvia the increase was 15 per cent.
The card issuance business saw growth of 10 per cent
in corporate cards in Sweden compared with the first
three quarters of 2014, with increases in both
transaction volume and number of cards. The bank’s
many small corporate customers offer good potential to
increase this business. The number of cards issued to
private customers increased by 2 per cent in Sweden
and decreased slightly in the Baltic countries. E-
payments with Swedbank’s debit cards in Sweden
increased by 17 per cent year-on-year, compared with a
gain of 8 per cent for brick-and-mortar purchases.
To meet the growing demand for mobile e-commerce
and make it easier for customers to use their mobile
phones for more secure online purchases by card,
Swedbank launched Masterpass this autumn.
Masterpass makes payments digital through a copy of
the card in the phone.
The payment regulation reduces the interchange fee
that the acquirer pays the issuer as of December 2015
and increases price competition in the acquiring
business. In Sweden the interchange fee on credit cards
is expected to drop from about 0.9 per cent to 0.3 per
cent of the transaction value, while the change for debit
cards is expected to be minor. The regulation initially
means a slight increase in income, since Swedbank is a
net acquirer and the compensation it pays to card
issuers will be lower. Over time the price pressure in the
acquiring business may increase, however, though the
exact financial impact of the new regulation is difficult to
assess. Interchange fees in the Baltic countries are
expected to be halved on both debit and credit cards,
which will squeeze income for card issuers. Swedbank
is therefore reassessing its pricing. The bank benefits
from being a net acquirer in the Baltic countries as well.
It has also been able to benefit from the wave of
consolidation in the acquiring business by expanding to
neighbouring countries, with especially good results in
Finland.
Card related income Jan-Sep Jan-Sep
SEKm 2015 2014 %
Total income, SEKm 2 513 2 578 -3
of which Nordic countries 1 396 1 332 5
of which Baltic countries 667 609 9
of which Entercard1)
450 638 -29
1)
Swedbank's share of the profit or loss of Entercard.
Total card income decreased by 3 per cent compared
with the same period in 2014 due to one-off income of
SEK 230m in Entercard in 2014. The card business in
the Nordic region, excluding Entercard, grew by 5 per
cent; it grew by 9 per cent in the Baltic countries.
Income in Sweden rose somewhat less than the
transaction volume due to price pressure in the
acquiring business. The increase in the Baltic countries
is due to the issuance of more debit and credit cards
and their increased usage. Card acquiring income rose
somewhat owing to increased card usage in all four
home markets and as a result of new business
internationally and in the Nordic region. At the same
time earnings were squeezed by continued margin
pressure and higher interchange fees.
Swedbank –Interim report January-September 2015 Page 23 of 57
Financial information - contents
Group Page
Income statement, condensed 24
Statement of comprehensive income, condensed 25
Key ratios 25
Balance sheet, condensed 26
Statement of changes in equity, condensed 27
Cash flow statement, condensed 28
Notes
Note 1 Accounting policies 29
Note 2 Critical accounting estimates 29
Note 3 Changes in the Group structure 29
Note 4 Operating segments (business areas) 30
Note 5 Net interest income 32
Note 6 Net commission income 33
Note 7 Net gains and losses on financial items at fair value 34
Note 8 Other expenses 35
Note 9 Credit impairments 35
Note 10 Loans 36
Note 11 Impaired loans etc. 37
Note 12 Assets taken over for protection of claims and cancelled leases 37
Note 13 Credit exposures 37
Note 14 Intangible assets 38
Note 15 Amounts owed to credit institutions 39
Note 16 Deposits and borrowings from the public 39
Note 17 Debt securities in issue 39
Note 18 Derivatives 40
Note 19 Financial instruments carried at fair value 40
Note 20 Pledged collateral 43
Note 21 Offsetting financial assets and liabilities 43
Note 22 Capital adequacy consolidated situation 44
Note 23 Internal capital requirement 47
Note 24 Risks and uncertainties 47
Note 25 Business combinations 48
Note 26 Discontinued operations 49
Note 27 Related-party transactions 50
Note 28 Swedbank’s share 50
Parent company
Income statement, condensed 51
Statement of comprehensive income, condensed 51
Balance sheet, condensed 52
Statement of changes in equity, condensed 53
Cash flow statement, condensed 53
Capital adequacy 54
More detailed information can be found in Swedbank’s fact book, www.swedbank.com/ir, under Financial information and
publications.
Swedbank –Interim report January-September 2015 Page 24 of 57
Income statement, condensed
Group Q3 Q2 Q3 Jan-Sep Jan-Sep
SEKm 2015 2015 % 2014 % 2015 2014 %
Interest income 8 645 8 819 -2 10 343 -16 26 880 31 343 -14
Interest expenses -2 834 -3 115 -9 -4 514 -37 -9 646 -14 510 -34
Net interest income (note 5) 5 811 5 704 2 5 829 0 17 234 16 833 2
Commission income 4 111 4 240 -3 4 150 -1 12 385 12 084 2
Commission expenses -1 375 -1 398 -2 -1 334 3 -4 063 -3 762 8
Net commission income (note 6) 2 736 2 842 -4 2 816 -3 8 322 8 322 0
Net gains and losses on financial items at fair value (note 7) 4 82 -95 799 -99 406 1 917 -79
Insurance premiums 464 504 -8 422 10 1 495 1 386 8
Insurance provisions -301 -337 -11 -299 1 -980 -979 0
Net insurance 163 167 -2 123 33 515 407 27
Share of profit or loss of associates 201 228 -12 221 -9 708 887 -20
Other income 319 292 9 362 -12 982 1 559 -37
Total income 9 234 9 315 -1 10 150 -9 28 167 29 925 -6
Staff costs 2 257 2 375 -5 2 469 -9 7 104 7 807 -9
Other expenses (note 8) 1 458 1 500 -3 1 508 -3 4 475 4 964 -10
Depreciation/amortisation 164 172 -5 187 -12 515 538 -4
Total expenses 3 879 4 047 -4 4 164 -7 12 094 13 309 -9
Profit before impairments 5 355 5 268 2 5 986 -11 16 073 16 616 -3
Impairment of intangible assets (note 14) 254 0 0 254 1
Impairment of tangible assets 16 22 -27 19 -16 53 223 -76
Credit impairments (note 9) 130 6 235 -45 195 165 18
Operating profit 4 955 5 240 -5 5 732 -14 15 571 16 227 -4
Tax expense 1 012 1 538 -34 1 164 -13 3 651 3 301 11
Profit for the period from continuing operations 3 943 3 702 7 4 568 -14 11 920 12 926 -8
Profit for the period from discontinued operations, after tax -11 -32 -66 -2 6 -259
Profit for the period 3 932 3 670 7 4 566 -14 11 926 12 667 -6
Profit for the period attributable to the
shareholders of Swedbank AB 3 928 3 666 7 4 560 -14 11 914 12 652 -6
of which profit for the period from continuing operations 3 939 3 698 7 4 562 -14 11 908 12 911 -8
of which profit for the period from discontinued operations -11 -32 -66 -2 6 -259
Non-controlling interests 4 4 0 6 -33 12 15 -20
of which profit for the period from continuing operations 4 4 0 6 -33 12 15 -20
of which profit for the period from discontinued operations 0 0 0 0 0
SEK
Earnings per share, continuing operations, SEK 3.57 3.34 4.14 10.78 11.72
after dilution 3.52 3.32 4.10 10.68 11.63
Earnings per share, discontinued operations, SEK -0.01 -0.02 0.00 0.01 -0.23
after dilution -0.01 -0.02 0.00 0.01 -0.23
Earnings per share, total operations, SEK 3.56 3.32 4.14 10.79 11.49
after dilution 3.51 3.30 4.10 10.69 11.40
Swedbank –Interim report January-September 2015 Page 25 of 57
Statement of comprehensive income, condensed
Group Q3 Q2 Q3 Jan-Sep Jan-Sep
SEKm 2015 2015 % 2014 % 2015 2014 %
Profit for the period reported via income statement 3 932 3 670 7 4 566 -14 11 926 12 667 -6
Items that will not be reclassified to the income statement
Remeasurements of defined benefit pension plans 755 4 192 -82 -1 090 2 497 -974
Share related to associates 11 122 -91 -28 60 -41
Income tax -168 -949 -82 246 -562 224
Total 598 3 365 -82 -872 1 995 -791
Items that may be reclassified to the income statement
Exchange differences, foreign operations
Gains/losses arising during the period 841 -257 -225 -486 997
Reclassification adjustments to income statement,
profit for the period from discontinued operation 0 0 0 0 508
Hedging of net investments in foreign operations: 0 0 0 0 0
Gains/losses arising during the period -570 242 140 511 -861
Reclassification adjustments to income statement, profit for the
period from discontinued operations 0 0 0 0 -365
Cash flow hedges: 0 0 0 0 0
Gains/losses arising during the period 13 36 -64 69 -81 161 -7
Reclassification adjustments to income statement,
net interest income 7 -3 -23 7 -14
Share of other comprehensive income of associates -93 -24 45 -93 74
Income tax
Income tax 124 -64 -44 -148 190
Reclassification adjustments to income statement, tax -2 1 5 0 -2 3
Reclassification adjustments to income statement, profit for the
period from discontinued operations 0 0 0 0 0 80
Total 320 -69 -33 -50 605
Other comprehensive income for the period, net of tax 918 3 296 -72 -905 1 945 -186
Total comprehensive income for the period 4 850 6 966 -30 3 661 32 13 871 12 481 11
Total comprehensive income attributable to the
shareholders of Swedbank AB 4 846 6 962 -30 3 655 33 13 858 12 466 11
Non-controlling interests 4 4 0 6 -33 13 15 -13
For 2015 income of SEK 1 995m (-791) has been recognised in other comprehensive income after tax, including
remeasurements of defined benefit pension plans in associates. The 2015 income arose primarily because market
interest rates rose from the beginning of the year. For the period as a whole interest rates were volatile and reached
very low levels soon after the first quarter ended. As of 30 September, however, the discount rate, which is used to
calculate the closing pension obligation, was raised to 3.08% from 2.29%. The market’s future inflation expectations
also rose and the inflation assumption was raised to 1.43% from 1.28%. The changes in both of these assumptions
were the main reason why the defined benefit pension obligation decreased. The market value of the assets under
management exceeded the obligation by SEK 134m.
For 2015 an exchange difference of SEK -486m (997) was recognised for the Group's foreign net investments in
subsidiaries. In addition, an exchange rate difference of SEK -94m for the Group's foreign net investments in
associates is included in Share related to associates. The losses related to subsidiaries mainly arose because the
Swedish krona appreciated against the euro. The total loss of SEK 580m is not taxable. Since the large part of the
Group's foreign net assets is hedged against currency risk, a gain of SEK 511m (-861) before tax arose related to
the hedging instruments.
The revaluation of defined benefit pension plans and translation of net investments in foreign operations can be
volatile in certain periods due to movements in the discount rate, inflation and exchange rates.
Key ratios
Group Q3 Q2 Q3 Jan-Sep Jan-Sep
2015 2015 % 2014 % 2015 2014 %
Equity per share, SEK 107.54 103.08 101.08 107.54 101.08
Return on equity, continuing operations, % 13.5 13.5 16.6 13.8 15.9
Return on equity, total operations, % 13.5 13.4 16.6 13.8 15.6
Credit impairment ratio, % 0.04 0.00 0.07 0.02 0.02
Swedbank Interim report third quarter 2015

Weitere ähnliche Inhalte

Was ist angesagt?

CEO presentation of Q2 2008 results
CEO presentation of Q2 2008 resultsCEO presentation of Q2 2008 results
CEO presentation of Q2 2008 resultsSwedbank
 
Roadshow, UBS Nordic Banking Conference Jan Lidén
	Roadshow, UBS Nordic Banking Conference Jan Lidén	Roadshow, UBS Nordic Banking Conference Jan Lidén
Roadshow, UBS Nordic Banking Conference Jan LidénSwedbank
 
Interim report q1 2017
Interim report q1 2017Interim report q1 2017
Interim report q1 2017Swedbank
 
SEB's second quarter 2016 financial results presentation
SEB's second quarter 2016 financial results presentationSEB's second quarter 2016 financial results presentation
SEB's second quarter 2016 financial results presentationSEBgroup
 
Roadshow, London, Jan Liden, CEO and Mikael Inglander, CFO
Roadshow, London, Jan Liden, CEO and Mikael Inglander, CFORoadshow, London, Jan Liden, CEO and Mikael Inglander, CFO
Roadshow, London, Jan Liden, CEO and Mikael Inglander, CFOSwedbank
 
Roadshow, Frankfurt, Johannes Rudbeck
Roadshow, Frankfurt, Johannes RudbeckRoadshow, Frankfurt, Johannes Rudbeck
Roadshow, Frankfurt, Johannes RudbeckSwedbank
 
Roadshow, Jan Lilja, Head of Group Treasury
Roadshow, Jan Lilja, Head of Group TreasuryRoadshow, Jan Lilja, Head of Group Treasury
Roadshow, Jan Lilja, Head of Group TreasurySwedbank
 
Roadshow, Lehman Brothers Global Financial Services Conference
Roadshow, Lehman Brothers Global Financial Services ConferenceRoadshow, Lehman Brothers Global Financial Services Conference
Roadshow, Lehman Brothers Global Financial Services ConferenceSwedbank
 
Swedbank's Interim Report Q2 2013
Swedbank's Interim Report Q2 2013Swedbank's Interim Report Q2 2013
Swedbank's Interim Report Q2 2013Swedbank
 
SEB's second-quarter 2013 results presentation
SEB's second-quarter 2013 results presentationSEB's second-quarter 2013 results presentation
SEB's second-quarter 2013 results presentationSEBgroup
 
SEB's 2014 interim results presentation
SEB's 2014 interim results presentationSEB's 2014 interim results presentation
SEB's 2014 interim results presentationSEBgroup
 
SEB fourth-quarter 2013 results presentation
SEB fourth-quarter 2013 results presentationSEB fourth-quarter 2013 results presentation
SEB fourth-quarter 2013 results presentationSEBgroup
 
CEO presentation of Q1 2008 results
CEO presentation of Q1 2008 resultsCEO presentation of Q1 2008 results
CEO presentation of Q1 2008 resultsSwedbank
 
Roadshow, London, Mikael Inglander CFO
Roadshow, London, Mikael Inglander CFORoadshow, London, Mikael Inglander CFO
Roadshow, London, Mikael Inglander CFOSwedbank
 
Roadshow Netherlands
Roadshow NetherlandsRoadshow Netherlands
Roadshow NetherlandsSwedbank
 
Q2 2008 Transcript Conference Call
Q2 2008 Transcript Conference CallQ2 2008 Transcript Conference Call
Q2 2008 Transcript Conference CallSwedbank
 
Q1 2008 Transcript Conference Call
Q1 2008 Transcript Conference CallQ1 2008 Transcript Conference Call
Q1 2008 Transcript Conference CallSwedbank
 
Roadshow, Öhman Baltic Banking Day, Maris Avotins
Roadshow, Öhman Baltic Banking Day, Maris AvotinsRoadshow, Öhman Baltic Banking Day, Maris Avotins
Roadshow, Öhman Baltic Banking Day, Maris AvotinsSwedbank
 
Roadshow, Tokyo, Mikael Inglander and Anders Ek
Roadshow, Tokyo, Mikael Inglander and Anders EkRoadshow, Tokyo, Mikael Inglander and Anders Ek
Roadshow, Tokyo, Mikael Inglander and Anders EkSwedbank
 

Was ist angesagt? (20)

CEO presentation of Q2 2008 results
CEO presentation of Q2 2008 resultsCEO presentation of Q2 2008 results
CEO presentation of Q2 2008 results
 
Roadshow, UBS Nordic Banking Conference Jan Lidén
	Roadshow, UBS Nordic Banking Conference Jan Lidén	Roadshow, UBS Nordic Banking Conference Jan Lidén
Roadshow, UBS Nordic Banking Conference Jan Lidén
 
Interim report q1 2017
Interim report q1 2017Interim report q1 2017
Interim report q1 2017
 
SEB's second quarter 2016 financial results presentation
SEB's second quarter 2016 financial results presentationSEB's second quarter 2016 financial results presentation
SEB's second quarter 2016 financial results presentation
 
Roadshow, London, Jan Liden, CEO and Mikael Inglander, CFO
Roadshow, London, Jan Liden, CEO and Mikael Inglander, CFORoadshow, London, Jan Liden, CEO and Mikael Inglander, CFO
Roadshow, London, Jan Liden, CEO and Mikael Inglander, CFO
 
Roadshow, Frankfurt, Johannes Rudbeck
Roadshow, Frankfurt, Johannes RudbeckRoadshow, Frankfurt, Johannes Rudbeck
Roadshow, Frankfurt, Johannes Rudbeck
 
Roadshow, Jan Lilja, Head of Group Treasury
Roadshow, Jan Lilja, Head of Group TreasuryRoadshow, Jan Lilja, Head of Group Treasury
Roadshow, Jan Lilja, Head of Group Treasury
 
Roadshow, Lehman Brothers Global Financial Services Conference
Roadshow, Lehman Brothers Global Financial Services ConferenceRoadshow, Lehman Brothers Global Financial Services Conference
Roadshow, Lehman Brothers Global Financial Services Conference
 
Swedbank's Interim Report Q2 2013
Swedbank's Interim Report Q2 2013Swedbank's Interim Report Q2 2013
Swedbank's Interim Report Q2 2013
 
SEB's second-quarter 2013 results presentation
SEB's second-quarter 2013 results presentationSEB's second-quarter 2013 results presentation
SEB's second-quarter 2013 results presentation
 
SEB's 2014 interim results presentation
SEB's 2014 interim results presentationSEB's 2014 interim results presentation
SEB's 2014 interim results presentation
 
SEB fourth-quarter 2013 results presentation
SEB fourth-quarter 2013 results presentationSEB fourth-quarter 2013 results presentation
SEB fourth-quarter 2013 results presentation
 
CEO presentation of Q1 2008 results
CEO presentation of Q1 2008 resultsCEO presentation of Q1 2008 results
CEO presentation of Q1 2008 results
 
Roadshow, London, Mikael Inglander CFO
Roadshow, London, Mikael Inglander CFORoadshow, London, Mikael Inglander CFO
Roadshow, London, Mikael Inglander CFO
 
Roadshow Netherlands
Roadshow NetherlandsRoadshow Netherlands
Roadshow Netherlands
 
Q2 2008 Transcript Conference Call
Q2 2008 Transcript Conference CallQ2 2008 Transcript Conference Call
Q2 2008 Transcript Conference Call
 
Q1 2008 Transcript Conference Call
Q1 2008 Transcript Conference CallQ1 2008 Transcript Conference Call
Q1 2008 Transcript Conference Call
 
Roadshow, Öhman Baltic Banking Day, Maris Avotins
Roadshow, Öhman Baltic Banking Day, Maris AvotinsRoadshow, Öhman Baltic Banking Day, Maris Avotins
Roadshow, Öhman Baltic Banking Day, Maris Avotins
 
Vzrz q1 2014_ifrs_results_eng
Vzrz q1 2014_ifrs_results_engVzrz q1 2014_ifrs_results_eng
Vzrz q1 2014_ifrs_results_eng
 
Roadshow, Tokyo, Mikael Inglander and Anders Ek
Roadshow, Tokyo, Mikael Inglander and Anders EkRoadshow, Tokyo, Mikael Inglander and Anders Ek
Roadshow, Tokyo, Mikael Inglander and Anders Ek
 

Andere mochten auch

Bokslutskommuniké 2015
Bokslutskommuniké 2015Bokslutskommuniké 2015
Bokslutskommuniké 2015Swedbank
 
Swedbank presents the Second Quarter Results 2014
Swedbank presents the Second Quarter Results 2014Swedbank presents the Second Quarter Results 2014
Swedbank presents the Second Quarter Results 2014Swedbank
 
Swedbank företagspresentation, 25 oktober 2016
Swedbank företagspresentation, 25 oktober 2016Swedbank företagspresentation, 25 oktober 2016
Swedbank företagspresentation, 25 oktober 2016Lina Laurin
 
Swedbanks företagspresentation kvartal 1 2013
Swedbanks företagspresentation kvartal 1 2013Swedbanks företagspresentation kvartal 1 2013
Swedbanks företagspresentation kvartal 1 2013Swedbank
 
Swedbank företagspresentation, 25 oktober 2016
Swedbank företagspresentation, 25 oktober 2016Swedbank företagspresentation, 25 oktober 2016
Swedbank företagspresentation, 25 oktober 2016Swedbank
 
Swedbank corporate presentation Q4, 2015
Swedbank corporate presentation Q4, 2015Swedbank corporate presentation Q4, 2015
Swedbank corporate presentation Q4, 2015Swedbank
 
Swedbank corporate presentation, October 25 2016
Swedbank corporate presentation, October 25 2016Swedbank corporate presentation, October 25 2016
Swedbank corporate presentation, October 25 2016Lina Laurin
 
Swedbank företagspresentation kvartal 4,2015
Swedbank företagspresentation kvartal 4,2015Swedbank företagspresentation kvartal 4,2015
Swedbank företagspresentation kvartal 4,2015Swedbank
 

Andere mochten auch (8)

Bokslutskommuniké 2015
Bokslutskommuniké 2015Bokslutskommuniké 2015
Bokslutskommuniké 2015
 
Swedbank presents the Second Quarter Results 2014
Swedbank presents the Second Quarter Results 2014Swedbank presents the Second Quarter Results 2014
Swedbank presents the Second Quarter Results 2014
 
Swedbank företagspresentation, 25 oktober 2016
Swedbank företagspresentation, 25 oktober 2016Swedbank företagspresentation, 25 oktober 2016
Swedbank företagspresentation, 25 oktober 2016
 
Swedbanks företagspresentation kvartal 1 2013
Swedbanks företagspresentation kvartal 1 2013Swedbanks företagspresentation kvartal 1 2013
Swedbanks företagspresentation kvartal 1 2013
 
Swedbank företagspresentation, 25 oktober 2016
Swedbank företagspresentation, 25 oktober 2016Swedbank företagspresentation, 25 oktober 2016
Swedbank företagspresentation, 25 oktober 2016
 
Swedbank corporate presentation Q4, 2015
Swedbank corporate presentation Q4, 2015Swedbank corporate presentation Q4, 2015
Swedbank corporate presentation Q4, 2015
 
Swedbank corporate presentation, October 25 2016
Swedbank corporate presentation, October 25 2016Swedbank corporate presentation, October 25 2016
Swedbank corporate presentation, October 25 2016
 
Swedbank företagspresentation kvartal 4,2015
Swedbank företagspresentation kvartal 4,2015Swedbank företagspresentation kvartal 4,2015
Swedbank företagspresentation kvartal 4,2015
 

Ähnlich wie Swedbank Interim report third quarter 2015

Swedbank Interim Report Q1, 2015
Swedbank Interim Report Q1, 2015Swedbank Interim Report Q1, 2015
Swedbank Interim Report Q1, 2015Swedbank
 
Swedbank's Year-End report 2014
Swedbank's Year-End report 2014Swedbank's Year-End report 2014
Swedbank's Year-End report 2014Swedbank
 
Year end report 2016
Year end report 2016Year end report 2016
Year end report 2016Swedbank
 
Swedbank's Year-end Report 2013
Swedbank's Year-end Report 2013Swedbank's Year-end Report 2013
Swedbank's Year-end Report 2013Swedbank
 
Swedbank's third quarter 2015 results
Swedbank's third quarter 2015 resultsSwedbank's third quarter 2015 results
Swedbank's third quarter 2015 resultsSwedbank
 
SEB's fourth quarter 2015 financial results
SEB's fourth quarter 2015 financial resultsSEB's fourth quarter 2015 financial results
SEB's fourth quarter 2015 financial resultsSEBgroup
 
Presentation Swedbank's First Quarter 2014 results
Presentation  Swedbank's First Quarter 2014 resultsPresentation  Swedbank's First Quarter 2014 results
Presentation Swedbank's First Quarter 2014 resultsSwedbank
 
Swedbank’s first quarter 2015 results - CEO presentation
Swedbank’s first quarter 2015 results - CEO presentationSwedbank’s first quarter 2015 results - CEO presentation
Swedbank’s first quarter 2015 results - CEO presentationSwedbank
 
SEB's third-quarter 2014 results presentation
SEB's third-quarter 2014 results presentationSEB's third-quarter 2014 results presentation
SEB's third-quarter 2014 results presentationSEBgroup
 
080219 Roadshow Boston NY
080219 Roadshow Boston NY080219 Roadshow Boston NY
080219 Roadshow Boston NYSwedbank
 
SEB third quarter 2015 results presentation
SEB third quarter 2015 results presentationSEB third quarter 2015 results presentation
SEB third quarter 2015 results presentationSEBgroup
 
080218 London Mikael Inglander
080218 London Mikael Inglander080218 London Mikael Inglander
080218 London Mikael InglanderSwedbank
 
Q3 2015 Results presentation Husqvarna Group
Q3 2015 Results presentation Husqvarna GroupQ3 2015 Results presentation Husqvarna Group
Q3 2015 Results presentation Husqvarna GroupHusqvarna Group
 
Suominen Corporation results Q2 2017
Suominen Corporation results Q2 2017Suominen Corporation results Q2 2017
Suominen Corporation results Q2 2017Suominen Corporation
 
Q2 2009 Transcript Tel conf
Q2 2009 Transcript Tel confQ2 2009 Transcript Tel conf
Q2 2009 Transcript Tel confSwedbank
 
Investor Presentation Q2 2015
Investor Presentation Q2 2015Investor Presentation Q2 2015
Investor Presentation Q2 2015Bjørn Johan Bye
 
Danske Bank Nordic Bank Seminar, June 2010
Danske Bank Nordic Bank Seminar, June 2010Danske Bank Nordic Bank Seminar, June 2010
Danske Bank Nordic Bank Seminar, June 2010Swedbank
 
Danske bank interimreport q22013
Danske bank interimreport q22013Danske bank interimreport q22013
Danske bank interimreport q22013Frank Ragol
 
Presentation of Swedbank's Q2 2013 Results from the Press Conference
Presentation of Swedbank's Q2 2013 Results from the Press Conference  Presentation of Swedbank's Q2 2013 Results from the Press Conference
Presentation of Swedbank's Q2 2013 Results from the Press Conference Swedbank
 
CEO presentation Q4 2009
CEO presentation Q4 2009CEO presentation Q4 2009
CEO presentation Q4 2009Swedbank
 

Ähnlich wie Swedbank Interim report third quarter 2015 (20)

Swedbank Interim Report Q1, 2015
Swedbank Interim Report Q1, 2015Swedbank Interim Report Q1, 2015
Swedbank Interim Report Q1, 2015
 
Swedbank's Year-End report 2014
Swedbank's Year-End report 2014Swedbank's Year-End report 2014
Swedbank's Year-End report 2014
 
Year end report 2016
Year end report 2016Year end report 2016
Year end report 2016
 
Swedbank's Year-end Report 2013
Swedbank's Year-end Report 2013Swedbank's Year-end Report 2013
Swedbank's Year-end Report 2013
 
Swedbank's third quarter 2015 results
Swedbank's third quarter 2015 resultsSwedbank's third quarter 2015 results
Swedbank's third quarter 2015 results
 
SEB's fourth quarter 2015 financial results
SEB's fourth quarter 2015 financial resultsSEB's fourth quarter 2015 financial results
SEB's fourth quarter 2015 financial results
 
Presentation Swedbank's First Quarter 2014 results
Presentation  Swedbank's First Quarter 2014 resultsPresentation  Swedbank's First Quarter 2014 results
Presentation Swedbank's First Quarter 2014 results
 
Swedbank’s first quarter 2015 results - CEO presentation
Swedbank’s first quarter 2015 results - CEO presentationSwedbank’s first quarter 2015 results - CEO presentation
Swedbank’s first quarter 2015 results - CEO presentation
 
SEB's third-quarter 2014 results presentation
SEB's third-quarter 2014 results presentationSEB's third-quarter 2014 results presentation
SEB's third-quarter 2014 results presentation
 
080219 Roadshow Boston NY
080219 Roadshow Boston NY080219 Roadshow Boston NY
080219 Roadshow Boston NY
 
SEB third quarter 2015 results presentation
SEB third quarter 2015 results presentationSEB third quarter 2015 results presentation
SEB third quarter 2015 results presentation
 
080218 London Mikael Inglander
080218 London Mikael Inglander080218 London Mikael Inglander
080218 London Mikael Inglander
 
Q3 2015 Results presentation Husqvarna Group
Q3 2015 Results presentation Husqvarna GroupQ3 2015 Results presentation Husqvarna Group
Q3 2015 Results presentation Husqvarna Group
 
Suominen Corporation results Q2 2017
Suominen Corporation results Q2 2017Suominen Corporation results Q2 2017
Suominen Corporation results Q2 2017
 
Q2 2009 Transcript Tel conf
Q2 2009 Transcript Tel confQ2 2009 Transcript Tel conf
Q2 2009 Transcript Tel conf
 
Investor Presentation Q2 2015
Investor Presentation Q2 2015Investor Presentation Q2 2015
Investor Presentation Q2 2015
 
Danske Bank Nordic Bank Seminar, June 2010
Danske Bank Nordic Bank Seminar, June 2010Danske Bank Nordic Bank Seminar, June 2010
Danske Bank Nordic Bank Seminar, June 2010
 
Danske bank interimreport q22013
Danske bank interimreport q22013Danske bank interimreport q22013
Danske bank interimreport q22013
 
Presentation of Swedbank's Q2 2013 Results from the Press Conference
Presentation of Swedbank's Q2 2013 Results from the Press Conference  Presentation of Swedbank's Q2 2013 Results from the Press Conference
Presentation of Swedbank's Q2 2013 Results from the Press Conference
 
CEO presentation Q4 2009
CEO presentation Q4 2009CEO presentation Q4 2009
CEO presentation Q4 2009
 

Mehr von Swedbank

Swedbank corporate presentation April 25 2017
Swedbank corporate presentation April 25 2017Swedbank corporate presentation April 25 2017
Swedbank corporate presentation April 25 2017Swedbank
 
Swedbank foretagspresentation 25 april 2017
Swedbank foretagspresentation 25 april 2017Swedbank foretagspresentation 25 april 2017
Swedbank foretagspresentation 25 april 2017Swedbank
 
Delårsrapport kv1 2017
Delårsrapport kv1 2017Delårsrapport kv1 2017
Delårsrapport kv1 2017Swedbank
 
Bokslutskommuniké 2016
Bokslutskommuniké 2016Bokslutskommuniké 2016
Bokslutskommuniké 2016Swedbank
 
Swedbank företagspresentation, 2 februari 2017
Swedbank företagspresentation, 2 februari 2017Swedbank företagspresentation, 2 februari 2017
Swedbank företagspresentation, 2 februari 2017Swedbank
 
Swedbank corporate presentation, February 2 2017
Swedbank corporate presentation, February 2 2017Swedbank corporate presentation, February 2 2017
Swedbank corporate presentation, February 2 2017Swedbank
 
Swedbank Corporate Presentation, October 25 2016
Swedbank Corporate Presentation, October 25 2016Swedbank Corporate Presentation, October 25 2016
Swedbank Corporate Presentation, October 25 2016Swedbank
 
Swedbank Corporate Presentation, June 30 2016
Swedbank Corporate Presentation, June 30 2016Swedbank Corporate Presentation, June 30 2016
Swedbank Corporate Presentation, June 30 2016Swedbank
 
Swedbank företagspresentation, 30 juni 2016
Swedbank företagspresentation, 30 juni 2016Swedbank företagspresentation, 30 juni 2016
Swedbank företagspresentation, 30 juni 2016Swedbank
 
Swedbank corporate presentation Q1, 2016
Swedbank corporate presentation Q1, 2016Swedbank corporate presentation Q1, 2016
Swedbank corporate presentation Q1, 2016Swedbank
 
Swedbank företagspresentation kvartal 1, 2016.
Swedbank företagspresentation kvartal 1, 2016.Swedbank företagspresentation kvartal 1, 2016.
Swedbank företagspresentation kvartal 1, 2016.Swedbank
 
Swedbank Företagspresentation, September 2015
Swedbank Företagspresentation, September 2015Swedbank Företagspresentation, September 2015
Swedbank Företagspresentation, September 2015Swedbank
 
Swedbank Corporate Presentation, September 2015
Swedbank Corporate Presentation, September 2015Swedbank Corporate Presentation, September 2015
Swedbank Corporate Presentation, September 2015Swedbank
 
Swedbank delårsrapport tredje kvartalet 2015
Swedbank delårsrapport tredje kvartalet 2015Swedbank delårsrapport tredje kvartalet 2015
Swedbank delårsrapport tredje kvartalet 2015Swedbank
 
Kvartalsrapport andra kvartalet 2015
Kvartalsrapport andra kvartalet 2015Kvartalsrapport andra kvartalet 2015
Kvartalsrapport andra kvartalet 2015Swedbank
 
Corporate Presentation July 2015
Corporate Presentation July 2015Corporate Presentation July 2015
Corporate Presentation July 2015Swedbank
 
Företagspresentation Q2 2015
Företagspresentation Q2 2015Företagspresentation Q2 2015
Företagspresentation Q2 2015Swedbank
 
Swedbank Delårsrapport Kvartal 1, 2015
Swedbank Delårsrapport Kvartal 1, 2015Swedbank Delårsrapport Kvartal 1, 2015
Swedbank Delårsrapport Kvartal 1, 2015Swedbank
 
Swedbank Företagspresentation, 31 mars, 2015
Swedbank Företagspresentation, 31 mars, 2015Swedbank Företagspresentation, 31 mars, 2015
Swedbank Företagspresentation, 31 mars, 2015Swedbank
 

Mehr von Swedbank (19)

Swedbank corporate presentation April 25 2017
Swedbank corporate presentation April 25 2017Swedbank corporate presentation April 25 2017
Swedbank corporate presentation April 25 2017
 
Swedbank foretagspresentation 25 april 2017
Swedbank foretagspresentation 25 april 2017Swedbank foretagspresentation 25 april 2017
Swedbank foretagspresentation 25 april 2017
 
Delårsrapport kv1 2017
Delårsrapport kv1 2017Delårsrapport kv1 2017
Delårsrapport kv1 2017
 
Bokslutskommuniké 2016
Bokslutskommuniké 2016Bokslutskommuniké 2016
Bokslutskommuniké 2016
 
Swedbank företagspresentation, 2 februari 2017
Swedbank företagspresentation, 2 februari 2017Swedbank företagspresentation, 2 februari 2017
Swedbank företagspresentation, 2 februari 2017
 
Swedbank corporate presentation, February 2 2017
Swedbank corporate presentation, February 2 2017Swedbank corporate presentation, February 2 2017
Swedbank corporate presentation, February 2 2017
 
Swedbank Corporate Presentation, October 25 2016
Swedbank Corporate Presentation, October 25 2016Swedbank Corporate Presentation, October 25 2016
Swedbank Corporate Presentation, October 25 2016
 
Swedbank Corporate Presentation, June 30 2016
Swedbank Corporate Presentation, June 30 2016Swedbank Corporate Presentation, June 30 2016
Swedbank Corporate Presentation, June 30 2016
 
Swedbank företagspresentation, 30 juni 2016
Swedbank företagspresentation, 30 juni 2016Swedbank företagspresentation, 30 juni 2016
Swedbank företagspresentation, 30 juni 2016
 
Swedbank corporate presentation Q1, 2016
Swedbank corporate presentation Q1, 2016Swedbank corporate presentation Q1, 2016
Swedbank corporate presentation Q1, 2016
 
Swedbank företagspresentation kvartal 1, 2016.
Swedbank företagspresentation kvartal 1, 2016.Swedbank företagspresentation kvartal 1, 2016.
Swedbank företagspresentation kvartal 1, 2016.
 
Swedbank Företagspresentation, September 2015
Swedbank Företagspresentation, September 2015Swedbank Företagspresentation, September 2015
Swedbank Företagspresentation, September 2015
 
Swedbank Corporate Presentation, September 2015
Swedbank Corporate Presentation, September 2015Swedbank Corporate Presentation, September 2015
Swedbank Corporate Presentation, September 2015
 
Swedbank delårsrapport tredje kvartalet 2015
Swedbank delårsrapport tredje kvartalet 2015Swedbank delårsrapport tredje kvartalet 2015
Swedbank delårsrapport tredje kvartalet 2015
 
Kvartalsrapport andra kvartalet 2015
Kvartalsrapport andra kvartalet 2015Kvartalsrapport andra kvartalet 2015
Kvartalsrapport andra kvartalet 2015
 
Corporate Presentation July 2015
Corporate Presentation July 2015Corporate Presentation July 2015
Corporate Presentation July 2015
 
Företagspresentation Q2 2015
Företagspresentation Q2 2015Företagspresentation Q2 2015
Företagspresentation Q2 2015
 
Swedbank Delårsrapport Kvartal 1, 2015
Swedbank Delårsrapport Kvartal 1, 2015Swedbank Delårsrapport Kvartal 1, 2015
Swedbank Delårsrapport Kvartal 1, 2015
 
Swedbank Företagspresentation, 31 mars, 2015
Swedbank Företagspresentation, 31 mars, 2015Swedbank Företagspresentation, 31 mars, 2015
Swedbank Företagspresentation, 31 mars, 2015
 

Kürzlich hochgeladen

《加州大学圣克鲁兹分校学位证书复制》Q微信741003700美国学历疑难问题指南|挂科被加州大学圣克鲁兹分校劝退没有毕业证怎么办?《UCSC毕业证购买|加...
《加州大学圣克鲁兹分校学位证书复制》Q微信741003700美国学历疑难问题指南|挂科被加州大学圣克鲁兹分校劝退没有毕业证怎么办?《UCSC毕业证购买|加...《加州大学圣克鲁兹分校学位证书复制》Q微信741003700美国学历疑难问题指南|挂科被加州大学圣克鲁兹分校劝退没有毕业证怎么办?《UCSC毕业证购买|加...
《加州大学圣克鲁兹分校学位证书复制》Q微信741003700美国学历疑难问题指南|挂科被加州大学圣克鲁兹分校劝退没有毕业证怎么办?《UCSC毕业证购买|加...wyqazy
 
Corporate Presentation Probe May 2024.pdf
Corporate Presentation Probe May 2024.pdfCorporate Presentation Probe May 2024.pdf
Corporate Presentation Probe May 2024.pdfProbe Gold
 
VIP Kolkata Call Girl Entally 👉 8250192130 Available With Room
VIP Kolkata Call Girl Entally 👉 8250192130  Available With RoomVIP Kolkata Call Girl Entally 👉 8250192130  Available With Room
VIP Kolkata Call Girl Entally 👉 8250192130 Available With Roomdivyansh0kumar0
 
VIP 7001035870 Find & Meet Hyderabad Call Girls Abids high-profile Call Girl
VIP 7001035870 Find & Meet Hyderabad Call Girls Abids high-profile Call GirlVIP 7001035870 Find & Meet Hyderabad Call Girls Abids high-profile Call Girl
VIP 7001035870 Find & Meet Hyderabad Call Girls Abids high-profile Call Girladitipandeya
 
Malad Escorts, (Pooja 09892124323), Malad Call Girls Service
Malad Escorts, (Pooja 09892124323), Malad Call Girls ServiceMalad Escorts, (Pooja 09892124323), Malad Call Girls Service
Malad Escorts, (Pooja 09892124323), Malad Call Girls ServicePooja Nehwal
 
Sustainability Leadership, April 26 2024
Sustainability Leadership, April 26 2024Sustainability Leadership, April 26 2024
Sustainability Leadership, April 26 2024TeckResourcesLtd
 
Collective Mining | Corporate Presentation - April 2024
Collective Mining | Corporate Presentation - April 2024Collective Mining | Corporate Presentation - April 2024
Collective Mining | Corporate Presentation - April 2024CollectiveMining1
 
slideshare Call girls Noida Escorts 9999965857 henakhan
slideshare Call girls Noida Escorts 9999965857 henakhanslideshare Call girls Noida Escorts 9999965857 henakhan
slideshare Call girls Noida Escorts 9999965857 henakhanhanshkumar9870
 
VIP Amritsar Call Girl 7001035870 Enjoy Call Girls With Our Escorts
VIP Amritsar Call Girl 7001035870 Enjoy Call Girls With Our EscortsVIP Amritsar Call Girl 7001035870 Enjoy Call Girls With Our Escorts
VIP Amritsar Call Girl 7001035870 Enjoy Call Girls With Our Escortssonatiwari757
 
Call Girl Kolkata Sia 🤌 8250192130 🚀 Vip Call Girls Kolkata
Call Girl Kolkata Sia 🤌  8250192130 🚀 Vip Call Girls KolkataCall Girl Kolkata Sia 🤌  8250192130 🚀 Vip Call Girls Kolkata
Call Girl Kolkata Sia 🤌 8250192130 🚀 Vip Call Girls Kolkataanamikaraghav4
 
VIP 7001035870 Find & Meet Hyderabad Call Girls Miyapur high-profile Call Girl
VIP 7001035870 Find & Meet Hyderabad Call Girls Miyapur high-profile Call GirlVIP 7001035870 Find & Meet Hyderabad Call Girls Miyapur high-profile Call Girl
VIP 7001035870 Find & Meet Hyderabad Call Girls Miyapur high-profile Call Girladitipandeya
 
VIP Kolkata Call Girl Rishra 👉 8250192130 Available With Room
VIP Kolkata Call Girl Rishra 👉 8250192130  Available With RoomVIP Kolkata Call Girl Rishra 👉 8250192130  Available With Room
VIP Kolkata Call Girl Rishra 👉 8250192130 Available With Roomdivyansh0kumar0
 
CALL ON ➥8923113531 🔝Call Girls Vineet Khand Lucknow best Night Fun service 🧦
CALL ON ➥8923113531 🔝Call Girls Vineet Khand Lucknow best Night Fun service  🧦CALL ON ➥8923113531 🔝Call Girls Vineet Khand Lucknow best Night Fun service  🧦
CALL ON ➥8923113531 🔝Call Girls Vineet Khand Lucknow best Night Fun service 🧦anilsa9823
 
VIP 7001035870 Find & Meet Hyderabad Call Girls Shamshabad high-profile Call ...
VIP 7001035870 Find & Meet Hyderabad Call Girls Shamshabad high-profile Call ...VIP 7001035870 Find & Meet Hyderabad Call Girls Shamshabad high-profile Call ...
VIP 7001035870 Find & Meet Hyderabad Call Girls Shamshabad high-profile Call ...aditipandeya
 

Kürzlich hochgeladen (20)

《加州大学圣克鲁兹分校学位证书复制》Q微信741003700美国学历疑难问题指南|挂科被加州大学圣克鲁兹分校劝退没有毕业证怎么办?《UCSC毕业证购买|加...
《加州大学圣克鲁兹分校学位证书复制》Q微信741003700美国学历疑难问题指南|挂科被加州大学圣克鲁兹分校劝退没有毕业证怎么办?《UCSC毕业证购买|加...《加州大学圣克鲁兹分校学位证书复制》Q微信741003700美国学历疑难问题指南|挂科被加州大学圣克鲁兹分校劝退没有毕业证怎么办?《UCSC毕业证购买|加...
《加州大学圣克鲁兹分校学位证书复制》Q微信741003700美国学历疑难问题指南|挂科被加州大学圣克鲁兹分校劝退没有毕业证怎么办?《UCSC毕业证购买|加...
 
Corporate Presentation Probe May 2024.pdf
Corporate Presentation Probe May 2024.pdfCorporate Presentation Probe May 2024.pdf
Corporate Presentation Probe May 2024.pdf
 
VIP Kolkata Call Girl Entally 👉 8250192130 Available With Room
VIP Kolkata Call Girl Entally 👉 8250192130  Available With RoomVIP Kolkata Call Girl Entally 👉 8250192130  Available With Room
VIP Kolkata Call Girl Entally 👉 8250192130 Available With Room
 
Call Girls 🫤 Nehru Place ➡️ 9999965857 ➡️ Delhi 🫦 Russian Escorts FULL ENJOY
Call Girls 🫤 Nehru Place ➡️ 9999965857  ➡️ Delhi 🫦  Russian Escorts FULL ENJOYCall Girls 🫤 Nehru Place ➡️ 9999965857  ➡️ Delhi 🫦  Russian Escorts FULL ENJOY
Call Girls 🫤 Nehru Place ➡️ 9999965857 ➡️ Delhi 🫦 Russian Escorts FULL ENJOY
 
VIP 7001035870 Find & Meet Hyderabad Call Girls Abids high-profile Call Girl
VIP 7001035870 Find & Meet Hyderabad Call Girls Abids high-profile Call GirlVIP 7001035870 Find & Meet Hyderabad Call Girls Abids high-profile Call Girl
VIP 7001035870 Find & Meet Hyderabad Call Girls Abids high-profile Call Girl
 
Call Girls In Kalkaji 📱 9999965857 🤩 Delhi 🫦 HOT AND SEXY VVIP 🍎 SERVICE
Call Girls In Kalkaji 📱  9999965857  🤩 Delhi 🫦 HOT AND SEXY VVIP 🍎 SERVICECall Girls In Kalkaji 📱  9999965857  🤩 Delhi 🫦 HOT AND SEXY VVIP 🍎 SERVICE
Call Girls In Kalkaji 📱 9999965857 🤩 Delhi 🫦 HOT AND SEXY VVIP 🍎 SERVICE
 
Malad Escorts, (Pooja 09892124323), Malad Call Girls Service
Malad Escorts, (Pooja 09892124323), Malad Call Girls ServiceMalad Escorts, (Pooja 09892124323), Malad Call Girls Service
Malad Escorts, (Pooja 09892124323), Malad Call Girls Service
 
Sustainability Leadership, April 26 2024
Sustainability Leadership, April 26 2024Sustainability Leadership, April 26 2024
Sustainability Leadership, April 26 2024
 
Collective Mining | Corporate Presentation - April 2024
Collective Mining | Corporate Presentation - April 2024Collective Mining | Corporate Presentation - April 2024
Collective Mining | Corporate Presentation - April 2024
 
slideshare Call girls Noida Escorts 9999965857 henakhan
slideshare Call girls Noida Escorts 9999965857 henakhanslideshare Call girls Noida Escorts 9999965857 henakhan
slideshare Call girls Noida Escorts 9999965857 henakhan
 
VIP Amritsar Call Girl 7001035870 Enjoy Call Girls With Our Escorts
VIP Amritsar Call Girl 7001035870 Enjoy Call Girls With Our EscortsVIP Amritsar Call Girl 7001035870 Enjoy Call Girls With Our Escorts
VIP Amritsar Call Girl 7001035870 Enjoy Call Girls With Our Escorts
 
Call Girl Kolkata Sia 🤌 8250192130 🚀 Vip Call Girls Kolkata
Call Girl Kolkata Sia 🤌  8250192130 🚀 Vip Call Girls KolkataCall Girl Kolkata Sia 🤌  8250192130 🚀 Vip Call Girls Kolkata
Call Girl Kolkata Sia 🤌 8250192130 🚀 Vip Call Girls Kolkata
 
@9999965857 🫦 Sexy Desi Call Girls Karol Bagh 💓 High Profile Escorts Delhi 🫶
@9999965857 🫦 Sexy Desi Call Girls Karol Bagh 💓 High Profile Escorts Delhi 🫶@9999965857 🫦 Sexy Desi Call Girls Karol Bagh 💓 High Profile Escorts Delhi 🫶
@9999965857 🫦 Sexy Desi Call Girls Karol Bagh 💓 High Profile Escorts Delhi 🫶
 
Vip Call Girls Vasant Kunj ➡️ Delhi ➡️ 9999965857 No Advance 24HRS Live
Vip Call Girls Vasant Kunj ➡️ Delhi ➡️ 9999965857 No Advance 24HRS LiveVip Call Girls Vasant Kunj ➡️ Delhi ➡️ 9999965857 No Advance 24HRS Live
Vip Call Girls Vasant Kunj ➡️ Delhi ➡️ 9999965857 No Advance 24HRS Live
 
(👉゚9999965857 ゚)👉 VIP Call Girls Friends Colony 👉 Delhi 👈 : 9999 Cash Payment...
(👉゚9999965857 ゚)👉 VIP Call Girls Friends Colony 👉 Delhi 👈 : 9999 Cash Payment...(👉゚9999965857 ゚)👉 VIP Call Girls Friends Colony 👉 Delhi 👈 : 9999 Cash Payment...
(👉゚9999965857 ゚)👉 VIP Call Girls Friends Colony 👉 Delhi 👈 : 9999 Cash Payment...
 
VIP 7001035870 Find & Meet Hyderabad Call Girls Miyapur high-profile Call Girl
VIP 7001035870 Find & Meet Hyderabad Call Girls Miyapur high-profile Call GirlVIP 7001035870 Find & Meet Hyderabad Call Girls Miyapur high-profile Call Girl
VIP 7001035870 Find & Meet Hyderabad Call Girls Miyapur high-profile Call Girl
 
VIP Kolkata Call Girl Rishra 👉 8250192130 Available With Room
VIP Kolkata Call Girl Rishra 👉 8250192130  Available With RoomVIP Kolkata Call Girl Rishra 👉 8250192130  Available With Room
VIP Kolkata Call Girl Rishra 👉 8250192130 Available With Room
 
CALL ON ➥8923113531 🔝Call Girls Vineet Khand Lucknow best Night Fun service 🧦
CALL ON ➥8923113531 🔝Call Girls Vineet Khand Lucknow best Night Fun service  🧦CALL ON ➥8923113531 🔝Call Girls Vineet Khand Lucknow best Night Fun service  🧦
CALL ON ➥8923113531 🔝Call Girls Vineet Khand Lucknow best Night Fun service 🧦
 
@9999965857 🫦 Sexy Desi Call Girls Vaishali 💓 High Profile Escorts Delhi 🫶
@9999965857 🫦 Sexy Desi Call Girls Vaishali 💓 High Profile Escorts Delhi 🫶@9999965857 🫦 Sexy Desi Call Girls Vaishali 💓 High Profile Escorts Delhi 🫶
@9999965857 🫦 Sexy Desi Call Girls Vaishali 💓 High Profile Escorts Delhi 🫶
 
VIP 7001035870 Find & Meet Hyderabad Call Girls Shamshabad high-profile Call ...
VIP 7001035870 Find & Meet Hyderabad Call Girls Shamshabad high-profile Call ...VIP 7001035870 Find & Meet Hyderabad Call Girls Shamshabad high-profile Call ...
VIP 7001035870 Find & Meet Hyderabad Call Girls Shamshabad high-profile Call ...
 

Swedbank Interim report third quarter 2015

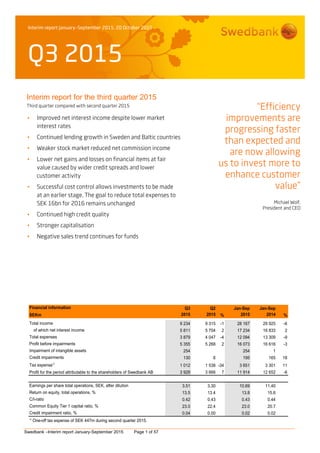
  • 1. Interim report January–September 2015, 20 October 2015 Q3 2015 Swedbank –Interim report January-September 2015 Page 1 of 57 Interim report for the third quarter 2015 Third quarter compared with second quarter 2015  Improved net interest income despite lower market interest rates  Continued lending growth in Sweden and Baltic countries  Weaker stock market reduced net commission income  Lower net gains and losses on financial items at fair value caused by wider credit spreads and lower customer activity  Successful cost control allows investments to be made at an earlier stage. The goal to reduce total expenses to SEK 16bn for 2016 remains unchanged  Continued high credit quality  Stronger capitalisation  Negative sales trend continues for funds “Efficiency improvements are progressing faster than expected and are now allowing us to invest more to enhance customer value” Michael Wolf, President and CEO Financial information Q3 Q2 Jan-Sep Jan-Sep SEKm 2015 2015 % 2015 2014 % Total income 9 234 9 315 -1 28 167 29 925 -6 of which net interest income 5 811 5 704 2 17 234 16 833 2 Total expenses 3 879 4 047 -4 12 094 13 309 -9 Profit before impairments 5 355 5 268 2 16 073 16 616 -3 Impairment of intangible assets 254 0 254 1 Credit impairments 130 6 195 165 18 Tax expense1) 1 012 1 538 -34 3 651 3 301 11 Profit for the period attributable to the shareholders of Swedbank AB 3 928 3 666 7 11 914 12 652 -6 Earnings per share total operations, SEK, after dilution 3.51 3.30 10.69 11.40 Return on equity, total operations, % 13.5 13.4 13.8 15.6 C/I-ratio 0.42 0.43 0.43 0.44 Common Equity Tier 1 capital ratio, % 23.0 22.4 23.0 20.7 Credit impairment ratio, % 0.04 0.00 0.02 0.02 1) One-off tax expense of SEK 447m during second quarter 2015.
  • 2. Swedbank –Interim report January-September 2015 Page 2 of 57 CEO Comment Increased concerns about global economy Growth prospects in China’s economy were called into question in the third quarter, which led to revised global growth projections, falling commodity prices and uncertainty in the securities markets. Concern surrounding the political situation in Greece continued as well. The refugee crisis affects us deeply. All of us can help. We at Swedbank are currently working with colleagues in the industry and the authorities to find solutions that will make it easier for newly arrived persons to gain access to banking services. Among the challenges are language difficulties and a lack of personal identification, as well as laws that require us to know our customers. The Riksbank’s repo rate cut of an additional 10 basis points could exacerbate the imbalances in the economy. House prices continue to rise and the housing shortage is growing – not least due to population growth. To take advantage of the economic opportunities that a growing population offers, more resources should be devoted to resolving the acute housing shortage. We need new infrastructure at the same time that laws and regulations need to be re-evaluated to simplify new construction. It is positive, however, to see that new construction has increased this year. At Swedbank we are ready to help finance these initiatives. At the same time we remain focused on our customers’ financial security and are making sure that they have sufficient buffers in their personal finances to handle unforeseen events. We welcome new customers Market volatility and greater uncertainty led to slightly lower customer activity during the quarter, which was marked by a sense of hesitancy. Lending growth remained stable in the Swedish business. In the Baltic countries the positive trend continued and we saw another quarter of lending growth. Through the agreement to acquire Danske Bank’s retail banking business, we are strengthening our position mainly in Lithuania, and in Latvia, and gain a total of 127 000 new customers. The integration of Sparbanken Öresund took a big step forward in October when around 100 000 customers were transferred to Swedbank’s system. Our new customers now have access to a broader product range and a better mobile bank and internet bank. The transition has been an important priority this year, and I am proud of the outcome, which has been made possible by the hard work and fantastic commitment of our employees. I would like to welcome our new customers to Swedbank. Improved customer value – our highest priority The results of our annual customer satisfaction survey were published during the quarter. While Swedbank’s results are moving in the right direction we have a lot left to do as regards Swedish retail customers. It is positive that customers continue to appreciate our digital services. For the second quarter in a row Swedbank was ranked as having the “best customer service in social media” among global banks. And in the Baltic countries we ranked fourth among “Most Loved Brands” for the second consecutive year. The three top brands were Google, Facebook and Gmail. The service our customers demand is closely tied to the functionality of our digital services. Dependability and security as well as the new challenges that digitisation poses are therefore priority issues when we examine operational risks. Many of our IT investments are focused on ensuring functionality and raising the level of service. Stable result in uncertain environment The financial results for the quarter were stable. Increased lending volumes helped to offset the pressure on earnings from lower interest rates. Credit impairments remained very low. The low risk in the bank has led to lower funding costs. During the first half-year we were more active in our long-term funding and capitalised on favourable market conditions. The issuance pace was maintained in the third quarter despite somewhat more turbulent capital markets. Cost control remains very good. This puts us in a better position to enhance our customer offering and give employees opportunities to develop. We have also been able to bring forward several investments. Our financial position has never been stronger. We are in a fantastic position to meet new challenges and opportunities, providing us all with inspiration and motivation. There is a lot of positive energy in the organisation to strengthen customer value. Michael Wolf President and CEO
  • 3. Swedbank –Interim report January-September 2015 Page 3 of 57 Table of contents Page Financial summary 4 Overview 5 Market 5 Third quarter 2015 compared with second quarter 2015 5 Result 5 January – September 2015 compared with January – September 2014 6 Result 6 Volume trend 7 Credit and asset quality 7 Operational risks 8 Funding and liquidity 8 Ratings 8 Capital and capital adequacy 8 Other events 9 Events after 30 September 9 Business segments Swedish Banking 10 Baltic Banking 12 Large Corporates & Institutions 14 Group Functions & Other 16 Eliminations 17 Product areas 18 Financial information Group Income statement, condensed 24 Statement of comprehensive income, condensed 25 Key ratios 25 Balance sheet, condensed 26 Statement of changes in equity, condensed 27 Cash flow statement, condensed 28 Notes 29 Parent company 51 Signatures of the Board of Directors and the President 56 Review report 56 Contact information 57 More detailed information can be found in Swedbank’s fact book, www.swedbank.com/ir, under Financial information and publications.
  • 4. Swedbank –Interim report January-September 2015 Page 4 of 57 Financial summary Income statement Q3 Q2 Q3 Jan-Sep Jan-Sep SEKm 2015 2015 % 2014 % 2015 2014 % Net interest income 5 811 5 704 2 5 829 0 17 234 16 833 2 Net commission income 2 736 2 842 -4 2 816 -3 8 322 8 322 0 Net gains and losses on financial items at fair value 4 82 -95 799 -99 406 1 917 -79 Other income 683 687 -1 706 -3 2 205 2 853 -23 Total income 9 234 9 315 -1 10 150 -9 28 167 29 925 -6 Staff costs 2 257 2 375 -5 2 469 -9 7 104 7 807 -9 Other expenses 1 622 1 672 -3 1 695 -4 4 990 5 502 -9 Total expenses 3 879 4 047 -4 4 164 -7 12 094 13 309 -9 Profit before impairments 5 355 5 268 2 5 986 -11 16 073 16 616 -3 Impairment of intangible assets 254 0 0 254 1 Impairment of tangible assets 16 22 -27 19 -16 53 223 -76 Credit impairments 130 6 235 -45 195 165 18 Operating profit 4 955 5 240 -5 5 732 -14 15 571 16 227 -4 Tax expense 1 012 1 538 -34 1 164 -13 3 651 3 301 11 Profit for the period from continuing operations 3 943 3 702 7 4 568 -14 11 920 12 926 -8 Profit for the period from discontinued operations, after tax -11 -32 -66 -2 6 -259 Profit for the period 3 932 3 670 7 4 566 -14 11 926 12 667 -6 Profit for the period attributable to the shareholders of Swedbank AB 3 928 3 666 7 4 560 -14 11 914 12 652 -6 Q3 Q2 Q3 Jan-Sep Jan-Sep Key ratios and data per share 2015 2015 2014 2015 2014 Return on equity, continuing operations, % 13.5 13.5 16.6 13.8 15.9 Return on equity, total operations, % 13.5 13.4 16.6 13.8 15.6 Earnings per share before dilution, continuing operations, SEK 1) 3.57 3.34 4.14 10.78 11.72 Earnings per share after dilution, continuing operations, SEK 1) 3.52 3.32 4.10 10.68 11.63 Cost/income ratio 0.42 0.43 0.41 0.43 0.44 Equity per share, SEK 1) 107.5 103.1 101.1 107.5 101.1 Loan/deposit ratio, % 187 172 193 187 193 Common Equity Tier 1 capital ratio, % 23.0 22.4 20.7 23.0 20.7 Tier 1 capital ratio, % 25.7 25.0 21.9 25.7 21.9 Total capital ratio, % 28.9 28.2 24.9 28.9 24.9 Credit impairment ratio, % 0.04 0.00 0.07 0.02 0.02 Share of impaired loans, gross, % 0.35 0.36 0.47 0.35 0.47 Total provision ratio for impaired loans, % 58 55 55 58 55 Liquidity coverage ratio (LCR), % 135 136 132 135 132 Net stable funding ratio (NSFR), % 2) 104 101 102 104 102 Balance sheet data 30 Sep 31 Dec 30 Sep SEKbn 2015 2014 % 2014 % Loans to the public, excluding the Swedish National Debt Office and repurchase agreements 1 370 1 325 3 1 287 6 Deposits and borrowings from the public, excluding the Swedish National Debt Office and repurchase agreements 734 661 11 667 10 Shareholders' equity 119 117 1 111 7 Total assets 2 312 2 121 9 2 078 11 Risk exposure amount 404 414 -2 410 -1 1) The number of shares and calculation of earnings per share are specified on page 50. 2) NSFR according to Swedbank’s best understanding of the Basel Committee’s new recommendation (BCBS295). The key ratios are based on profit and shareholders’ equity attributable to shareholders of Swedbank. Key ratios and text comments regarding lending and deposits relate to volumes excluding Swedish National Debt Office and repos.
  • 5. Swedbank –Interim report January-September 2015 Page 5 of 57 Overview Market The US economy continued to strengthen, mainly driven by a stronger labour market, lower energy prices and low interest rates. However, the Federal Reserve decided not to raise its benchmark rate in September due to growing uncertainty about the global economy, led by China. Commodity prices fell during the summer and early autumn, which dampened global inflation. The European economy continued to improve, not least due to the ECB’s expansionary monetary policy. The Swedish economy grew by 3.3 per cent in the second quarter, driven by consumption and housing investment. The Riksbank’s expansionary monetary policy and low interest rates with rising house prices, as well as a housing shortage, helped to further accelerate lending towards households in the third quarter. Retail sales slowed during the summer. Households became more pessimistic about the Swedish economy, while businesses became more optimistic about economic prospects. In July the Riksbank cut the repo rate by 10 basis points to -0.35 per cent, but kept it unchanged in September at the same time that the underlying inflation rate rose. The ECB’s expansionary monetary policy and Norges Bank’s rate cut raised the pressure on the Riksbank, however, to take additional monetary action to reach its inflation target of two per cent. The Baltic countries continued to grow in the second quarter at an annualised rate of 1.4 per cent in Lithuania, 2 per cent in Estonia and 2.7 per cent in Latvia. Growth was mainly the result of household consumption, supported by 5-7 per cent wage increases. Baltic exports to Russia have fallen by 20-40 per cent during the year at the same time that exports to other markets have risen by more or less a similar amount. The pace of investment has to increase in order to contribute to higher productivity and higher competitiveness as wages rise. Falling global commodity prices contributed to lower or marginal inflation. The inflation impact from the labour market was still limited despite higher wage increases and declining unemployment. The Stockholm stock exchange (OMXSPI) gained 0.4 per cent during the first nine months, but fell by 6 per cent in the third quarter. The Tallinn stock exchange (OMXTGI) rose by 14 per cent, the Riga stock exchange (OMXRGI) by 40 per cent and the Vilnius stock exchange (OMXVGI) by 6 per cent during the year. During the third quarter the Tallinn stock exchange (OMXTGI) rose by 2 per cent, the Riga stock exchange (OMXRGI) by 30 per cent, and the Vilnius stock exchange (OMXVGI) by 8 per cent. Third quarter 2015 Compared with second quarter 2015 Result The quarterly result increased by 7 per cent to SEK 3 928m (3 666). A one-off tax expense negatively affected profit in the second quarter. Income and expenses both decreased, while credit impairments were higher. Profit before impairments improved to SEK 5 355m (5 268). Profit increased in Baltic Banking as well as in Group Functions & Other, mainly due to a higher result within Group Treasury. Swedish Banking’s profit was stable, while it decreased in Large Corporates & Institutions (LC&I). The return on equity increased to 13.5 per cent (13.4). The cost/income ratio improved to 0.42 (0.43). Profit before impairments by business segment excl FX effects Q3 Q2 Q3 SEKm 2015 2015 2014 Swedish Banking 3 161 3 172 3 002 Baltic Banking 961 940 922 Large Corporates & Institutions 956 1 110 947 Group Functions & Other 277 46 1 104 Total excl FX effects 5 355 5 268 5 975 FX effects 0 11 Total 5 355 5 268 5 986 Income decreased by 1 per cent to SEK 9 234m (9 315). Net interest income increased, while net commission income and net gains and losses on financial items at fair value decreased. Net interest income increased by 2 per cent to SEK 5 811m (5 704). Net interest income increased in Swedish Banking and Baltic Banking and was stable in LC&I. In Group Functions & Other net interest income fell slightly in Group Treasury. Deposit margins decreased in all business areas due to lower interest rates, while higher lending volumes contributed positively. Lending margins on Swedish mortgages increased. An extra day during the quarter affected net interest income positively. Net commission income fell by 4 per cent to SEK 2 736m (2 842). Net commission income decreased in Swedish Banking but was stable in Baltic Banking and LC&I. Net commission income from cards was seasonally higher. Lending related commissions were stable. Net commission income from asset management decreased mainly due to a declining stock market, but also to net outflows. Net commission income in corporate finance and securities trading was seasonally lower. Net gains and losses on financial items at fair value decreased to SEK 4m (82). This was mainly due to a lower result in LC&I, which was seasonally lower and adversely affected by poor liquidity in the fixed income market and wider credit spreads. Net gains and losses on financial items improved in Group Treasury within Group Functions & Other as wider credit spreads had a less negative effect than in the second quarter. Other income was stable at SEK 683m (687). Expenses decreased by 4 per cent to SEK 3 879m (4 047), mainly in Swedish Banking and LC&I. Staff costs decreased, mainly due to a lower number of full- time positions and seasonally lower expenses. The number of full-time employees was reduced by 95, mainly in Swedish Banking and Baltic Banking. Impairment of intangible assets increased to SEK 254m (0) and consisted of IT system impairment within Group Products and the writedown of a previously acquired asset management assignment.
  • 6. Swedbank –Interim report January-September 2015 Page 6 of 57 Credit impairments increased to SEK 130m (6). Impairments rose within LC&I due to increased provisions for a previously known problem loan. Swedish Banking continued to report low credit impairments, while recoveries decreased in Baltic Banking. The tax expense amounted to SEK 1 012m (1 538), corresponding to an effective tax rate of 20.4 per cent (29.4). The second quarter was affected by one-off items related to the Estonian and US operations, which raised the tax expense by SEK 447m. Excluding these one-off items, the second quarter’s effective tax rate would have been 20.8 per cent. As previously estimated, the effective tax rate is expected to be 19-21 per cent in the medium term. The result from discontinued operations improved to SEK -11m (-32). January-September 2015 Compared with January-September 2014 Result The result for the period decreased by 6 per cent to SEK 11 914m (12 652), mainly due to a one-off tax expense in the second quarter 2015 and intangible assets impairment in the third quarter 2015. Income and expenses both decreased. Changes in exchange rates, primarily the depreciation of the Swedish krona against the euro, raised profit by SEK 25m. The return on equity fell to 13.8 per cent (15.6), affected equally by a lower result and a larger capital base. The cost/income ratio improved to 0.43 (0.44). Profit before impairments decreased by 3 per cent to SEK 16 073m (16 616). Profit rose in Swedish Banking but was stable in Baltic Banking. Profit in LC&I and Group Treasury within Group Functions & Other fell. Profit before impairments by business segment excl FX effects Jan-Sep Jan-Sep ∆ SEKm 2015 2014 SEKm Swedish Banking 9 303 9 045 258 Baltic Banking 2 773 2 826 -53 Large Corporates & Institutions 3 185 3 345 -160 Group Functions & Other 812 1 463 -651 Total excl FX effects 16 073 16 679 -606 FX effects -63 63 Total 16 073 16 616 -543 Income decreased by 6 per cent to SEK 28 167m (29 925), mainly in Group Treasury within Group Functions & Other. Income was stable in Baltic Banking and decreased in other business areas. In 2014 Swedish Banking had one-off income mainly related to the acquisition of Sparbanken Öresund. Net interest income increased and commission income was stable. Net gains and losses on financial items at fair value and other income fell. Changes in exchange rates increased income by SEK 155m. Net interest income rose by 2 per cent to SEK 17 234m (16 833). Group Treasury’s net interest income improved supported by falling market interest rates. Net interest income decreased slightly within Swedish Banking. Lower market interest rates adversely affected deposit margins, while increased lending volumes and higher mortgage margins contributed positively. Net interest income within Baltic Banking was pressured by lower deposit margins. Net interest income was stable within LC&I, where lower deposit margins were offset by higher lending volumes. Higher stability fees reduced net interest income by SEK 143m. Changes in exchange rates raised net interest income by SEK 98m. Net commission income was unchanged at SEK 8 322m. Insurance related income and income from card commissions contributed positively, while income from corporate finance and payment commissions fell, the latter due to the euro transition in Lithuania and a one-off item of SEK 35m in 2014. Asset management commissions were stable, the net affected by higher average assets under management due to a rising stock market and price cuts on fund fees. Net gains and losses on financial items at fair value decreased by 79 per cent to SEK 406m (1 917). The lower result in Group Treasury within Group Functions & Other is mainly due to the negative valuation effects from covered bond repurchases and increased credit spreads. Net gains and losses on financial items within LC&I were stable. Other income decreased by 23 per cent to SEK 2 205m (2 853). Income decreased in all business areas except LC&I, where it was stable. Swedish Banking recognised one-off income of SEK 461m in 2014 related to the acquisition of Sparbanken Öresund. Within Group Functions & Other income from repossessed assets decreased as the property portfolio was sold off. Expenses decreased by 9 per cent to SEK 12 094m (13 309). The biggest decrease was in Swedish Banking, where one-off expenses of SEK 615m were recognised in connection with the acquisition of Sparbanken Öresund in 2014, but also due to efficiencies. Expenses decreased in Group Functions & Other mainly as a result of efficiency improvements, but also one-off expenses in 2014 related to the move of the head office. Expenses decreased within Baltic Banking in local currency. Expenses within LC&I were stable. Changes in exchange rates increased expenses by SEK 92m. The number of full-time employees decreased. In Swedish Banking and Baltic Banking as well as Group Products within Group Functions & Other the decrease was due to efficiencies and digitised processes. In Swedish Banking it was also the result of the integration of Sparbanken Öresund. In LC&I the number of full-time employees increased slightly. Impairment of intangible assets increased to SEK 254m (1) and consisted of IT system impairment within Group Products and the writedown of a previously acquired asset management assignment. Impairment of tangible assets decreased to SEK 53m (223) as a result of a lower property portfolio. Credit impairments increased to SEK 195m (165), mainly because Baltic Banking posted lower recoveries. Impairments decreased within LC&I. Within Swedish Banking credit impairments remained low, though slightly higher than in 2014.
  • 7. Swedbank –Interim report January-September 2015 Page 7 of 57 The tax expense amounted to SEK 3 651m (3 301), corresponding to an effective tax rate of 23.4 per cent (20.3). During the second quarter the effective tax rate was affected by one-off items in the Estonian and US operations. Excluding these items, the effective tax rate would have been 20.6 per cent. As previously estimated, the effective tax rate is expected to be 19-21 per cent in the medium term. The result for discontinued operations amounted to SEK 6m (-259). A reclassification of SEK -223m was recognised in 2014 to wind down the Russian operations. Volume trend Lending to mortgage customers in Sweden increased by SEK 28bn during the period to SEK 667bn, of which SEK 8bn in the third quarter. Swedbank’s market share of net growth was 21 per cent during the first eight months of the year, compared with a total market share of 25 per cent (25 per cent as of 31 December). Mortgage volumes in Baltic Banking increased by 2 per cent in local currency to SEK 55bn. In Estonia and Lithuania the portfolios grew by 4 and 5 per cent, respectively, while it decreased by 2 per cent in Latvia. Household lending other than mortgages grew by SEK 3bn during the nine-month period to SEK 137bn. The largest increase was in lending to tenant-owner associations, which rose by SEK 3bn to SEK 101bn. Baltic Banking’s volumes grew by 8 per cent in local currency to SEK 11bn. Estonia and Lithuania saw growth, while volumes in Latvia decreased slightly. Corporate lending within Swedish Banking and LC&I rose by SEK 11bn during the period to SEK 445bn. During the third quarter the growth rate slowed and volumes increased by SEK 1bn. Swedbank’s market share of net growth in Sweden was 34 per cent during the first eight months of the year and the total market share increased to 19.0 per cent (18.7) as of 31 August. Corporate lending in Baltic Banking increased by 3 per cent in local currency to SEK 63bn. The lending portfolio grew by 4 per cent in Lithuania, 3 per cent in Estonia and 1 per cent in Latvia. Swedbank’s deposits increased by SEK 73bn from the beginning of the year to a total of SEK 734bn. The increase was mainly due to Group Treasury and related to higher deposits from US money market funds. Swedish Banking’s volumes grew by SEK 19bn, of which SEK 18bn was from private individuals. In LC&I deposits decreased by SEK 3bn during the year. In Baltic Banking deposits rose by 5 per cent in local currency, with increases in all three countries. Market shares in Sweden declined somewhat as of 31 August to 20.9 per cent (21.1) for household deposits and 17.9 per cent (18.7) for corporate deposits. Fund assets under management decreased by SEK 6bn from the beginning of the year to SEK 709bn, of which SEK 678bn relates to the Swedish operations. Discretionary assets under management amounted to SEK 338bn (337). During the year Swedbank Robur had a net outflow of SEK 14bn in the Swedish market, where the outflow was SEK 10bn in the third quarter. The previous trend with outflows from fixed income funds and inflows to mixed funds continued. Equity funds also reported outflows. The net outflow from Swedbank Robur’s equity funds was SEK 16bn, of which SEK 5bn in the third quarter, affected by a declining stock market. Discretionary management has seen a net inflow of SEK 7bn for the year, but an outflow of SEK 3bn in the third quarter. Swedbank Robur’s market share for net inflows was negative (13 per cent for 2014). For more information on the product areas, see page 18. Credit and asset quality The quality of Swedbank’s credit portfolio remains good. During the quarter lending to solvent customers grew at a stable pace. Credit impairments remained at very low levels despite that macroeconomic uncertainty and political concerns continue to have an impact on economic growth in the bank’s home markets. Thanks to Swedbank’s focus on stable customers with low risk, coupled with efforts to help them maintain a sound and sustainable financial situation, the credit portfolio has not been affected despite the market turbulence. Measures are also being taken to continuously adapt the bank’s procedures and governance to changing global conditions as well as to offset potentially negative effects. Mortgage lending in Sweden continued to grow during the year. The increase has mainly been in large urban areas with solid economic growth. Low risk is maintained in the mortgage portfolio through good controls and monitoring as well as strict lending terms, where Swedbank is working to instil a clearer culture where borrowers pay off their loans. New amortisation guidelines were introduced during the quarter for new loans, in line with the Swedish Financial Supervisory Authority’s previous proposal. These measures have become more important against the backdrop of the continued rise in house prices. During the third quarter 95 per cent (94 in Q2) of new mortgages granted in Sweden with a loan-to-value ratio of over 70 per cent were being amortised, as were 64 per cent (53 in Q2) of those with a loan-to-value ratio of between 50 and 70 per cent. Amortisations in the Swedish mortgage portfolio amounted to around SEK 11bn during the last 12-month period. The average loan-to-value ratio for Swedbank’s mortgages in Sweden was 57.9 per cent (60.1 as of 31 December 2014). In Estonia it was 49.7 per cent (53.9), in Latvia 96.1 per cent (108.2) and in Lithuania 79.0 per cent (84.8), based on property level. For more information, see the loan section on page 18 and page 52 of the fact book. Lending to non-housing related property companies in Sweden rose by SEK 6bn to SEK 125bn during the nine-month period. The portfolio risk remained low thanks to the good solvency of customers. Impaired loans continued to decrease during the year and corresponded to 0.35 per cent (0.41) of total lending. The provision ratio for impaired loans was 39 per cent (35) and including portfolio provisions was 58 per cent (53). For more information on credit risk, see pages 45-51 of the fact book.
  • 8. Swedbank –Interim report January-September 2015 Page 8 of 57 Credit impairments, net by business segment Q3 Q2 Q3 SEKm 2015 2015 2014 Swedish Banking 35 48 43 Baltic Banking -2 -49 -59 Estonia 21 -9 -3 Latvia -17 -95 -42 Lithuania -6 55 -14 Large Corporates & Institutions 97 7 269 Group Functions & Other 0 0 -18 Total 130 6 235 Credit impairments amounted to SEK 195m (165) during the nine-month period, of which SEK 130m in the third quarter, mainly related to provisions for anticipated credit impairments from a few commitments in Sweden. Baltic Banking reported further net recoveries, but at a lower level. Repossessed assets continued to decrease to SEK 575m (933). For more information on repossessed assets, see page 50 of the fact book. Operational risks Rapid digitisation has led to very high functionality and security demands. Operational risks are therefore a top priority. The direct losses attributable to operational risks remained low during the third quarter. The trend from the previous year is continuing and the number of IT incidents is on the decline. During the second quarter Swedbank applied to the SFSA to use the Advanced Measurement Method (AMA) to calculate operational risks. A decision is expected during the first half of 2016. Funding and liquidity The nine-month period saw continued positive demand for Swedbank’s bonds. In 2015 Swedbank has issued larger volumes of long-term bonds and taken advantage of favourable market conditions partly to pre-finance upcoming maturities, but also to match higher lending volumes. Economic and political uncertainty increased slightly during the third quarter with greater uncertainty regarding China, which led to continued high market volatility and higher credit spreads. During the first nine months Swedbank issued SEK 188bn in long-term debt, of which SEK 55bn related to the third quarter. Covered bonds, which are the most important source of financing for the bank, accounted for SEK 42bn. The higher share of senior unsecured funding contributed positively to the Net Stable Funding Ratio (NSFR). According to the updated definition (Basel 3) of how to calculate NSFR, a larger share of assets has to be financed with long-term financing. According to Swedbank’s interpretation of the update, the bank’s NSFR amounts to 104 per cent as of 30 September, compared with an anticipated requirement of 100 per cent. On 30 September the total volume of short-term funding amounted to SEK 251bn (195bn as of 31 December, 2014) at the same time that SEK 269bn was placed with central banks. Swedbank’s most important liquidity measure is the survival horizon, which showed that the bank as of 30 September would survive more than 12 months with the capital markets completely shut down. This applies to total liquidity as well as liquidity in USD and EUR. For more information on the bank’s funding and liquidity, see pages 66-77 of the fact book. Ratings There were no changes in Swedbank’s ratings in the third quarter. Capital and capital adequacy The Common Equity Tier 1 capital ratio was 23.0 per cent on 30 September 2015 (22.4 per cent as of 30 June 2015 and 21.2 per cent as of 31 December 2014). Common Equity Tier 1 capital increased by SEK 1.8bn during the quarter to SEK 93.0bn. The bank’s profit after deducting the anticipated dividend positively affected Common Equity Tier 1 capital by SEK 0.7bn. The revaluation of the estimated pension liability according to IAS 19 increased Common Equity Tier 1 capital by about SEK 0.5bn, mainly due to a higher discount rate and lower inflation assumptions. Change in Common Equity Tier 1 capital, 2015, Swedbank consolidated situation 87.9 93.00.5 0.5 3.7 -2.9 91.2 50 55 60 65 70 75 80 85 90 95 100 SEKbn Increase Decrease REA decreased by SEK 2.6bn in the third quarter to SEK 404.2bn as of 30 September. REA for credit risks increased by SEK 0.4bn. Increased exposures to mortgages and corporate customers mainly in Sweden, as well as exchange rate effects, raised REA. Positive PD changes reduced REA by SEK 3.3bn with an updated PD model within Baltic Banking contributing with a decrease of SEK 2.9bn. Increased collateral values had a positive effect on LGD, helping to reduce REA by SEK 1.9bn. REA for market risks decreased by SEK 3.1bn, mainly due to a lower interest rate risk compared with the previous quarter. REA for operational risks was unchanged during the quarter.
  • 9. Swedbank –Interim report January-September 2015 Page 9 of 57 Change in REA, 2015, Swedbank consolidated situation -3.3 4.5 -1.9 1.0 0.2 -3.1 414.2 406.8 404.2 360 370 380 390 400 410 420 Q4 2014 Q2 2015 Exposure change Rating migration (PD) LGD changes Other credit risk CVA risk Market risk Q3 2015 SEKbn Increase Decrease Uncertainty about capital regulations persists – Swedbank well positioned As of September the countercyclical buffer value of 1 per cent decided by the SFSA in September 2014 is applied. The countercyclical buffer requirement also affects Swedbank’s capital requirement through the risk weight floor of 25 per cent for the Swedish mortgage portfolio. The SFSA has completed its Supervisory Review and Evaluation Process (SREP) for 2015 for Swedbank. In its SREP decision, the SFSA has used the methods it announced in May 2015 to assess capital requirements within Pillar 2 for credit related concentration risk, interest rate risk in the banking book and pension risk. On this basis, Swedbank’s Common Equity Tier 1 capital requirement for individual Pillar 2 risks is estimated at 0.9 per cent (1.1). The total Common Equity Tier 1 capital requirement for Swedbank was unchanged during the quarter at 19.6 per cent, compared with Swedbank’s Common Equity Tier 1 capital ratio of 23.0 per cent as of 30 September. The requirement increased because the capital requirement for the risk weight floor for mortgages in Pillar 2 is increasing in relation to the total risk exposure amount. At the same time the requirement decreased by a corresponding amount because the capital requirement for individual Pillar 2 risks is lower than previously estimated. The total requirement takes into account an impending increase in the countercyclical buffer value to 1.5 per cent (June 2016). The SFSA has announced that it will continue to review Swedish banks’ IRB A, especially with regard to corporate risk weights, to improve the models. The SFSA expects this work to be completed in 2016 and to lead to an increase in the capital requirements for corporate exposures. At the same time international work is underway regarding capital requirements. The Basel Committee, among others, is working to improve the comparability of banks’ capital ratios. This work comprises future standard methods to calculate capital requirements for credit, market and operational risks, where the possibility of a capital floor is being discussed for banks that use internal models. Owing to uncertainty about the new requirements and how and when they will be implemented, it is still too early to draw any conclusions about the possible impact on Swedbank. With its robust profitability and strong capitalisation, Swedbank is well positioned to meet future changes in the capital requirements. An evaluation of the leverage ratio is also underway ahead of the possible introduction of any minimum requirement in 2018. Swedbank’s leverage ratio as of 30 September was 4.5 per cent (4.5 per cent on 30 June). Other events In September Swedbank agreed to acquire Danske Bank’s retail banking business in Lithuania and Latvia. The agreement, which requires the approval of regulatory authorities in Lithuania and Latvia, strengthens Swedbank’s presence in the Baltic countries, mainly in Lithuania. Annual General Meeting 2016 Swedbank’s 2016 Annual General Meeting will be held in Malmö on Tuesday, 5 April. More information on the AGM will be available on the bank’s website: www.swedbank.com under the heading About Swedbank/ Corporate governance. The Nomination Committee comprises the following members: Lennart Anderberg, appointed by owner- group Föreningen Sparbanksintressenter and Chair of the Nomination Committee; Ramsay Brufer, appointed by Alecta; Jens Henriksson, appointed by owner-group Folksam; Peter Karlström, appointed by owner-group Sparbanksstiftelserna; and Anders Sundström, Chair of the Board of Directors of Swedbank AB. Shareholders who wish to submit a proposal to the Nomination Committee must do so no later than 7 January 2016 either by e-mail to valberedningen@swedbank.se or by mail to: Valberedningen c/o Swedbank AB Valberedningens sekreterare, Group Legal SE-105 34 Stockholm, Sweden Events after 30 September 2015 On 1 October Sparbanken Öresund AB was merged with Swedbank AB. As a result, Swedbank took over Sparbanken Öresund’s role as the issuer of outstanding bond and subordinated loans. In mid-October a major technological conversion was completed in which around 100 000 customers were transferred from Sparbanken Öresund’s system to Swedbank. The transfer and integration of Sparbanken Öresund have been one of Swedbank’s highest priorities and biggest challenges during the year. The conversion went well and progressed as planned.
  • 10. Swedbank –Interim report January-September 2015 Page 10 of 57 Swedish Banking  Improved net interest income due to higher lending volumes and margins  Weaker stock market resulted in lower net commission income  Efficiency improvements contributed to lower expenses Income statement Q3 Q2 Q3 Jan-Sep Jan-Sep SEKm 2015 2015 % 2014 % 2015 2014 % Net interest income 3 404 3 281 4 3 372 1 9 875 10 049 -2 Net commission income 1 717 1 916 -10 1 739 -1 5 414 5 149 5 Net gains and losses on financial items at fair value 64 63 2 47 36 181 150 21 Share of profit or loss of associates 201 228 -12 221 -9 707 886 -20 Other income 187 180 4 177 6 593 936 -37 Total income 5 573 5 668 -2 5 556 0 16 770 17 170 -2 Staff costs 861 883 -2 928 -7 2 663 3 117 -15 Variable staff costs 42 34 24 52 -19 130 152 -14 Other expenses 1 483 1 552 -4 1 545 -4 4 593 4 796 -4 Depreciation/amortisation 26 27 -4 29 -10 81 61 33 Total expenses 2 412 2 496 -3 2 554 -6 7 467 8 126 -8 Profit before impairments 3 161 3 172 0 3 002 5 9 303 9 044 3 Credit impairments 35 48 -27 43 -19 135 99 36 Operating profit 3 126 3 124 0 2 959 6 9 168 8 945 2 Tax expense 666 676 -1 629 6 1 953 1 827 7 Profit for the period 2 460 2 448 0 2 330 6 7 215 7 118 1 Profit for the period attributable to the shareholders of Swedbank AB 2 456 2 444 0 2 324 6 7 203 7 104 1 Non-controlling interests 4 4 0 6 -33 12 14 -14 Return on allocated equity, % 19.0 18.9 26.3 18.6 28.3 Loan/deposit ratio, % 246 245 250 246 250 Credit impairment ratio, % 0.01 0.02 0.02 0.02 0.01 Cost/income ratio 0.43 0.44 0.46 0.45 0.47 Loans, SEKbn 1 059 1 050 1 1 004 5 1 059 1 004 5 Deposits, SEKbn 431 428 1 402 7 431 402 7 Full-time employees 4 571 4 651 -2 5 053 -10 4 571 5 053 -10 Development January - September The result for the period was stable at SEK 7 203m (7 104). Income and expenses both decreased, mainly due to larger one-off items in the second quarter 2014 in connection with the acquisition of Sparbanken Öresund. Income was pressured by lower deposit margins, while the focus on further cost efficiencies led to a reduction in the number of employees and lower staff costs. Net interest income decreased by 2 per cent compared with the first nine months of 2014 as a result of lower deposit margins, which were adversely affected by lower market interest rates. This was largely offset by higher lending volumes and increased mortgage margins on both new lending and the portfolio as a whole. Margins have gradually risen since mid-year 2014 to compensate for higher capital requirements in the form of higher risk weights on mortgages. As of the fourth quarter 2014 capital equivalent to a 25 per cent risk weight floor for Swedish mortgages is allocated to the business area, which increases allocated capital and reduces its return. Compared with the second quarter net interest income rose. Increased lending volumes, an extra day in the quarter and improved mortgage margins contributed positively, while deposit margins continued to decline. Household deposit volumes increased by SEK 18bn from the beginning of the year, of which SEK 5bn in the third quarter. Swedbank’s share of household deposits was 20.9 per cent as of 31 August (21.1 per cent as of 31 December 2014). Corporate deposits within Swedish Banking increased by SEK 1bn from the beginning of the year, but decreased by SEK 2bn in the quarter. Swedbank’s market share, including corporate deposits within LC&I, decreased to 17.9 per cent as of 31 August (18.7 per cent as of 31 December 2014). Swedbank’s household mortgage volume increased by SEK 28bn from the beginning of the year. Swedbank’s market share of net growth was 21 per cent during the first eight months. Swedbank’s share of the total market was 25 per cent (25 per cent as of 31 December 2014). Corporate lending increased by SEK 4bn from the beginning of the year and was stable during the quarter. The market share, including corporate lending within LC&I, improved to 19.0 per cent (18.7 per cent as of 31 December 2014). Net commission income rose by 5 per cent during the first nine months compared with the same period in 2014. The increase was mainly due to higher income from structured products as well as card and payment commissions resulting from higher volumes. Asset management commissions decreased slightly, the net mainly affected by higher average assets under management and price cuts on fund fees. The reductions in fund fees were implemented primarily in the fourth quarter 2014 and first quarter 2015 to create a more attractive customer offering and adapt the fees to a low interest rate environment. Swedbank’s market
  • 11. Swedbank –Interim report January-September 2015 Page 11 of 57 share of total assets under management was 22 per cent (23 per cent as of 31 December 2014). A larger share of the savings related to deposit accounts and a significantly smaller share to funds. During the third quarter net commission income fell by 10 per cent, mainly due to a decrease in fund management income caused by a declining stock market as well as lower sales of structured products during the summer. The trend away from equity and fixed income funds toward mixed funds continued. The net flow was negative. A clear shift was evident in customers’ risk appetite. The bank’s advice in this low interest rate environment focused more on lower risk savings. The share of associates’ profit decreased compared with the previous year, mainly due to one-off income of SEK 230m related to Entercard in 2014. Other income was lower than in the previous year due to one-off income in 2014 mainly related to the acquisition of Sparbanken Öresund. Expenses decreased during the first nine months compared with the same period in 2014, when one-off expenses in connection with the acquisition of Sparbanken Öresund contributed to higher expenses. The increased focus on efficiencies also reduced expenses, mainly related to staff. Expenses fell compared with the second quarter as well, mainly due to lower staff costs and lower marketing expenses. Increased use of digital channels has changed the way customers interact with the bank and is gradually contributing to lower staff costs. Credit quality remained good and credit impairments were again low, although they increased slightly compared with the first nine months of 2014. The share of impaired loans was 0.14 per cent (0.15 per cent). The number of customers who use Swedbank’s digital channels continues to grow. The Internet Bank had 3.8 million users as of 30 September, an increase of over 100 000 during the year. The Mobile Bank had 2.3 million (+335 000). Industry-wide banking solutions are growing as well. The Swish service is now used by over 3.3 million private individuals and around 30 000 corporate customers, and the number of identifications using Mobile BankID rose by 122 per cent to 50 million in the third quarter. Increasing digitisation strongly contributed to a year-on-year decrease of 16 per cent in the number of teller transactions in branches. At the same time the number of advisory meetings decreased by 19 per cent. Sweden is Swedbank’s largest market, with around 4 million private customers and more than 250 000 corporate customers. This makes it Sweden’s largest bank by number of customers. Through our digital channels (Telephone Bank, Internet Bank, Mobile Bank and iPad Bank) and branches, and with the cooperation of savings banks and franchisees, we are always available. Swedbank is part of the local community. The bank’s branch managers have a strong mandate to act in their local communities. The bank’s presence and engagement are expressed in various ways. A project called “Young Jobs”, which has created several thousand trainee positions for young people, has played an important part in recent years. Swedbank has 291 branches in Sweden. The various product areas are described beginning on page 18.
  • 12. Swedbank –Interim report January-September 2015 Page 12 of 57 Baltic Banking  Stable operating results  Growing lending volumes in light of increased consumer confidence  Acquisition of Danske Bank’s retail banking business Income statement Q3 Q2 Q3 Jan-Sep Jan-Sep SEKm 2015 2015 % 2014 % 2015 2014 % Net interest income 900 865 4 865 4 2 596 2 633 -1 Net commission income 511 524 -2 500 2 1 504 1 451 4 Net gains and losses on financial items at fair value 48 45 7 60 -20 143 175 -18 Other income 107 102 5 87 23 358 314 14 Total income 1 566 1 536 2 1 512 4 4 601 4 573 1 Staff costs 204 209 -2 187 9 623 567 10 Variable staff costs 20 18 11 19 5 57 58 -2 Other expenses 349 350 0 375 -7 1 044 1 112 -6 Depreciation/amortisation 32 34 -6 36 -11 104 107 -3 Total expenses 605 611 -1 617 -2 1 828 1 844 -1 Profit before impairments 961 925 4 895 7 2 773 2 729 2 Impairment of intangible assets 0 0 0 0 1 Impairment of tangible assets 6 1 2 5 0 Credit impairments -2 -49 -96 -59 -97 -60 -176 -66 Operating profit 957 973 -2 952 1 2 828 2 904 -3 Tax expense 132 1 064 -88 142 -7 1 327 437 Profit for the period 825 -91 810 2 1 501 2 467 -39 Profit for the period attributable to the shareholders of Swedbank AB 825 -91 810 2 1 501 2 467 -39 Return on allocated equity, % 16.2 -1.8 15.7 9.7 15.4 Loan/deposit ratio, % 90 92 97 90 97 Credit impairment ratio, % -0.01 -0.16 -0.19 -0.06 -0.20 Cost/income ratio 0.39 0.40 0.41 0.40 0.40 Loans, SEKbn 129 126 2 121 7 129 121 7 Deposits, SEKbn 144 138 4 125 15 144 125 15 Full-time employees 3 786 3 841 -1 3 853 -2 3 786 3 853 -2 Development January - September Profit for the first nine months of 2015 amounted to SEK 1 501m, a decrease of 39 per cent compared with the same period in 2014. The decrease is due to a higher tax expense caused by an extra dividend from the Estonian sub-group during the second quarter and lower recoveries. Changes in exchange rates improved profit for the period by SEK 61m. Net interest income decreased by 5 per cent in local currency compared with the nine-month period in 2014 as low market interest rates put pressure on deposit margins. Mortgage portfolio margins were stable, but slightly higher on new lending. Higher consumer finance volume contributed positively at the same time that tight competition and better credit quality pressured corporate lending margins. Resolution fee accruals reduced net interest income by SEK 42m. Changes in exchange rates increased net interest income by SEK 91m. Compared with the previous quarter net interest income rose by 2 per cent in local currency, supported by growing lending volumes and one more day in the quarter. Lending volumes increased by 3 per cent in local currency compared with 31 December 2014, driven by increased credit demand in light of continued economic growth in the Baltic countries. The main driver remained private consumption supported by strong wage growth. The positive trend was seen in all major portfolios: corporate lending, leasing, consumer finance and mortgages. Lending volume grew in all three countries compared with year-end 2014. In the third quarter lending volumes increased in Estonia and Latvia. Swedbank’s market share in lending was 29 per cent as of 30 June 2015 (29 per cent as of 31 December 2014). Deposit volumes increased by 5 per cent in local currency from 31 December 2014. Deposits increased in all three countries. Swedbank’s market share in deposits was 29 per cent as of 30 June 2015 (28 per cent as of 31 December 2014). The loan-to-deposit ratio was 90 per cent (91 per cent as of 31 December 2014). Net commission income in local currency was stable compared with the nine-month period in 2014. Higher customer activity increased commissions related to cards and the number of card transactions rose by 12 per cent. Payment commissions decreased due to Lithuania’s adoption of the euro and a reversal of a previous fine (SEK 35m) last year. Compared with the previous quarter net commission income decreased by 4 per cent in local currency due to changes in the reporting of insurance income, which had a positive effect of SEK 22m on net commissions during the second quarter and the opposite effect on other income. Net gains and losses on financial items at fair value decreased by 21 per cent in local currency compared with the first nine months of 2014. The decrease was mainly due to lower income from the Lithuanian FX trading business as a result of the euro adoption.
  • 13. Swedbank –Interim report January-September 2015 Page 13 of 57 Other income increased by 10 per cent in local currency compared with the nine-month period in 2014. Income increased due to higher insurance-related income, which rose largely because of changes in the assumptions used to calculate provisions for guaranteed return products in traditional life during the first quarter, but also due to improved underlying business results. Premium income increased by 16 per cent for life insurance products and by 15 per cent for non-life products from the same period in 2014. Total expenses decreased by 4 per cent in local currency year-on-year, mainly as a result of lower expenses for premises, consultancy and IT. Staff costs rose due to wage increases. As customers increasingly choose digital services, the bank has been able in the last year to reduce its number of branches by 11 to 147, of which 51 are cash-smart branches that focus on advisory services. The emphasis on digital sales is continuing through automated campaigns and specifically targeted offers. Starting in the third quarter customers can obtain small loans through Swedbank’s mobile app. Around 40 per cent of new sales to private customers are made through the bank’s digital channels. IT expenses decreased after work related to the euro transition in Lithuania was completed. Compared with the previous quarter expenses decreased by 3 per cent, mainly due to seasonally lower staff costs during the summer months. Net recoveries amounted to SEK 60m (176 in the first nine months of 2014). Latvia reported recoveries, while Estonia and Lithuania reported credit impairments related to a few customers. The situation in Russia has had no financial impact. The sectors most affected by the Russian recession are agriculture and transportation, but Swedbank’s exposure to them directly or indirectly is limited. Swedbank continues to take preventive measures to help customers that could be affected by the Russian situation. During the second quarter Swedbank decided to take an extra dividend of SEK 3.7bn from the Estonian sub- group to the parent company. Since profits in Estonia are first taxed upon distribution, this generated an extra tax expense of SEK 929m. Swedbank has reached an agreement with Danske Bank to acquire its retail banking business in Lithuania and Latvia. The acquisition includes around 120 000 private customers in Lithuania with approximately EUR 525m in loans and 7 000 private customers in Latvia with approximately EUR 116m in loans. The acquisition, which is subject to regulatory approval in both Lithuania and Latvia, is targeted for closing in the first quarter of 2016. In the annual survey of “Most Loved Brands” Swedbank took fourth place in the Baltics, the same position as last year, with the highest score among financial institutions. The three top brands were the global brands Google, Facebook and Gmail. Swedbank is the largest bank by number of customers in Estonia, Latvia and Lithuania, with more than 3 million private customers and more than 300 000 corporate customers. According to surveys, Swedbank is also the most respected company in the financial sector. Through its digital channels (Telephone Bank, Internet Bank and Mobile Bank) and branches, the bank is always available. Swedbank is part of the local community. Its local social engagement is expressed in many ways, with initiatives to promote education, entrepreneurship and social welfare. Swedbank has 37 branches in Estonia, 42 in Latvia and 68 in Lithuania. The various product areas are described on page 18.
  • 14. Swedbank –Interim report January-September 2015 Page 14 of 57 Large Corporates & Institutions  Stable net interest income and commission income  Stronger position in euro bond issues  Declining bond trading in volatile market Income statement Q3 Q2 Q3 Jan-Sep Jan-Sep SEKm 2015 2015 % 2014 % 2015 2014 % Net interest income 865 862 0 878 -1 2 589 2 595 0 Net commission income 509 491 4 566 -10 1 496 1 699 -12 Net gains and losses on financial items at fair value 315 576 -45 354 -11 1 478 1 495 -1 Other income 33 39 -15 36 -8 107 101 6 Total income 1 722 1 968 -13 1 834 -6 5 670 5 890 -4 Staff costs 328 363 -10 344 -5 1 050 1 001 5 Variable staff costs 57 72 -21 72 -21 211 221 -5 Other expenses 365 390 -6 418 -13 1 175 1 233 -5 Depreciation/amortisation 16 17 -6 14 14 49 52 -6 Total expenses 766 842 -9 848 -10 2 485 2 507 -1 Profit before impairments 956 1 126 -15 986 -3 3 185 3 383 -6 Credit impairments 97 7 269 -64 120 261 -54 Operating profit 859 1 119 -23 717 20 3 065 3 122 -2 Tax expense 193 16 150 29 460 663 -31 Profit for the period 666 1 103 -40 567 17 2 605 2 459 6 Profit for the period attributable to the shareholders of Swedbank AB 666 1 103 -40 567 17 2 605 2 459 6 Return on allocated equity, % 13.3 21.2 13.6 17.2 20.9 Loan/deposit ratio, % 177 172 155 177 155 Credit impairment ratio, % 0.14 0.01 0.46 0.09 0.16 Cost/income ratio 0.44 0.43 0.46 0.44 0.43 Loans, SEKbn 182 182 0 162 12 182 162 12 Deposits, SEKbn 103 106 -3 104 -1 103 104 -1 Full-time employees 1 205 1 201 0 1 161 4 1 205 1 161 4 Development January - September The result for the period increased by 6 per cent compared with the first nine months in 2014, influenced by a positive tax effect in the second quarter 2015. Net interest income was stable compared with the first nine months of 2014. Lower deposit margins were offset by increased volumes and stable lending margins. Lending volumes increased by SEK 7bn from the beginning of the year, of which SEK 2bn was due to changes in exchange rates. The strategy to gradually grow the business with existing customers and selectively expand the customer base contributed to the increase. The biggest increase was in the retail sector. Deposit volumes were stable. Net interest income was also stable compared with the previous quarter. Lending volumes were stable, as was the margin on the existing portfolio. Credit demand remained low due to good liquidity and relatively low investments among large corporate customers. Deposit margins continued to shrink. Due to the negative interest rate, Swedbank charges financial institutions for deposits in a few currencies. Deposit volumes decreased by SEK 3bn as a result of lower deposits from a few customers. Net commission income decreased by 12 per cent year- on-year to SEK 1 496m. The decrease mainly relates to lower income from bond issues in Norway and from IPOs and preference share issues in Sweden. Swedbank’s market share of Swedish bond issues (SEK) was 22 per cent in 2015 (20 per cent as of 31 December) and in Norway (NOK) was 16 per cent (18 per cent as of 31 December). This made Swedbank the largest player in Sweden and the third largest in Norway. Swedbank has gradually strengthened its position in EUR issues and its market share has grown during the year. Compared with the second quarter net commission income increased by 4 per cent to SEK 509m. Funding activity was seasonally low. Income generated from M&A activity in Norway increased. Earnings from unrated corporate bond issues in Norway as well as preference share issues and IPOs were low. Card income was seasonally higher. Net gains and losses on financial items at fair value were stable compared with the same period in 2014. In the third quarter customer activity was seasonally lower and net gains and losses on financial items fell by 45 per cent. Wider credit spreads and low liquidity had a negative effect on earnings from fixed income trading. Lower oil prices and concerns how the impact could spread through the Norwegian economy led to a price adjustment in investment grade bonds, negatively affecting the bank’s earnings. At the same time the holdings were reduced significantly. Market volatility was higher at the end of the quarter, which benefited customer activity primarily in equity and FX trading. Total expenses for the period were stable compared with the same period in 2014. Staff costs increased as a result of deliberate investments. Compared with the previous quarter total expenses fell by 9 per cent, mainly as a result of seasonally lower staff costs in Norway and lower other expenses.
  • 15. Swedbank –Interim report January-September 2015 Page 15 of 57 The tax expense in the second quarter 2015 was positively affected by a one-off item of SEK 230m related to the US operations. Credit impairments for the nine-month period decreased to SEK 120m (261). The losses during the year were primarily attributable to increased provisions during the third quarter for a single commitment in the manufacturing sector. The share of impaired loans was 0.13 per cent (0.22). Credit quality in the loan portfolio is good. After stabilising somewhat in the second quarter, oil prices continued to fall in the third quarter and the investment level in the oil sector is expected to remain low for an extended period. Companies in the offshore and other oil-related sectors continue to take measures to adapt to the lower investment level. Swedbank closely dialogues with customers in these sectors, which mainly consists of listed companies with high credit ratings and long-term customer contracts. Large Corporates & Institutions is responsible for Swedbank’s offering to customers with revenues above SEK 2 billion and those whose needs are considered complex due to multinational operations or a need for sophisticated financing solutions. They are also responsible for developing corporate and capital market products for other parts of the bank and the Swedish savings banks. LC&I works closely with customers, who receive advice on decisions that create sustainable profits and growth. LC&I is represented in Sweden, Norway, Estonia, Latvia, Lithuania, Finland, Luxembourg, China, the US and South Africa.
  • 16. Swedbank –Interim report January-September 2015 Page 16 of 57 Group Functions & Other Income statement Q3 Q2 Q3 Jan-Sep Jan-Sep SEKm 2015 2015 % 2014 % 2015 2014 % Net interest income 642 696 -8 714 -10 2 174 1 552 40 Net commission income -22 -109 -80 -7 -151 -31 Net gains and losses on financial items at fair value -423 -600 -30 338 -1 395 97 Share of profit or loss of associates 0 0 0 1 1 0 Other income 210 188 12 253 -17 587 830 -29 Total income 407 175 1 298 -69 1 216 2 449 -50 Staff costs 697 748 -7 808 -14 2 191 2 515 -13 Variable staff costs 48 48 0 59 -19 179 176 2 Other expenses -705 -760 -7 -780 -10 -2 247 -2 020 -11 Depreciation/amortisation 90 94 -4 108 -17 281 318 -12 Total expenses 130 130 0 195 -33 404 989 -59 Profit before impairments 277 45 1 103 -75 812 1 460 -44 Impairment of intangible assets 254 0 0 254 0 Impairment of tangible assets 10 21 -52 17 -41 48 223 -78 Credit impairments 0 0 -18 0 -19 Operating profit 13 24 -46 1 104 -99 510 1 256 -59 Tax expense 21 -218 243 -91 -89 374 Profit for the period from continuing operations -8 242 861 599 882 -32 Profit for the period from discontinued operations, after tax -11 -32 -66 -2 6 -259 Profit for the period -19 210 859 605 623 -3 Profit for the period attributable to the shareholders of Swedbank AB -19 210 859 605 622 -3 Non-controlling interests 0 0 0 0 1 Full-time employees 4 367 4 331 1 4 537 -4 4 367 4 537 -4 Net interest income and net gains and losses on financial items mainly stem from Group Treasury. Other income mainly refers to income from the savings banks. Expenses mainly relate to Group Products and Group staffs and are allocated to a large extent. The product areas are described in more detail starting on page 18. Development January - September The result for continuing operations fell to SEK 599m in the first nine months of the year (882), mainly due to a lower result within Group Treasury. The result for Group Treasury decreased to SEK 784m (1 377). Net interest income increased to SEK 2 174m (1 552) year-on-year. This is mainly due to Group Treasury, where net interest income rose to SEK 2 227m (1 646) as a result of falling market interest rates. During the third quarter net interest income in Group Treasury decreased to SEK 662m, compared with SEK 717m in the second quarter. Net gains and losses on financial items at fair value for the nine-month period decreased to SEK -1 395m (97). Net gains and losses on financial items within Group Treasury decreased to SEK -1 403m (161). The effects of covered bond repurchases were the main reason for the negative result, which is reflected by corresponding positive effects in net interest income over time. Increased credit spreads also contributed negatively. During the third quarter Group Treasury’s result improved to SEK -417m (-600). The negative effect of wider credit spreads was less than in the second quarter. Other income fell year-on-year due to lower income from repossessed assets as a result of the significantly reduced portfolio. A capital gain of SEK 45m on property sales was recognised in the third quarter 2015, compared with one-off income of SEK 82m in 2014. Expenses decreased compared with 2014 to SEK 404m (989). Excluding the net of services purchased and sold internally, expenses fell by 8 per cent to SEK 4 683m (5 118) as a result of efficiency improvements. Expenses for repossessed assets have been reduced as the property portfolio is sold off. During the first nine months of 2014 one-off expenses of SEK 136m were recognised in connection with the move of the head office. Impairment of intangible assets increased to SEK 254m (0) and consisted of a writedown of IT systems within Group Products and a writedown of a previously acquired asset management assignment. Impairment of tangible assets decreased to SEK 48m (223). Discontinued operations The result for discontinued operations amounted to SEK 6m (-259). In 2014 SEK -223m related to the winding down of the Russian operations was reclassified. Swedbank’s net lending in Russia amounted to SEK 0.1bn. Group Functions & Other consists of centralised business support units and the product organisation Group Products. The centralised units serve as strategic and administrative support and comprise Accounting & Finance, Communication, Risk, IT, Compliance, Public Affairs, HR and Legal. Group Products’ purpose is to improve efficiency in the development and maintenance of Swedbank’s products. Group Treasury is responsible for the bank’s funding, liquidity and capital planning. Group Treasury sets the prices on all internal deposit and loan flows in the Group through internal interest rates, where the most important parameters are maturity, interest fixing period, currency and need for liquidity reserves.
  • 17. Swedbank –Interim report January-September 2015 Page 17 of 57 Eliminations Income statement Q3 Q2 Q3 Jan-Sep Jan-Sep SEKm 2015 2015 % 2014 % 2015 2014 % Net interest income 0 0 0 0 4 Net commission income 21 20 5 18 17 59 54 9 Net gains and losses on financial items at fair value 0 -2 0 -1 0 Other income -55 -50 -10 -68 19 -148 -215 31 Total income -34 -32 -6 -50 -32 -90 -157 43 Staff costs 0 0 0 0 0 Variable staff costs 0 0 0 0 0 Other expenses -34 -32 -6 -50 -32 -90 -157 43 Depreciation/amortisation 0 0 0 0 0 Total expenses -34 -32 -6 -50 -32 -90 -157 43 Group eliminations mainly consist of eliminations of internal transactions between Group Functions and the other business segments.
  • 18. Swedbank –Interim report January-September 2015 Page 18 of 57 Product areas Responsibility for the product areas rests with Group Products (GP) within Group Functions & Other. GP’s role is to increase efficiency in the development and maintenance of Swedbank’s products and to ensure that the customer offering is relevant, is competitive and is of high quality. This puts a priority on harmonising, improving efficiencies and digitising the processes for every product. The number of products will be reduced to make it easier for the bank’s customers while also increasing cost efficiencies. The number of funds is being reduced and efficiencies are being achieved in the mortgage lending process at the same time that digital availability is being improved. In mobile e-commerce new card payment solutions are being introduced to meet increased demand for e-commerce solutions. The product areas’ results are reported in several legal units and in the three business segments. For more information, see below and in the three business segment descriptions. Swedbank is a leader in a number of product areas, including asset management, cards and payments, mortgage lending and deposits. Most customers want more digital solutions and the greater availability they provide. Digitisation is therefore an important area for Swedbank. The number of customers connected to the bank’s digital channels and their usage continue to rise. Number of customers Jan-Sep Jan-Sep million 2015 2014 % Internet Bank 6.8 6.7 3 of which Sweden 3.8 3.7 4 of which Baltic countries 3.0 3.0 1 Mobile Bank 3.3 2.6 27 of which Sweden 2.3 1.9 24 of which Baltic countries 1.0 0.7 34 Mobile Bank ID, Sweden 1.9 1.2 57 Teller transactions in branches 3.0 3.8 -20 of which Sweden 2.3 2.7 -16 of which Baltic countries 0.7 1.0 -30 Loans and financing Market factors Mortgage demand has remained high as the housing shortage and low interest rates continue to drive up house prices. Credit demand within the property sector has accounted for most of the growth in corporate lending since 2014. To slow the pace of price increases and the build-up of household debt, amortisation requirements and revised interest deductions are being discussed. Neither proposal solves the fundamental problem in the housing market, however, of too little supply relative to demand. Higher capital requirements for mortgages and growing demands for transparency from customers and authorities are creating new opportunities for Swedish mortgage lenders. At the same time digitisation is making it easier for customers to compare offerings from different providers, as well as raising customer expectations of digital offerings. The market for consumer credit is a clear example where simplicity and speed have taken precedence in recent years and where Swedbank has to be better at promoting its offerings to customers whenever they make a purchase. Operations and market position Swedbank’s lending operations are concentrated in its home markets as well as in Norway. Lending products account for the majority of the assets on the balance sheet, and lending amounted to SEK 1 370bn as of 30 September (1 325 as of 31 December 2014). The largest share was lending to households, mainly mortgages to private customers and tenant owner associations in Sweden. The market share for mortgages was 25 per cent as of 31 August. Swedbank is also a major corporate lender in Sweden, with a market share of 19 per cent. The bank has a strong position in property management, the service sector and retail as well as in forestry and agriculture. In Swedish consumer credit Swedbank has a market share of about 10 per cent, corresponding to a volume of SEK 24bn. In the Baltic countries Swedbank is the largest lender, with market shares of 20-45 per cent. The Baltic countries account for 9 per cent of Swedbank’s total lending, with about an equal mix of private and corporate customers. Estonia accounts for nearly half of the Baltic portfolio. Loans 30 Sep 31 Dec 30 Sep SEKbn 2015 2014 2014 Loans, private mortgage 725 696 683 of which Sweden 667 639 628 of which Baltic countries 55 54 52 Loans, private other incl tenant owner associations 137 134 129 of which Sweden 125 122 118 of which Baltic countries 11 10 10 Loans, corporate 508 495 475 of which Sweden 393 381 366 of which Baltic countries 63 61 59 of which Norway 36 37 35 Total 1 370 1 325 1 287 Lending to private individuals – development Lending to private individuals amounted to SEK 862bn, an increase of SEK 32bn during the first nine months, of which SEK 10bn in the third quarter. Swedish mortgages account for a total of SEK 667bn. The growth rate in the Swedish mortgage market remained high, with annual growth of 7.6 per cent as of August 2015. Swedbank’s market share of net growth was 21 per cent for the first eight months of the year. Margins increased somewhat during the quarter. The mortgage portfolio in the Baltic countries rose by 2 per cent in local currency. A new law that will allow for mandatory amortisation requirements is in preparation. This suggests that they will be introduced in spring 2016. The requirements are expected to comply with the SFSA’s previous proposal where loans with a loan-to-value ratio of 70 per cent will have to be amortised by at least 2 per cent per year. For loans with a loan-to-value ratio of between 70 and 50 per cent, the proposal is to amortise 1 per cent per year. As Sweden’s leading mortgage lender, Swedbank wants to help its customers achieve financial stability and avoid excessive debt. As of 1 September it therefore tightened its amortisation guidelines. The guidelines are in line with the SFSA’s previous proposal. In addition, Swedbank tightened its loan requirements in the second quarter to ensure that its customers can handle an economic slowdown. The process of converting loans from Sparbanken Öresund to Swedbank is continuing. A large share of customers from Sparbanken Öresund have mortgages
  • 19. Swedbank –Interim report January-September 2015 Page 19 of 57 with other lenders. To date nearly SEK 5bn has been transferred to Swedbank. About SEK 11bn remains. Swedbank’s consumer credit volume in Sweden has risen slightly since 2014. A review is underway of product terms and processes in order to provide a faster, more efficient offering. The Baltic consumer credit portfolio grew by 7 per cent in local currency during the nine month period and margins improved. Corporate lending – development Corporate lending amounted to SEK 508bn, an increase of SEK 13bn during the nine-month period, of which SEK 2bn in the third quarter. Swedbank’s share of new corporate lending in Sweden is 34 per cent for the year, compared with an underlying market share of 19 per cent. Corporate lending in the Baltic countries grew by 3 per cent in local currency during the nine-month period to SEK 63bn. The lending portfolio in local currency grew by 4 per cent in Lithuania, 4 per cent in Estonia and 1 per cent in Latvia. The negative repo rate affects a number of corporate loan products. Older loans tied to Stibor have a negative reference rate (base rate). Interest rate floors have been introduced on new corporate loans, whereby the reference rate (Stibor) is set at 0. Save and invest Market factors The savings market is undergoing change. A demographic structure with an ageing population, coupled with greater individual responsibility for pensions and other long-term savings, is creating higher demand for savings and investment products and a great need for advisory services. Increasing digitisation and changing regulations have contributed to greater transparency and competition as well as to more standardised products, leading to price pressure. Upcoming regulations in Sweden that would prohibit commissions are one example and would mean that commissions can no longer be paid to distributors that sell products on an advisory basis. The regulations are expected to be introduced in 2017. Another trend is that customers are more willing to switch savings providers now that transfers are much easier and that they are now reacting faster to changes in the market than previously. Swedbank is positive to the debate on freer transfers of pension savings and is not averse to increased regulation to create an efficient transfer market with greater transparency for customers. A higher share of new savings is being placed in pension products and passively managed funds with lower margins. At the same time deposit margins are under pressure from low interest rates as well as the prices of other investments such as equities, fixed income funds and index-linked bonds. Swedbank is addressing margin pressure mainly through efficiencies and cost savings. Operations and market position Swedbank is the leader in deposits in its home markets. Its market share in Sweden was 20.9 per cent for private deposits and 17.9 per cent for corporate deposits. The market shares in the Baltic countries for private deposits ranged between 27 and 54 per cent and for corporate deposits between 11 and 36 per cent. The shares were highest in Estonia. Asset management is provided through Swedbank Robur in Swedbank’s four home markets as well as in Norway. In Sweden Swedbank Robur is the largest player with a market share of 22.0 per cent based on fund assets under management. Swedbank is the seventh largest life insurance company in Sweden, with a market share of about 7 per cent in terms of premium payments excluding capital transfers. The market share for transferred capital is nearly 5 per cent, putting Swedbank in fifth place. Swedbank is the largest life insurance company in Estonia, with increasing market share in 2015, and the second largest in Lithuania. As of 31 August the market shares were 40 and 22 per cent, respectively. The market share in Latvia was 20 per cent. The market shares for Baltic non-life insurance operations based on total premium income ranged between 2 and 15 per cent, with the largest share in Estonia. In homeowner’s and vehicle insurance in Estonia the market shares were 29 per cent and 25 per cent, respectively. Non-life insurance is offered in Sweden through the insurance company Tre Kronor. Deposits – development Deposits 30 Sep 31 Dec 30 Sep SEKbn 2015 2014 2014 Deposits, private 391 372 358 of which Sweden 307 289 285 of which Baltic countries 83 82 73 Deposits, corporate 343 289 309 of which Sweden 214 211 212 of which Baltic countries 69 62 57 of which other countries 60 16 40 Total 734 661 667 During the first nine months of the year deposits increased by SEK 73bn. The largest increase was in Group Treasury, where deposits from US money market funds increased by SEK 45bn. In Swedish Banking volumes increased by SEK 19bn, of which SEK 18bn from private customers. In LC&I volumes decreased by SEK 3bn. In Baltic Banking deposits in local currency increased by 5 per cent. Deposits increased in all three countries. The market share for household deposits in Sweden was unchanged at 20.9 per cent as of 31 August. Corporate deposits were stable at 17.9 per cent. Sweden accounts for just over 70 per cent of Swedbank’s total deposit volume. The product range in deposits is being simplified by reducing the number of savings account options. Asset management – development Fund assets under management amounted to SEK 709bn (715), of which SEK 678bn is attributable to the Swedish operations. Discretionary assets under management amounted to SEK 338bn (337). During the first nine months of the year Swedbank Robur had a net outflow of SEK 14bn in the Swedish fund market. Of this amount, SEK 10bn related to the third quarter, of which SEK 4bn was withdrawals by a few institutional customers. The trend from the first half- year with outflows from fixed income funds and inflows to mixed funds continued, although the outflow from fixed income funds decreased and the inflow to mixed funds levelled off. Equity funds continued to see large outflows due to stock market jitters. The net outflow
  • 20. Swedbank –Interim report January-September 2015 Page 20 of 57 from Swedbank’s equity funds was SEK 16bn during the nine-month period, of which SEK 5bn was in the third quarter. Net inflow Swedish Total Of which Robur Total Of which Robur fund market, SEKbn 2015 2015 Q3 2015 Q3 2015 Fixed income funds 17 -11 6 -6 Mixed funds 59 13 6 1 Equity funds -41 -16 -18 -5 of which index funds 10 0 1 0 Other funds 13 0 3 0 Total net inflow 48 -14 -3 -10 Swedbank’s market share of the net flow in Sweden in January-September was negative. Swedbank is also a distributor of other funds, and its share of total net sales was also negative (22 per cent for 2014), with lower sales of external funds as well. To strengthen the fund offering, management fees have been reduced on 23 actively managed funds and 11 mixed funds in 2015. Measures to simplify and develop the offering, reduce the number of funds and improve management performance are continuing. Changes were made earlier in the management process to streamline the selection of companies that the funds invest in and add a larger share of global investments. During the second quarter a new policy was adopted for responsible investing, which is being implemented in the fund offering this autumn. This primarily means influencing companies in a sustainable direction, but also eliminating companies that do not meet the sustainability criteria. The percentage of sustainable funds increased during the quarter through the launch of four funds with special sustainability criteria, which at the same time absorbed eight existing funds, four of which were ethical funds. In 2015 the return on assets has improved, as has the average rating from Morningstar. The investment savings account offering was improved during the period by having contracts and terms managed digitally. The number of new accounts increased by over 50 per cent from the beginning of the year and continues to rise, albeit at a slower rate. Asset management Jan-Sep Jan-Sep Key ratios, SEKbn 2015 2014 % Total income, SEKm 3 309 3 348 -1 Assets under management 709 677 5 of which Sweden 678 649 4 of which Baltic countries 28 24 13 of which Norway 3 3 -1 Discretionary asset management 338 319 6 Asset management income was stable for 2015 compared with the same period in 2014. The price cuts that have been implemented have squeezed income, while higher average assets under management due to a rising stock market has affected income positively. Compared with the second quarter income decreased by 7 per cent, mainly due to a declining stock market, but also to net outflows. Insurance – development Premium income Jan-Sep Jan-Sep SEKm 2015 2014 % Sweden 12 723 11 563 10 of which collective occupational pensions 3 281 3 317 -1 of which endowment insurance 6 785 5 556 22 of which occupational pensions 1 634 1 649 -1 of which risk insurance 606 558 9 of which other 418 484 -14 Baltic countries 1 063 888 20 of which life insurance 657 547 20 of which non-life insurance 406 342 19 During the period life insurance premium income in Sweden rose by 10 per cent year-on-year. Sales of corporate endowment insurance improved primarily due to new policies, but also to higher volumes from existing contracts. The decrease in collective occupational pensions mainly relates to the SAF-LO collective agreement after Swedbank decided to no longer offer traditional management products. On the other hand, capital transferred from other insurers more than doubled. Sales of life and health insurance increased. Premium income in the Baltic life insurance business rose by 16 per cent in local currency year-on-year, with the biggest gain in risk products, where demand has grown. The increase is due to a high number of contract renewals in the previous year and a further increase in new policies. Customer demand for digital solutions is on the rise. Swedbank’s electronic identification solution allows customers to obtain and revise insurance policies and file claims online. Around 31 per cent (12) of claims and 40 per cent (36) of insurance transactions are now handled online, which has made it possible to manage more cases with the same number of employees. The positive trend in premium income in Baltic non-life insurance continued. In total, premiums increased by 15 per cent in local currency. The increase related to all products, but especially homeowner’s insurance, where advertising campaigns and more active sales by bank branches led to higher volumes. Increasing online sales contributed to higher premium income primarily for travel and vehicle insurance. Sales of travel insurance sold solely online increased by around 30 per cent compared with the same period in 2014. Assets under management 30 Sep 31 Dec 30 Sep SEKbn 2015 2014 2014 Sweden 140 136 131 of which collective occupational pensions 60 58 55 of which endowment insurance 55 54 53 of which occupational pensions 16 15 14 of which other 9 9 9 Baltic countries 4 4 4 Assets under management in the Swedish insurance business decreased by nearly SEK 9bn in the third quarter to SEK 140bn due to a declining stock market. A rising stock market, coupled with net inflows, explain the year-on-year increase in assets under management as of 30 September 2015. Assets under management in the Baltic life insurance business rose by 5 per cent in local currency, mainly tied to a rising stock market, but also to net inflows.
  • 21. Swedbank –Interim report January-September 2015 Page 21 of 57 Insurance related income Jan-Sep Jan-Sep SEKm 2015 2014 % Total insurance related income 1 477 1 382 7 Sweden 1 097 1 095 0 of which life insurance 1 057 1 056 0 of which non-life insurance 40 39 4 Baltic countries 380 287 32 of which life insurance 209 130 60 of which non-life insurance 171 157 9 Swedbank’s total insurance related income rose by 7 per cent year-on-year. Income from the Swedish life insurance business was stable. Increased assets under management led to a higher result for savings products, while the risk result rose due to increased volumes and fewer claims in the group life business. Lower market interest rates had a negative effect on the result. Income from Baltic life insurance rose by 54 per cent in local currency compared with the same period in 2014. The increase is mainly due to changes in the assumptions to calculate provisions for guaranteed return products in traditional life. Income from the Baltic non-life business increased due to rising premium volumes, while a lower return on investments due to lower interest rates and increased claims affected income negatively. The claims ratio for the period rose to 57.8 per cent (54.8); the level is in line with the competition but low compared with the Swedish non-life insurance market. Pay Market factors The payment and card areas are undergoing change through both increased regulation and deregulation, which have altered customer behaviour. Many sectors are seeing more of their sales shift to online and mobile solutions. At the same time the differences between brick-and-mortar payments and online and mobile payments are being erased as more payments are made in stores using mobile devices. This trend is reinforced by the growth of mobile identification (Mobile BankID) in Sweden. The number of mobile identifications increased by 122 per cent to 50 million in the third quarter. Shared bank services are also developing strongly. Due to digitisation, globalisation and deregulation, the payment area in Swedbank’s home markets is being challenged by new international players. A new regulation, for example, requires banks, at a customer’s request, to make their accounts available to new payment providers, which is placing new demands on the banks’ infrastructure. Regulations in the payment market are also increasing demands on banks in terms of fees, stability, security and availability. The purpose of the regulations is to speed up the transition to digital payments, increase competition and not least empower customers. This puts increasing demands on cost efficiency and product development and has created a wave of consolidation in card acquiring in Europe. Operations and market position Swedbank is a leader in payment and cash management products in its four home markets. In Sweden it has a market share of 34 per cent for bank giro payments. In the Baltic countries its market shares for domestic payments range between 41 and 59 per cent and for international payments between 26 and 29 per cent, with the highest share in Estonia. In Sweden over 80 per cent of store payments are made by card and market growth is expected to remain good, with annual growth of about 9 per cent. In Estonia the corresponding figure is 50 per cent and in Latvia and Lithuania it is lower but steadily rising. In Estonia annual growth is 6 per cent, compared with between 13 and 21 per cent in Latvia and Lithuania. Swedbank issues cards to the public (card issuance) and acquires card payments from merchants via card terminals and online payments (card acquiring) in all its home markets as well as in Norway, Denmark, Finland and Poland to support the international businesses of its home market customers. Online payments are acquired in a number of other EU countries. Swedbank is Europe’s fifth largest acquirer based on the number of acquired card purchases. Market shares in the bank’s home markets range between 60 per cent (Sweden) and 33 per cent (Latvia). Swedbank is the 11th largest debit card issuer in Europe, with market shares of between 45 and 60 per cent. Payments – development Number of payments Jan-Sep Jan-Sep 2015 2014 % International payments (million) 8.6 7.8 10 of which Sweden 3.7 3.5 6 of which Baltic countries 4.9 4.3 14 Domestic payments (million) 1) 671.1 650.3 3 of which Sweden 498.0 481.8 3 of which Baltic countries 173.1 168.5 3 E-services payments (million) 2) 53.7 33.7 59 of which Sweden 35.2 17.0 of which Baltic countries 18.5 16.7 11 Other Digital solutions (million)3) 451.8 222.5 of which Sweden 438.0 211.2 of which Baltic countries 13.8 11.3 22 1) Domestic payments include salary payments, giro payments, direct debit payments, internet payments. 2) E-payments include direct debit payments, Swish, Top-up 3) Other digital solutions include e-invoices, ID transactions through E-ID and BankID The number of payments has continued to increase – a combination of economic growth and the shift from cash to cards and e-payments. Swish users among the Swedish banks now include over 3.3 million private customers and approximately 30 000 corporate customers. Payments Jan-Sep Jan-Sep Net commission income, SEKm 2015 2014 % Net commission income 646 707 -9 of which Nordic countries 303 293 3 of which Baltic countries 343 414 -17 Net payment commissions decreased by 9 per cent year-on-year. In the Nordic region income increased, mainly due to lower commission expenses. Income in the Baltic countries decreased due to the euro transition in Lithuania and a one-off effect of SEK 35m in 2014. In Estonia and Latvia income increased by 9 and 5 per cent, respectively.
  • 22. Swedbank –Interim report January-September 2015 Page 22 of 57 Cards – development Jan-Sep Jan-Sep Key ratios, cards 2015 2014 % Acquired transactions, million 1 662 1 445 15 of which Nordic countries 1 435 1 224 17 of which Baltic countries 227 220 3 Acquired volumes, SEKbn 407 353 15 of which Nordic countries 373 321 16 of which Baltic countries 35 32 9 Issued cards, millon 7.7 7.7 0 of which Nordic countries 4.0 3.9 2 of which Baltic countries 3.8 3.8 -2 Number of card purchases, million 1 072 979 9 of which Nordic countries 785 723 9 of which Baltic countries 287 256 12 Increased card usage is the main reason for transaction growth in the Nordic region and Baltic countries, along with declining cash withdrawals. The value of payments with Swedbank cards in Sweden rose by 8 per cent year-on-year at the same time that ATM withdrawals were down 6 per cent. The trend was similar in Estonia. In Lithuania, where Swedbank is actively encouraging more card payments, they increased by 22 per cent. In Latvia the increase was 15 per cent. The card issuance business saw growth of 10 per cent in corporate cards in Sweden compared with the first three quarters of 2014, with increases in both transaction volume and number of cards. The bank’s many small corporate customers offer good potential to increase this business. The number of cards issued to private customers increased by 2 per cent in Sweden and decreased slightly in the Baltic countries. E- payments with Swedbank’s debit cards in Sweden increased by 17 per cent year-on-year, compared with a gain of 8 per cent for brick-and-mortar purchases. To meet the growing demand for mobile e-commerce and make it easier for customers to use their mobile phones for more secure online purchases by card, Swedbank launched Masterpass this autumn. Masterpass makes payments digital through a copy of the card in the phone. The payment regulation reduces the interchange fee that the acquirer pays the issuer as of December 2015 and increases price competition in the acquiring business. In Sweden the interchange fee on credit cards is expected to drop from about 0.9 per cent to 0.3 per cent of the transaction value, while the change for debit cards is expected to be minor. The regulation initially means a slight increase in income, since Swedbank is a net acquirer and the compensation it pays to card issuers will be lower. Over time the price pressure in the acquiring business may increase, however, though the exact financial impact of the new regulation is difficult to assess. Interchange fees in the Baltic countries are expected to be halved on both debit and credit cards, which will squeeze income for card issuers. Swedbank is therefore reassessing its pricing. The bank benefits from being a net acquirer in the Baltic countries as well. It has also been able to benefit from the wave of consolidation in the acquiring business by expanding to neighbouring countries, with especially good results in Finland. Card related income Jan-Sep Jan-Sep SEKm 2015 2014 % Total income, SEKm 2 513 2 578 -3 of which Nordic countries 1 396 1 332 5 of which Baltic countries 667 609 9 of which Entercard1) 450 638 -29 1) Swedbank's share of the profit or loss of Entercard. Total card income decreased by 3 per cent compared with the same period in 2014 due to one-off income of SEK 230m in Entercard in 2014. The card business in the Nordic region, excluding Entercard, grew by 5 per cent; it grew by 9 per cent in the Baltic countries. Income in Sweden rose somewhat less than the transaction volume due to price pressure in the acquiring business. The increase in the Baltic countries is due to the issuance of more debit and credit cards and their increased usage. Card acquiring income rose somewhat owing to increased card usage in all four home markets and as a result of new business internationally and in the Nordic region. At the same time earnings were squeezed by continued margin pressure and higher interchange fees.
  • 23. Swedbank –Interim report January-September 2015 Page 23 of 57 Financial information - contents Group Page Income statement, condensed 24 Statement of comprehensive income, condensed 25 Key ratios 25 Balance sheet, condensed 26 Statement of changes in equity, condensed 27 Cash flow statement, condensed 28 Notes Note 1 Accounting policies 29 Note 2 Critical accounting estimates 29 Note 3 Changes in the Group structure 29 Note 4 Operating segments (business areas) 30 Note 5 Net interest income 32 Note 6 Net commission income 33 Note 7 Net gains and losses on financial items at fair value 34 Note 8 Other expenses 35 Note 9 Credit impairments 35 Note 10 Loans 36 Note 11 Impaired loans etc. 37 Note 12 Assets taken over for protection of claims and cancelled leases 37 Note 13 Credit exposures 37 Note 14 Intangible assets 38 Note 15 Amounts owed to credit institutions 39 Note 16 Deposits and borrowings from the public 39 Note 17 Debt securities in issue 39 Note 18 Derivatives 40 Note 19 Financial instruments carried at fair value 40 Note 20 Pledged collateral 43 Note 21 Offsetting financial assets and liabilities 43 Note 22 Capital adequacy consolidated situation 44 Note 23 Internal capital requirement 47 Note 24 Risks and uncertainties 47 Note 25 Business combinations 48 Note 26 Discontinued operations 49 Note 27 Related-party transactions 50 Note 28 Swedbank’s share 50 Parent company Income statement, condensed 51 Statement of comprehensive income, condensed 51 Balance sheet, condensed 52 Statement of changes in equity, condensed 53 Cash flow statement, condensed 53 Capital adequacy 54 More detailed information can be found in Swedbank’s fact book, www.swedbank.com/ir, under Financial information and publications.
  • 24. Swedbank –Interim report January-September 2015 Page 24 of 57 Income statement, condensed Group Q3 Q2 Q3 Jan-Sep Jan-Sep SEKm 2015 2015 % 2014 % 2015 2014 % Interest income 8 645 8 819 -2 10 343 -16 26 880 31 343 -14 Interest expenses -2 834 -3 115 -9 -4 514 -37 -9 646 -14 510 -34 Net interest income (note 5) 5 811 5 704 2 5 829 0 17 234 16 833 2 Commission income 4 111 4 240 -3 4 150 -1 12 385 12 084 2 Commission expenses -1 375 -1 398 -2 -1 334 3 -4 063 -3 762 8 Net commission income (note 6) 2 736 2 842 -4 2 816 -3 8 322 8 322 0 Net gains and losses on financial items at fair value (note 7) 4 82 -95 799 -99 406 1 917 -79 Insurance premiums 464 504 -8 422 10 1 495 1 386 8 Insurance provisions -301 -337 -11 -299 1 -980 -979 0 Net insurance 163 167 -2 123 33 515 407 27 Share of profit or loss of associates 201 228 -12 221 -9 708 887 -20 Other income 319 292 9 362 -12 982 1 559 -37 Total income 9 234 9 315 -1 10 150 -9 28 167 29 925 -6 Staff costs 2 257 2 375 -5 2 469 -9 7 104 7 807 -9 Other expenses (note 8) 1 458 1 500 -3 1 508 -3 4 475 4 964 -10 Depreciation/amortisation 164 172 -5 187 -12 515 538 -4 Total expenses 3 879 4 047 -4 4 164 -7 12 094 13 309 -9 Profit before impairments 5 355 5 268 2 5 986 -11 16 073 16 616 -3 Impairment of intangible assets (note 14) 254 0 0 254 1 Impairment of tangible assets 16 22 -27 19 -16 53 223 -76 Credit impairments (note 9) 130 6 235 -45 195 165 18 Operating profit 4 955 5 240 -5 5 732 -14 15 571 16 227 -4 Tax expense 1 012 1 538 -34 1 164 -13 3 651 3 301 11 Profit for the period from continuing operations 3 943 3 702 7 4 568 -14 11 920 12 926 -8 Profit for the period from discontinued operations, after tax -11 -32 -66 -2 6 -259 Profit for the period 3 932 3 670 7 4 566 -14 11 926 12 667 -6 Profit for the period attributable to the shareholders of Swedbank AB 3 928 3 666 7 4 560 -14 11 914 12 652 -6 of which profit for the period from continuing operations 3 939 3 698 7 4 562 -14 11 908 12 911 -8 of which profit for the period from discontinued operations -11 -32 -66 -2 6 -259 Non-controlling interests 4 4 0 6 -33 12 15 -20 of which profit for the period from continuing operations 4 4 0 6 -33 12 15 -20 of which profit for the period from discontinued operations 0 0 0 0 0 SEK Earnings per share, continuing operations, SEK 3.57 3.34 4.14 10.78 11.72 after dilution 3.52 3.32 4.10 10.68 11.63 Earnings per share, discontinued operations, SEK -0.01 -0.02 0.00 0.01 -0.23 after dilution -0.01 -0.02 0.00 0.01 -0.23 Earnings per share, total operations, SEK 3.56 3.32 4.14 10.79 11.49 after dilution 3.51 3.30 4.10 10.69 11.40
  • 25. Swedbank –Interim report January-September 2015 Page 25 of 57 Statement of comprehensive income, condensed Group Q3 Q2 Q3 Jan-Sep Jan-Sep SEKm 2015 2015 % 2014 % 2015 2014 % Profit for the period reported via income statement 3 932 3 670 7 4 566 -14 11 926 12 667 -6 Items that will not be reclassified to the income statement Remeasurements of defined benefit pension plans 755 4 192 -82 -1 090 2 497 -974 Share related to associates 11 122 -91 -28 60 -41 Income tax -168 -949 -82 246 -562 224 Total 598 3 365 -82 -872 1 995 -791 Items that may be reclassified to the income statement Exchange differences, foreign operations Gains/losses arising during the period 841 -257 -225 -486 997 Reclassification adjustments to income statement, profit for the period from discontinued operation 0 0 0 0 508 Hedging of net investments in foreign operations: 0 0 0 0 0 Gains/losses arising during the period -570 242 140 511 -861 Reclassification adjustments to income statement, profit for the period from discontinued operations 0 0 0 0 -365 Cash flow hedges: 0 0 0 0 0 Gains/losses arising during the period 13 36 -64 69 -81 161 -7 Reclassification adjustments to income statement, net interest income 7 -3 -23 7 -14 Share of other comprehensive income of associates -93 -24 45 -93 74 Income tax Income tax 124 -64 -44 -148 190 Reclassification adjustments to income statement, tax -2 1 5 0 -2 3 Reclassification adjustments to income statement, profit for the period from discontinued operations 0 0 0 0 0 80 Total 320 -69 -33 -50 605 Other comprehensive income for the period, net of tax 918 3 296 -72 -905 1 945 -186 Total comprehensive income for the period 4 850 6 966 -30 3 661 32 13 871 12 481 11 Total comprehensive income attributable to the shareholders of Swedbank AB 4 846 6 962 -30 3 655 33 13 858 12 466 11 Non-controlling interests 4 4 0 6 -33 13 15 -13 For 2015 income of SEK 1 995m (-791) has been recognised in other comprehensive income after tax, including remeasurements of defined benefit pension plans in associates. The 2015 income arose primarily because market interest rates rose from the beginning of the year. For the period as a whole interest rates were volatile and reached very low levels soon after the first quarter ended. As of 30 September, however, the discount rate, which is used to calculate the closing pension obligation, was raised to 3.08% from 2.29%. The market’s future inflation expectations also rose and the inflation assumption was raised to 1.43% from 1.28%. The changes in both of these assumptions were the main reason why the defined benefit pension obligation decreased. The market value of the assets under management exceeded the obligation by SEK 134m. For 2015 an exchange difference of SEK -486m (997) was recognised for the Group's foreign net investments in subsidiaries. In addition, an exchange rate difference of SEK -94m for the Group's foreign net investments in associates is included in Share related to associates. The losses related to subsidiaries mainly arose because the Swedish krona appreciated against the euro. The total loss of SEK 580m is not taxable. Since the large part of the Group's foreign net assets is hedged against currency risk, a gain of SEK 511m (-861) before tax arose related to the hedging instruments. The revaluation of defined benefit pension plans and translation of net investments in foreign operations can be volatile in certain periods due to movements in the discount rate, inflation and exchange rates. Key ratios Group Q3 Q2 Q3 Jan-Sep Jan-Sep 2015 2015 % 2014 % 2015 2014 % Equity per share, SEK 107.54 103.08 101.08 107.54 101.08 Return on equity, continuing operations, % 13.5 13.5 16.6 13.8 15.9 Return on equity, total operations, % 13.5 13.4 16.6 13.8 15.6 Credit impairment ratio, % 0.04 0.00 0.07 0.02 0.02