SlideShare ist ein Scribd-Unternehmen logo
1 von 4
Downloaden Sie, um offline zu lesen
Purchasing Managers’ Index                                                                                                                  November 1, 2011


PMI climbs to 49.8 in October 2011 – mixed signals as to
where the industrial economy is headed
 The PMI rose from 48.1 in September to 49.8 in October. This increase
  notwithstanding, the index has remained beneath the 50 mark – the boundary
  between growth and contraction in industry – for the past three months (August-
  October). The industrial economy has thus weakened considerably since the May-
  July three month period.

 The component index for new orders accounted for the most significant positive
  contribution to the PMI. Both new orders and employment landed above the 50
  mark, which indicates that the decline in the industrial economy leveled off
  somewhat in October.

 Industrial companies continue to revise their production plans downward, though not
  as much as during the previous three month period. Plans remain geared toward
  expansion, but are more modest than before. Combined with inventory reductions,
  this indicates that companies are preparing for a weaker economy.

 Price pressure from producers continues to drop, and more sharply at that. The
  index for commodity and intermediate goods prices fell from 47.0 in September to
  39.9 in October, which was consistent with the drop in commodity prices, as well as
  the outlook for economic cooling.
 75

                                       PMI Original and Seasonally Adjusted
 70                                                                                                                                                PMI
 65
                                                                                                                                            (Purchasing Managers’
                                                                                                                                                   Index)
 60                                                                                                                                         Seasonally adjusted
                                                                                                                                            2011 Oct.     49.8
 55
                                                                                                                                                 Sep.     48.1
 50                                                                                                                                              Aug.     48.7
                                                                                                                                                 Jul.     50.1
 45                                                                                                                                              Jun.     52.9
                                                                                                                                                 May      56.1
 40
                                                                   PMI Original                                                                  Apr.     59.8
 35
                                                                   Seasonally Adjusted                                                           Mar.     58.6
                                                                                                                                                 Feb.     60.9
 30                                                                                                                                              Jan.     61.5
                                                                                                                                            2010 Dec.     60.2
 25
      Jan Jul Jan Jul Jan Jul Jan Jul Jan Jul Jan Jul Jan Jul Jan Jul Jan Jul Jan Jul Jan Jul Jan Jul Jan Jul Jan Jul Jan Jul Jan Jul Jan        Nov.     61.3
      94   95     96      97      98      99     2000    2001    2002    2003     2004   2005    2006    2007    2008    2009    2010 11
                                                                                                                                                 Oct.     61.8
                                       Next publication of Purchasing Managers’ Index: December 1, 2011.


                       Cecilia Hermansson, Swedbank, Economic Research Department, +46 (0)8-5859 7720
                                    Administration, +46 (0)8-5859 7740, ek.sekr@swedbank.se
                                 Sebastian Bergfelt, Silf, +46 (0)73-944 6450, professionals@silf.se
                                                                  1 (4)
Purchasing Managers Index
                                      concerning October 2011, continued


Silf/Swedbanks’ Purchasing Managers’ Index. seasonally adjusted
           PMI     Components of PMI                       Other indices                               Forecast

           Total   New      Produc-   Employ-   Delivery                 Export   Domestic Back-log                    Planned
           Index   orders   tion      ment      times      Inventories   orders   orders   of orders   Prices   Import Production

2008 Jul   48.6    46.0     53.6      45.5      50.4       53.1          46.6     44.6    42.7         76.8     58.5       58.7
     Aug   46.4    42.7     47.8      44.2      51.0       49.1          44.0     43.3    43.0         70.2     51.2       49.5
     Sep   42.3    38.7     41.3      42.6      42.5       45.4          40.9     38.0    39.7         55.1     48.7       47.4
     Oct   39.0    34.8     39.1      39.8      35.9       45.7          37.0     35.4    36.0         38.2     44.5       39.5
     Nov   33.1    26.0     31.0      36.5      31.0       43.6          29.4     25.8    28.1         29.4     37.5       31.8
     Dec   32.7    26.1     31.0      33.5      28.6       38.9          26.3     23.3    25.7         27.9     32.3       26.3

2009 Jan   33.8    29.0     33.3      32.1      30.3       41.8          34.2     27.9    25.9         29.1     35.5       32.9
     Feb   33.9    28.8     34.0      31.0      28.4       36.6          29.7     30.5    29.7         30.4     33.5       35.8
     Mar   36.7    35.1     38.8      31.1      28.0       39.6          39.7     35.5    30.8         27.7     38.5       38.2
     Apr   38.8    41.5     39.4      28.3      29.6       35.9          45.3     37.7    39.7         30.6     38.8       42.4
     May   43.7    46.4     47.4      31.1      34.2       33.5          47.5     44.1    42.8         32.7     41.0       47.3
     Jun   50.5    54.7     55.8      36.0      42.4       34.0          54.4     49.2    47.4         43.3     47.3       55.2
     Jul   54.3    60.5     61.0      40.3      44.4       38.4          56.4     58.1    54.1         46.9     51.0       59.1
     Aug   52.4    57.8     56.1      40.6      46.4       40.4          61.1     50.1    54.3         52.6     50.7       61.7
     Sep   55.9    59.2     60.5      45.0      53.7       40.6          61.1     55.0    54.0         54.5     55.7       63.3
     Oct   56.7    60.8     61.7      43.8      56.2       41.6          60.7     55.8    58.9         56.7     55.8       62.2
     Nov   56.0    57.9     59.0      48.7      55.0       41.3          59.7     53.6    53.6         59.8     57.0       62.2
     Dec   58.2    63.7     59.7      49.5      56.3       42.7          58.1     66.3    56.6         57.3     59.0       67.4

2010 Jan   61.7    66.8     70.2      49.6      61.5       48.3          62.3     64.8    62.6         61.2     61.3       69.5
     Feb   61.5    67.5     65.3      55.0      61.4       53.6          62.7     63.6    64.2         61.3     59.7       68.1
     Mar   61.1    63.8     63.7      54.9      67.0       50.2          62.3     58.9    60.6         65.7     62.3       69.6
     Apr   64.0    68.1     66.3      56.6      68.3       46.0          64.6     63.2    62.5         75.6     60.3       77.5
     May   66.0    68.8     71.0      60.1      71.5       50.7          62.6     64.1    64.3         71.0     59.9       73.0
     Jun   62.4    61.1     66.8      60.3      69.2       50.4          57.4     60.1    60.9         71.1     59.5       73.1
     Jul   64.2    67.3     72.2      56.3      66.4       51.4          61.4     63.2    63.4         70.9     60.9       72.0
     Aug   60.6    61.8     61.9      60.5      64.5       52.0          57.4     58.7    59.7         68.5     56.1       72.4
     Sep   63.3    65.8     67.4      60.3      66.3       52.9          61.4     62.9    62.2         71.1     58.6       70.8
     Oct   61.8    63.0     63.5      59.0      66.8       47.9          61.6     58.2    61.7         66.4     59.3       72.4
     Nov   61.3    60.4     64.2      60.2      67.2       50.2          58.9     56.3    58.2         70.8     61.4       72.5
     Dec   60.2    63.6     62.8      57.1      64.5       55.5          60.5     63.6    59.5         71.9     59.7       74.0

2011 Jan   61.5    64.2     64.9      57.7      64.6       51.9          61.9     62.1    60.2         77.1     58.6       70.9
     Feb   60.9    59.5     65.0      61.1      67.2       54.4          58.8     56.3    58.0         77.1     60.2       71.0
     Mar   58.6    56.1     61.4      58.3      66.0       52.0          54.7     54.0    54.3         73.8     58.9       71.6
     Apr   59.8    61.5     61.9      57.7      65.1       54.6          58.3     56.9    57.3         74.5     58.5       70.5
     May   56.1    55.4     59.8      54.4      61.0       55.6          52.8     56.4    55.3         63.5     56.2       69.1
     Jun   52.9    52.3     54.0      51.3      58.1       51.4          52.5     48.8    51.0         60.5     52.2       64.5
     Jul   50.1    45.4     49.4      53.7      55.4       50.1          46.9     43.4    49.1         51.5     50.4       63.1
     Aug   48.7    47.0     48.6      50.9      49.1       51.5          48.0     42.3    47.9         47.4     48.5       55.8
     Sep   48.1    46.5     48.9      50.0      47.5       52.0          48.3     46.2    47.0         47.0     45.8       53.8
     Oct   49.8    50.5     48.2      50.7      47.8       47.1          48.9     49.1    48.9         39.9     46.8       53.6
Purchasing Managers Index
                                      concerning October 2011, continued


Silf/Swedbanks’ Purchasing Managers’ Index
           PMI     Components of PMI                                     Other indices                          Forecast

           Total   New-     Produc-   Employ-   Delivery                 Export   Domestic Back-log                    Planned
           Index   orders   tion      ment      times      Inventories   orders   orders   of orders   Prices   Import Production

2008 Jul   43.8    39.6     42.1      45.6      51.8       54.9          42.5     38.6    40.9         75.0     53.1       57.4
     Aug   49.3    46.7     53.6      44.7      52.7       49.7          46.2     47.7    47.7         69.9     53.4       51.0
     Sep   43.2    38.5     43.4      43.4      44.0       44.7          40.1     39.3    38.8         55.6     49.7       45.8
     Oct   37.7    31.9     37.8      38.9      35.7       44.0          33.8     33.6    31.3         36.6     42.5       36.0
     Nov   30.7    21.8     27.9      35.2      28.8       41.1          25.7     22.9    22.9         25.3     35.3       28.8
     Dec   28.6    20.2     24.8      30.6      24.6       35.1          21.5     17.9    19.9         22.9     28.9       24.3

2009 Jan   31.7    27.6     30.5      29.4      26.3       40.1          34.0     25.2    24.7         26.9     34.0       33.9
     Feb   34.8    32.0     35.3      29.9      26.3       35.2          33.1     32.1    32.5         29.7     33.7       38.2
     Mar   38.3    38.7     42.1      30.5      27.5       40.5          42.8     37.5    34.2         28.2     40.6       40.7
     Apr   41.1    44.8     43.2      29.7      30.6       36.8          47.8     40.4    42.6         34.1     40.6       45.1
     May   45.8    49.0     50.3      33.1      36.5       35.3          49.6     46.6    45.9         36.5     43.2       48.3
     Jun   53.9    59.4     60.8      39.1      45.5       37.3          58.3     53.5    50.3         45.1     50.0       54.6
     Jul   50.7    55.7     51.3      40.8      46.9       40.7          53.5     53.6    53.1         47.4     47.3       59.2
     Aug   56.2    62.9     62.9      41.9      49.3       41.5          64.6     55.3    60.2         54.5     53.9       64.7
     Sep   57.7    59.9     63.6      46.7      56.6       40.4          61.2     57.1    54.0         57.0     57.8       62.9
     Oct   56.1    58.6     61.1      43.6      57.2       40.4          58.1     54.7    55.0         56.8     54.7       59.6
     Nov   53.9    53.8     56.1      48.1      53.5       39.3          56.1     50.8    48.5         56.9     55.4       59.5
     Dec   54.2    57.9     53.5      47.2      52.8       39.3          61.6     52.8    50.8         52.8     56.0       65.7

2010 Jan   59.7    65.4     67.7      47.2      57.9       49.2          61.7     62.3    61.5         59.4     60.1       70.6
     Feb   62.2    70.4     66.3      54.3      59.4       52.9          65.5     65.0    66.9         60.6     59.8       70.2
     Mar   62.4    66.7     66.4      54.5      66.6       51.4          64.8     60.3    63.4         66.1     64.2       71.6
     Apr   66.0    70.9     69.6      58.0      69.2       46.8          66.6     65.4    64.9         79.3     61.7       79.9
     May   67.8    70.8     73.6      62.1      73.6       52.5          64.0     66.1    66.9         74.4     61.6       73.4
     Jun   65.3    64.9     71.2      63.2      71.8       53.6          60.4     63.7    63.2         72.5     61.6       72.0
     Jul   60.3    62.1     62.4      56.3      68.2       53.6          58.0     58.4    62.1         70.8     56.8       71.6
     Aug   63.9    66.3     68.0      61.5      66.7       53.0          60.4     63.4    65.1         69.7     58.7       75.0
     Sep   64.8    66.2     70.2      61.7      68.7       52.6          61.4     64.9    61.9         73.2     60.3       70.0
     Oct   60.9    60.5     62.5      58.4      67.3       46.3          58.9     56.6    57.6         65.8     57.9       69.5
     Nov   58.9    55.9     61.0      59.4      65.3       47.9          55.2     53.1    52.8         67.6     59.7       69.6
     Dec   56.0    57.6     56.2      54.3      60.5       52.1          55.9     58.3    53.4         67.2     56.6       72.2

2011 Jan   59.4    62.7     62.3      54.9      60.6       50.7          61.5     59.6    59.0         75.3     57.3       71.7
     Feb   61.5    62.2     65.9      60.3      65.0       53.7          61.6     57.4    60.5         76.4     60.3       72.8
     Mar   59.6    58.6     63.9      57.6      65.4       53.1          56.9     55.1    56.8         74.0     60.8       73.4
     Apr   61.7    64.3     65.0      58.9      65.8       55.4          60.3     59.0    59.6         78.1     59.9       72.8
     May   57.7    57.3     62.3      56.1      62.9       57.5          54.0     58.4    57.8         66.2     57.8       69.4
     Jun   55.6    56.1     58.1      54.1      59.9       54.8          55.8     52.4    53.7         61.8     54.0       63.1
     Jul   45.8    39.7     39.2      53.5      56.9       52.0          43.1     38.1    47.5         50.5     46.0       62.4
     Aug   51.7    51.3     54.4      51.7      50.7       52,4          50.7     46.6    53.0         47.7     50.7       57.8
     Sep   49.4    46.8     51.6      51.3      49.4       51.6          48.1     48.1    46.5         48.4     47.1       52.5
     Oct   48.9    48.1     47.1      50.0      48.1       45.1          46.2     47.7    44.9         38.5     45.2       50.3
Purchasing Managers Index
                                    concerning October 2011, continued


Silf / Swedbank’s Purchasing Managers’ Index (PMI)
– goals and methodology
History                     Silf (previously I&L) and Swedbank AB, publ, (formerly Sparbanken
                            Sverige) made the first joint – internal – calculation of the “Purchasing
                            Managers’ Index” for the five component indices in December 1994.
                            Exactly one year later the index figures were published for the first time.
                            The model for what was then known as the ICI (now the PMI,
                            Purchasing Managers’ Index) was the NAPM index – one of the USA’s
                            most important and most well known economic indicators. The NAPM
                            index has existed since 1931 and was subsequently renamed PMI (or
                            ISM index).
Participants                About 200 purchasing managers in the manufacturing industry.
Publication                 First business day of every month, 8:30 a.m.
Survey period               Comparison with the previous month.
Composition                 New orders (in manager’s own company)            30
of PMI (%)                  Production (same as above)                       25
                            Employment (same as above)                       20
                            Suppliers’ delivery times                        15
                            Inventories (purchased material)                 10

Other ratios                New export orders
(not included in PMI)       New domestic orders
                            Order Backlogs
                            Suppliers’ commodity and intermediate goods prices
                            Imports
                            Production plans for the next six months

Goals                       Quick economic indicator
                            Simple statistics and ease of interpretation
                            Statistics with relatively short publication intervals
                            Constant contact with well-informed professional group

Calculation                 Same as for calculating a diffusion index. Positive changes are noted in
                            percent for the five component indexes. The percentage of unchanged
                            replies, multiplied by 0.5, is added to this figure. Then the different
                            component indices are weighted as described above to calculate the
                            total index. The Purchasing Managers’ Index does not indicate activity
                            levels but rather monthly changes in industrial activity. The seasonally
                            adjusted figures are shown first.
”Break even”                The dividing line between growth and contraction in the industrial
                            economy has – in line with American practice – been set at 50.
                            However, this figure should not be interpreted as a precise boundary or
                            “neutral growth zone.” A PMI index level of 49.7 or 50.3 would not
                            indicate a particularly different economic situation.


  We believe we have used reliable sources and procedures to generate and analyze the Purchasing
  Managers’ Index (ICI/PMI). However, Swedbank AB (publ) and Silf cannot guarantee the accuracy or
  completeness of the analyses and cannot be responsible for any errors or omissions in the basic data or
  processing thereof. Readers are encouraged to base any decisions on other sources as well.
  Neither Swedbank, Silf nor their employees or other associates shall be deemed liable for loss or damage,
  direct or indirect, arising from any errors or omissions in analyses reported in the Purchasing Managers’
  Index.

Weitere ähnliche Inhalte

Was ist angesagt?

Purchasing Managers´Index Report, November 2011
Purchasing Managers´Index Report, November 2011Purchasing Managers´Index Report, November 2011
Purchasing Managers´Index Report, November 2011
Swedbank
 
Purchasing Managers' Index May 2012
Purchasing Managers' Index May 2012Purchasing Managers' Index May 2012
Purchasing Managers' Index May 2012
Swedbank
 
corning annual reports 2000
corning annual reports 2000corning annual reports 2000
corning annual reports 2000
finance35
 

Was ist angesagt? (10)

Purchasing Managers´Index Report, July 2011
Purchasing Managers´Index Report, July 2011Purchasing Managers´Index Report, July 2011
Purchasing Managers´Index Report, July 2011
 
Purchasing Managers' Index April 2012
Purchasing Managers' Index April 2012Purchasing Managers' Index April 2012
Purchasing Managers' Index April 2012
 
Purchasing Managers´Index Report, November 2011
Purchasing Managers´Index Report, November 2011Purchasing Managers´Index Report, November 2011
Purchasing Managers´Index Report, November 2011
 
Purchasing Managers´Index Report, May 2011
Purchasing Managers´Index Report, May 2011Purchasing Managers´Index Report, May 2011
Purchasing Managers´Index Report, May 2011
 
Purchasing Managers' Index May 2012
Purchasing Managers' Index May 2012Purchasing Managers' Index May 2012
Purchasing Managers' Index May 2012
 
Purchasing Managers' Index - September 3, 2012
Purchasing Managers' Index - September 3, 2012Purchasing Managers' Index - September 3, 2012
Purchasing Managers' Index - September 3, 2012
 
Purchasing Managers´Index Report, March 2011
Purchasing Managers´Index Report, March 2011Purchasing Managers´Index Report, March 2011
Purchasing Managers´Index Report, March 2011
 
Purchasing Managers' Index Services - September 5, 2012
Purchasing Managers' Index Services -  September 5, 2012Purchasing Managers' Index Services -  September 5, 2012
Purchasing Managers' Index Services - September 5, 2012
 
Purchasing Managers´ Index Services, August 2011
Purchasing Managers´ Index Services, August 2011Purchasing Managers´ Index Services, August 2011
Purchasing Managers´ Index Services, August 2011
 
corning annual reports 2000
corning annual reports 2000corning annual reports 2000
corning annual reports 2000
 

Andere mochten auch (8)

Swedbanks företagspresentation kvartal 3 2013
Swedbanks företagspresentation kvartal 3 2013Swedbanks företagspresentation kvartal 3 2013
Swedbanks företagspresentation kvartal 3 2013
 
Purchasing Managers´Index Report, June 2011
Purchasing Managers´Index Report, June 2011Purchasing Managers´Index Report, June 2011
Purchasing Managers´Index Report, June 2011
 
The Global Economy, No. 3/2011
The Global Economy, No. 3/2011The Global Economy, No. 3/2011
The Global Economy, No. 3/2011
 
Swedbank Corporate Presentation 30 June 2011
Swedbank Corporate Presentation 30 June 2011Swedbank Corporate Presentation 30 June 2011
Swedbank Corporate Presentation 30 June 2011
 
Swedbank Analysis Lithuania, May 30, 2011
Swedbank Analysis Lithuania, May 30, 2011Swedbank Analysis Lithuania, May 30, 2011
Swedbank Analysis Lithuania, May 30, 2011
 
The Estonian Economy, No 5, September 27, 2011
The Estonian Economy, No 5, September 27, 2011The Estonian Economy, No 5, September 27, 2011
The Estonian Economy, No 5, September 27, 2011
 
Swedbank företagspresentation, 25 oktober 2016
Swedbank företagspresentation, 25 oktober 2016Swedbank företagspresentation, 25 oktober 2016
Swedbank företagspresentation, 25 oktober 2016
 
Swedbank Corporate Presentation, October 25 2016
Swedbank Corporate Presentation, October 25 2016Swedbank Corporate Presentation, October 25 2016
Swedbank Corporate Presentation, October 25 2016
 

Ähnlich wie Purchasing Managers´Index Report, October 2011

Purchasing Managers' Index
Purchasing Managers' IndexPurchasing Managers' Index
Purchasing Managers' Index
Swedbank
 
Energy & Commodities
Energy & CommoditiesEnergy & Commodities
Energy & Commodities
Swedbank
 

Ähnlich wie Purchasing Managers´Index Report, October 2011 (20)

Purchasing Managers' Index Services - April 2012
Purchasing Managers' Index Services - April 2012Purchasing Managers' Index Services - April 2012
Purchasing Managers' Index Services - April 2012
 
Purchasing Managers' Index Services - February 2012
Purchasing Managers' Index Services - February 2012Purchasing Managers' Index Services - February 2012
Purchasing Managers' Index Services - February 2012
 
Purchasing Managers´ Index Services, October 2011
Purchasing Managers´ Index Services, October 2011Purchasing Managers´ Index Services, October 2011
Purchasing Managers´ Index Services, October 2011
 
Purchasing Managers´ Index Services, September 2011
Purchasing Managers´ Index Services, September 2011Purchasing Managers´ Index Services, September 2011
Purchasing Managers´ Index Services, September 2011
 
Purchasing Managers´ Index Services, July 2011
Purchasing Managers´ Index Services, July 2011Purchasing Managers´ Index Services, July 2011
Purchasing Managers´ Index Services, July 2011
 
Purchasing Managers' Index Report August 2009
Purchasing Managers' Index Report August 2009Purchasing Managers' Index Report August 2009
Purchasing Managers' Index Report August 2009
 
Purchasing Managers' Index Report October 2009
Purchasing Managers' Index Report October 2009Purchasing Managers' Index Report October 2009
Purchasing Managers' Index Report October 2009
 
Purchasing Managers' Index Report December 2009
Purchasing Managers' Index Report December 2009Purchasing Managers' Index Report December 2009
Purchasing Managers' Index Report December 2009
 
Purchasing Managers' Index Report July 2009
Purchasing Managers' Index Report July 2009Purchasing Managers' Index Report July 2009
Purchasing Managers' Index Report July 2009
 
Purchasing Managers´Index Report, February 2011
Purchasing Managers´Index Report, February 2011Purchasing Managers´Index Report, February 2011
Purchasing Managers´Index Report, February 2011
 
Purchasing Managers Index Report 2010 January
Purchasing Managers Index Report 2010 JanuaryPurchasing Managers Index Report 2010 January
Purchasing Managers Index Report 2010 January
 
Purchasing Managers' Index Report 2010 February
Purchasing Managers' Index Report 2010 FebruaryPurchasing Managers' Index Report 2010 February
Purchasing Managers' Index Report 2010 February
 
Purchasing Managers' Index
Purchasing Managers' IndexPurchasing Managers' Index
Purchasing Managers' Index
 
Purchasing Managers' Index, 2010 March
Purchasing Managers' Index, 2010 MarchPurchasing Managers' Index, 2010 March
Purchasing Managers' Index, 2010 March
 
Purchasing Managers' Index Report May 2009
Purchasing Managers' Index Report May 2009Purchasing Managers' Index Report May 2009
Purchasing Managers' Index Report May 2009
 
Purchasing Managers' Index Report May 2010
Purchasing Managers' Index Report May 2010Purchasing Managers' Index Report May 2010
Purchasing Managers' Index Report May 2010
 
Purchasing Managers' Index Report November 2009
Purchasing Managers' Index Report November 2009Purchasing Managers' Index Report November 2009
Purchasing Managers' Index Report November 2009
 
Energy & Commodities
Energy & CommoditiesEnergy & Commodities
Energy & Commodities
 
Purchasing Managers' Index December 2010
Purchasing Managers' Index December 2010Purchasing Managers' Index December 2010
Purchasing Managers' Index December 2010
 
Purchasing Managers´ Index Services, May 2011
Purchasing Managers´ Index Services, May 2011Purchasing Managers´ Index Services, May 2011
Purchasing Managers´ Index Services, May 2011
 

Mehr von Swedbank

Mehr von Swedbank (20)

Swedbank corporate presentation April 25 2017
Swedbank corporate presentation April 25 2017Swedbank corporate presentation April 25 2017
Swedbank corporate presentation April 25 2017
 
Swedbank foretagspresentation 25 april 2017
Swedbank foretagspresentation 25 april 2017Swedbank foretagspresentation 25 april 2017
Swedbank foretagspresentation 25 april 2017
 
Delårsrapport kv1 2017
Delårsrapport kv1 2017Delårsrapport kv1 2017
Delårsrapport kv1 2017
 
Interim report q1 2017
Interim report q1 2017Interim report q1 2017
Interim report q1 2017
 
Year end report 2016
Year end report 2016Year end report 2016
Year end report 2016
 
Bokslutskommuniké 2016
Bokslutskommuniké 2016Bokslutskommuniké 2016
Bokslutskommuniké 2016
 
Swedbank företagspresentation, 2 februari 2017
Swedbank företagspresentation, 2 februari 2017Swedbank företagspresentation, 2 februari 2017
Swedbank företagspresentation, 2 februari 2017
 
Swedbank corporate presentation, February 2 2017
Swedbank corporate presentation, February 2 2017Swedbank corporate presentation, February 2 2017
Swedbank corporate presentation, February 2 2017
 
Swedbank Corporate Presentation, June 30 2016
Swedbank Corporate Presentation, June 30 2016Swedbank Corporate Presentation, June 30 2016
Swedbank Corporate Presentation, June 30 2016
 
Swedbank företagspresentation, 30 juni 2016
Swedbank företagspresentation, 30 juni 2016Swedbank företagspresentation, 30 juni 2016
Swedbank företagspresentation, 30 juni 2016
 
Swedbank corporate presentation Q1, 2016
Swedbank corporate presentation Q1, 2016Swedbank corporate presentation Q1, 2016
Swedbank corporate presentation Q1, 2016
 
Swedbank företagspresentation kvartal 1, 2016.
Swedbank företagspresentation kvartal 1, 2016.Swedbank företagspresentation kvartal 1, 2016.
Swedbank företagspresentation kvartal 1, 2016.
 
Swedbank corporate presentation Q4, 2015
Swedbank corporate presentation Q4, 2015Swedbank corporate presentation Q4, 2015
Swedbank corporate presentation Q4, 2015
 
Swedbank företagspresentation kvartal 4,2015
Swedbank företagspresentation kvartal 4,2015Swedbank företagspresentation kvartal 4,2015
Swedbank företagspresentation kvartal 4,2015
 
Year end report 2015
Year end report 2015Year end report 2015
Year end report 2015
 
Bokslutskommuniké 2015
Bokslutskommuniké 2015Bokslutskommuniké 2015
Bokslutskommuniké 2015
 
Swedbank Företagspresentation, September 2015
Swedbank Företagspresentation, September 2015Swedbank Företagspresentation, September 2015
Swedbank Företagspresentation, September 2015
 
Swedbank Corporate Presentation, September 2015
Swedbank Corporate Presentation, September 2015Swedbank Corporate Presentation, September 2015
Swedbank Corporate Presentation, September 2015
 
Swedbank's third quarter 2015 results
Swedbank's third quarter 2015 resultsSwedbank's third quarter 2015 results
Swedbank's third quarter 2015 results
 
Swedbank Interim report third quarter 2015
Swedbank Interim report third quarter 2015Swedbank Interim report third quarter 2015
Swedbank Interim report third quarter 2015
 

Kürzlich hochgeladen

VIP Independent Call Girls in Bandra West 🌹 9920725232 ( Call Me ) Mumbai Esc...
VIP Independent Call Girls in Bandra West 🌹 9920725232 ( Call Me ) Mumbai Esc...VIP Independent Call Girls in Bandra West 🌹 9920725232 ( Call Me ) Mumbai Esc...
VIP Independent Call Girls in Bandra West 🌹 9920725232 ( Call Me ) Mumbai Esc...
dipikadinghjn ( Why You Choose Us? ) Escorts
 
VIP Independent Call Girls in Andheri 🌹 9920725232 ( Call Me ) Mumbai Escorts...
VIP Independent Call Girls in Andheri 🌹 9920725232 ( Call Me ) Mumbai Escorts...VIP Independent Call Girls in Andheri 🌹 9920725232 ( Call Me ) Mumbai Escorts...
VIP Independent Call Girls in Andheri 🌹 9920725232 ( Call Me ) Mumbai Escorts...
dipikadinghjn ( Why You Choose Us? ) Escorts
 
20240429 Calibre April 2024 Investor Presentation.pdf
20240429 Calibre April 2024 Investor Presentation.pdf20240429 Calibre April 2024 Investor Presentation.pdf
20240429 Calibre April 2024 Investor Presentation.pdf
Adnet Communications
 

Kürzlich hochgeladen (20)

TEST BANK For Corporate Finance, 13th Edition By Stephen Ross, Randolph Weste...
TEST BANK For Corporate Finance, 13th Edition By Stephen Ross, Randolph Weste...TEST BANK For Corporate Finance, 13th Edition By Stephen Ross, Randolph Weste...
TEST BANK For Corporate Finance, 13th Edition By Stephen Ross, Randolph Weste...
 
Stock Market Brief Deck (Under Pressure).pdf
Stock Market Brief Deck (Under Pressure).pdfStock Market Brief Deck (Under Pressure).pdf
Stock Market Brief Deck (Under Pressure).pdf
 
02_Fabio Colombo_Accenture_MeetupDora&Cybersecurity.pptx
02_Fabio Colombo_Accenture_MeetupDora&Cybersecurity.pptx02_Fabio Colombo_Accenture_MeetupDora&Cybersecurity.pptx
02_Fabio Colombo_Accenture_MeetupDora&Cybersecurity.pptx
 
The Economic History of the U.S. Lecture 26.pdf
The Economic History of the U.S. Lecture 26.pdfThe Economic History of the U.S. Lecture 26.pdf
The Economic History of the U.S. Lecture 26.pdf
 
High Class Call Girls Nagpur Grishma Call 7001035870 Meet With Nagpur Escorts
High Class Call Girls Nagpur Grishma Call 7001035870 Meet With Nagpur EscortsHigh Class Call Girls Nagpur Grishma Call 7001035870 Meet With Nagpur Escorts
High Class Call Girls Nagpur Grishma Call 7001035870 Meet With Nagpur Escorts
 
The Economic History of the U.S. Lecture 18.pdf
The Economic History of the U.S. Lecture 18.pdfThe Economic History of the U.S. Lecture 18.pdf
The Economic History of the U.S. Lecture 18.pdf
 
00_Main ppt_MeetupDORA&CyberSecurity.pptx
00_Main ppt_MeetupDORA&CyberSecurity.pptx00_Main ppt_MeetupDORA&CyberSecurity.pptx
00_Main ppt_MeetupDORA&CyberSecurity.pptx
 
The Economic History of the U.S. Lecture 30.pdf
The Economic History of the U.S. Lecture 30.pdfThe Economic History of the U.S. Lecture 30.pdf
The Economic History of the U.S. Lecture 30.pdf
 
Call Girls Service Nagpur Maya Call 7001035870 Meet With Nagpur Escorts
Call Girls Service Nagpur Maya Call 7001035870 Meet With Nagpur EscortsCall Girls Service Nagpur Maya Call 7001035870 Meet With Nagpur Escorts
Call Girls Service Nagpur Maya Call 7001035870 Meet With Nagpur Escorts
 
Call US 📞 9892124323 ✅ Kurla Call Girls In Kurla ( Mumbai ) secure service
Call US 📞 9892124323 ✅ Kurla Call Girls In Kurla ( Mumbai ) secure serviceCall US 📞 9892124323 ✅ Kurla Call Girls In Kurla ( Mumbai ) secure service
Call US 📞 9892124323 ✅ Kurla Call Girls In Kurla ( Mumbai ) secure service
 
Veritas Interim Report 1 January–31 March 2024
Veritas Interim Report 1 January–31 March 2024Veritas Interim Report 1 January–31 March 2024
Veritas Interim Report 1 January–31 March 2024
 
VIP Independent Call Girls in Bandra West 🌹 9920725232 ( Call Me ) Mumbai Esc...
VIP Independent Call Girls in Bandra West 🌹 9920725232 ( Call Me ) Mumbai Esc...VIP Independent Call Girls in Bandra West 🌹 9920725232 ( Call Me ) Mumbai Esc...
VIP Independent Call Girls in Bandra West 🌹 9920725232 ( Call Me ) Mumbai Esc...
 
Top Rated Pune Call Girls Viman Nagar ⟟ 6297143586 ⟟ Call Me For Genuine Sex...
Top Rated  Pune Call Girls Viman Nagar ⟟ 6297143586 ⟟ Call Me For Genuine Sex...Top Rated  Pune Call Girls Viman Nagar ⟟ 6297143586 ⟟ Call Me For Genuine Sex...
Top Rated Pune Call Girls Viman Nagar ⟟ 6297143586 ⟟ Call Me For Genuine Sex...
 
VVIP Pune Call Girls Katraj (7001035870) Pune Escorts Nearby with Complete Sa...
VVIP Pune Call Girls Katraj (7001035870) Pune Escorts Nearby with Complete Sa...VVIP Pune Call Girls Katraj (7001035870) Pune Escorts Nearby with Complete Sa...
VVIP Pune Call Girls Katraj (7001035870) Pune Escorts Nearby with Complete Sa...
 
VIP Independent Call Girls in Andheri 🌹 9920725232 ( Call Me ) Mumbai Escorts...
VIP Independent Call Girls in Andheri 🌹 9920725232 ( Call Me ) Mumbai Escorts...VIP Independent Call Girls in Andheri 🌹 9920725232 ( Call Me ) Mumbai Escorts...
VIP Independent Call Girls in Andheri 🌹 9920725232 ( Call Me ) Mumbai Escorts...
 
20240429 Calibre April 2024 Investor Presentation.pdf
20240429 Calibre April 2024 Investor Presentation.pdf20240429 Calibre April 2024 Investor Presentation.pdf
20240429 Calibre April 2024 Investor Presentation.pdf
 
WhatsApp 📞 Call : 9892124323 ✅Call Girls In Chembur ( Mumbai ) secure service
WhatsApp 📞 Call : 9892124323  ✅Call Girls In Chembur ( Mumbai ) secure serviceWhatsApp 📞 Call : 9892124323  ✅Call Girls In Chembur ( Mumbai ) secure service
WhatsApp 📞 Call : 9892124323 ✅Call Girls In Chembur ( Mumbai ) secure service
 
Pooja 9892124323 : Call Girl in Juhu Escorts Service Free Home Delivery
Pooja 9892124323 : Call Girl in Juhu Escorts Service Free Home DeliveryPooja 9892124323 : Call Girl in Juhu Escorts Service Free Home Delivery
Pooja 9892124323 : Call Girl in Juhu Escorts Service Free Home Delivery
 
High Class Call Girls Nashik Maya 7001305949 Independent Escort Service Nashik
High Class Call Girls Nashik Maya 7001305949 Independent Escort Service NashikHigh Class Call Girls Nashik Maya 7001305949 Independent Escort Service Nashik
High Class Call Girls Nashik Maya 7001305949 Independent Escort Service Nashik
 
The Economic History of the U.S. Lecture 20.pdf
The Economic History of the U.S. Lecture 20.pdfThe Economic History of the U.S. Lecture 20.pdf
The Economic History of the U.S. Lecture 20.pdf
 

Purchasing Managers´Index Report, October 2011

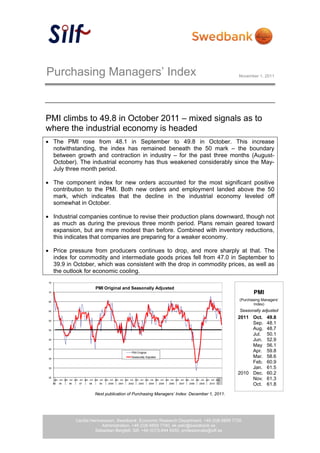
  • 1. Purchasing Managers’ Index November 1, 2011 PMI climbs to 49.8 in October 2011 – mixed signals as to where the industrial economy is headed  The PMI rose from 48.1 in September to 49.8 in October. This increase notwithstanding, the index has remained beneath the 50 mark – the boundary between growth and contraction in industry – for the past three months (August- October). The industrial economy has thus weakened considerably since the May- July three month period.  The component index for new orders accounted for the most significant positive contribution to the PMI. Both new orders and employment landed above the 50 mark, which indicates that the decline in the industrial economy leveled off somewhat in October.  Industrial companies continue to revise their production plans downward, though not as much as during the previous three month period. Plans remain geared toward expansion, but are more modest than before. Combined with inventory reductions, this indicates that companies are preparing for a weaker economy.  Price pressure from producers continues to drop, and more sharply at that. The index for commodity and intermediate goods prices fell from 47.0 in September to 39.9 in October, which was consistent with the drop in commodity prices, as well as the outlook for economic cooling. 75 PMI Original and Seasonally Adjusted 70 PMI 65 (Purchasing Managers’ Index) 60 Seasonally adjusted 2011 Oct. 49.8 55 Sep. 48.1 50 Aug. 48.7 Jul. 50.1 45 Jun. 52.9 May 56.1 40 PMI Original Apr. 59.8 35 Seasonally Adjusted Mar. 58.6 Feb. 60.9 30 Jan. 61.5 2010 Dec. 60.2 25 Jan Jul Jan Jul Jan Jul Jan Jul Jan Jul Jan Jul Jan Jul Jan Jul Jan Jul Jan Jul Jan Jul Jan Jul Jan Jul Jan Jul Jan Jul Jan Jul Jan Nov. 61.3 94 95 96 97 98 99 2000 2001 2002 2003 2004 2005 2006 2007 2008 2009 2010 11 Oct. 61.8 Next publication of Purchasing Managers’ Index: December 1, 2011. Cecilia Hermansson, Swedbank, Economic Research Department, +46 (0)8-5859 7720 Administration, +46 (0)8-5859 7740, ek.sekr@swedbank.se Sebastian Bergfelt, Silf, +46 (0)73-944 6450, professionals@silf.se 1 (4)
  • 2. Purchasing Managers Index concerning October 2011, continued Silf/Swedbanks’ Purchasing Managers’ Index. seasonally adjusted PMI Components of PMI Other indices Forecast Total New Produc- Employ- Delivery Export Domestic Back-log Planned Index orders tion ment times Inventories orders orders of orders Prices Import Production 2008 Jul 48.6 46.0 53.6 45.5 50.4 53.1 46.6 44.6 42.7 76.8 58.5 58.7 Aug 46.4 42.7 47.8 44.2 51.0 49.1 44.0 43.3 43.0 70.2 51.2 49.5 Sep 42.3 38.7 41.3 42.6 42.5 45.4 40.9 38.0 39.7 55.1 48.7 47.4 Oct 39.0 34.8 39.1 39.8 35.9 45.7 37.0 35.4 36.0 38.2 44.5 39.5 Nov 33.1 26.0 31.0 36.5 31.0 43.6 29.4 25.8 28.1 29.4 37.5 31.8 Dec 32.7 26.1 31.0 33.5 28.6 38.9 26.3 23.3 25.7 27.9 32.3 26.3 2009 Jan 33.8 29.0 33.3 32.1 30.3 41.8 34.2 27.9 25.9 29.1 35.5 32.9 Feb 33.9 28.8 34.0 31.0 28.4 36.6 29.7 30.5 29.7 30.4 33.5 35.8 Mar 36.7 35.1 38.8 31.1 28.0 39.6 39.7 35.5 30.8 27.7 38.5 38.2 Apr 38.8 41.5 39.4 28.3 29.6 35.9 45.3 37.7 39.7 30.6 38.8 42.4 May 43.7 46.4 47.4 31.1 34.2 33.5 47.5 44.1 42.8 32.7 41.0 47.3 Jun 50.5 54.7 55.8 36.0 42.4 34.0 54.4 49.2 47.4 43.3 47.3 55.2 Jul 54.3 60.5 61.0 40.3 44.4 38.4 56.4 58.1 54.1 46.9 51.0 59.1 Aug 52.4 57.8 56.1 40.6 46.4 40.4 61.1 50.1 54.3 52.6 50.7 61.7 Sep 55.9 59.2 60.5 45.0 53.7 40.6 61.1 55.0 54.0 54.5 55.7 63.3 Oct 56.7 60.8 61.7 43.8 56.2 41.6 60.7 55.8 58.9 56.7 55.8 62.2 Nov 56.0 57.9 59.0 48.7 55.0 41.3 59.7 53.6 53.6 59.8 57.0 62.2 Dec 58.2 63.7 59.7 49.5 56.3 42.7 58.1 66.3 56.6 57.3 59.0 67.4 2010 Jan 61.7 66.8 70.2 49.6 61.5 48.3 62.3 64.8 62.6 61.2 61.3 69.5 Feb 61.5 67.5 65.3 55.0 61.4 53.6 62.7 63.6 64.2 61.3 59.7 68.1 Mar 61.1 63.8 63.7 54.9 67.0 50.2 62.3 58.9 60.6 65.7 62.3 69.6 Apr 64.0 68.1 66.3 56.6 68.3 46.0 64.6 63.2 62.5 75.6 60.3 77.5 May 66.0 68.8 71.0 60.1 71.5 50.7 62.6 64.1 64.3 71.0 59.9 73.0 Jun 62.4 61.1 66.8 60.3 69.2 50.4 57.4 60.1 60.9 71.1 59.5 73.1 Jul 64.2 67.3 72.2 56.3 66.4 51.4 61.4 63.2 63.4 70.9 60.9 72.0 Aug 60.6 61.8 61.9 60.5 64.5 52.0 57.4 58.7 59.7 68.5 56.1 72.4 Sep 63.3 65.8 67.4 60.3 66.3 52.9 61.4 62.9 62.2 71.1 58.6 70.8 Oct 61.8 63.0 63.5 59.0 66.8 47.9 61.6 58.2 61.7 66.4 59.3 72.4 Nov 61.3 60.4 64.2 60.2 67.2 50.2 58.9 56.3 58.2 70.8 61.4 72.5 Dec 60.2 63.6 62.8 57.1 64.5 55.5 60.5 63.6 59.5 71.9 59.7 74.0 2011 Jan 61.5 64.2 64.9 57.7 64.6 51.9 61.9 62.1 60.2 77.1 58.6 70.9 Feb 60.9 59.5 65.0 61.1 67.2 54.4 58.8 56.3 58.0 77.1 60.2 71.0 Mar 58.6 56.1 61.4 58.3 66.0 52.0 54.7 54.0 54.3 73.8 58.9 71.6 Apr 59.8 61.5 61.9 57.7 65.1 54.6 58.3 56.9 57.3 74.5 58.5 70.5 May 56.1 55.4 59.8 54.4 61.0 55.6 52.8 56.4 55.3 63.5 56.2 69.1 Jun 52.9 52.3 54.0 51.3 58.1 51.4 52.5 48.8 51.0 60.5 52.2 64.5 Jul 50.1 45.4 49.4 53.7 55.4 50.1 46.9 43.4 49.1 51.5 50.4 63.1 Aug 48.7 47.0 48.6 50.9 49.1 51.5 48.0 42.3 47.9 47.4 48.5 55.8 Sep 48.1 46.5 48.9 50.0 47.5 52.0 48.3 46.2 47.0 47.0 45.8 53.8 Oct 49.8 50.5 48.2 50.7 47.8 47.1 48.9 49.1 48.9 39.9 46.8 53.6
  • 3. Purchasing Managers Index concerning October 2011, continued Silf/Swedbanks’ Purchasing Managers’ Index PMI Components of PMI Other indices Forecast Total New- Produc- Employ- Delivery Export Domestic Back-log Planned Index orders tion ment times Inventories orders orders of orders Prices Import Production 2008 Jul 43.8 39.6 42.1 45.6 51.8 54.9 42.5 38.6 40.9 75.0 53.1 57.4 Aug 49.3 46.7 53.6 44.7 52.7 49.7 46.2 47.7 47.7 69.9 53.4 51.0 Sep 43.2 38.5 43.4 43.4 44.0 44.7 40.1 39.3 38.8 55.6 49.7 45.8 Oct 37.7 31.9 37.8 38.9 35.7 44.0 33.8 33.6 31.3 36.6 42.5 36.0 Nov 30.7 21.8 27.9 35.2 28.8 41.1 25.7 22.9 22.9 25.3 35.3 28.8 Dec 28.6 20.2 24.8 30.6 24.6 35.1 21.5 17.9 19.9 22.9 28.9 24.3 2009 Jan 31.7 27.6 30.5 29.4 26.3 40.1 34.0 25.2 24.7 26.9 34.0 33.9 Feb 34.8 32.0 35.3 29.9 26.3 35.2 33.1 32.1 32.5 29.7 33.7 38.2 Mar 38.3 38.7 42.1 30.5 27.5 40.5 42.8 37.5 34.2 28.2 40.6 40.7 Apr 41.1 44.8 43.2 29.7 30.6 36.8 47.8 40.4 42.6 34.1 40.6 45.1 May 45.8 49.0 50.3 33.1 36.5 35.3 49.6 46.6 45.9 36.5 43.2 48.3 Jun 53.9 59.4 60.8 39.1 45.5 37.3 58.3 53.5 50.3 45.1 50.0 54.6 Jul 50.7 55.7 51.3 40.8 46.9 40.7 53.5 53.6 53.1 47.4 47.3 59.2 Aug 56.2 62.9 62.9 41.9 49.3 41.5 64.6 55.3 60.2 54.5 53.9 64.7 Sep 57.7 59.9 63.6 46.7 56.6 40.4 61.2 57.1 54.0 57.0 57.8 62.9 Oct 56.1 58.6 61.1 43.6 57.2 40.4 58.1 54.7 55.0 56.8 54.7 59.6 Nov 53.9 53.8 56.1 48.1 53.5 39.3 56.1 50.8 48.5 56.9 55.4 59.5 Dec 54.2 57.9 53.5 47.2 52.8 39.3 61.6 52.8 50.8 52.8 56.0 65.7 2010 Jan 59.7 65.4 67.7 47.2 57.9 49.2 61.7 62.3 61.5 59.4 60.1 70.6 Feb 62.2 70.4 66.3 54.3 59.4 52.9 65.5 65.0 66.9 60.6 59.8 70.2 Mar 62.4 66.7 66.4 54.5 66.6 51.4 64.8 60.3 63.4 66.1 64.2 71.6 Apr 66.0 70.9 69.6 58.0 69.2 46.8 66.6 65.4 64.9 79.3 61.7 79.9 May 67.8 70.8 73.6 62.1 73.6 52.5 64.0 66.1 66.9 74.4 61.6 73.4 Jun 65.3 64.9 71.2 63.2 71.8 53.6 60.4 63.7 63.2 72.5 61.6 72.0 Jul 60.3 62.1 62.4 56.3 68.2 53.6 58.0 58.4 62.1 70.8 56.8 71.6 Aug 63.9 66.3 68.0 61.5 66.7 53.0 60.4 63.4 65.1 69.7 58.7 75.0 Sep 64.8 66.2 70.2 61.7 68.7 52.6 61.4 64.9 61.9 73.2 60.3 70.0 Oct 60.9 60.5 62.5 58.4 67.3 46.3 58.9 56.6 57.6 65.8 57.9 69.5 Nov 58.9 55.9 61.0 59.4 65.3 47.9 55.2 53.1 52.8 67.6 59.7 69.6 Dec 56.0 57.6 56.2 54.3 60.5 52.1 55.9 58.3 53.4 67.2 56.6 72.2 2011 Jan 59.4 62.7 62.3 54.9 60.6 50.7 61.5 59.6 59.0 75.3 57.3 71.7 Feb 61.5 62.2 65.9 60.3 65.0 53.7 61.6 57.4 60.5 76.4 60.3 72.8 Mar 59.6 58.6 63.9 57.6 65.4 53.1 56.9 55.1 56.8 74.0 60.8 73.4 Apr 61.7 64.3 65.0 58.9 65.8 55.4 60.3 59.0 59.6 78.1 59.9 72.8 May 57.7 57.3 62.3 56.1 62.9 57.5 54.0 58.4 57.8 66.2 57.8 69.4 Jun 55.6 56.1 58.1 54.1 59.9 54.8 55.8 52.4 53.7 61.8 54.0 63.1 Jul 45.8 39.7 39.2 53.5 56.9 52.0 43.1 38.1 47.5 50.5 46.0 62.4 Aug 51.7 51.3 54.4 51.7 50.7 52,4 50.7 46.6 53.0 47.7 50.7 57.8 Sep 49.4 46.8 51.6 51.3 49.4 51.6 48.1 48.1 46.5 48.4 47.1 52.5 Oct 48.9 48.1 47.1 50.0 48.1 45.1 46.2 47.7 44.9 38.5 45.2 50.3
  • 4. Purchasing Managers Index concerning October 2011, continued Silf / Swedbank’s Purchasing Managers’ Index (PMI) – goals and methodology History Silf (previously I&L) and Swedbank AB, publ, (formerly Sparbanken Sverige) made the first joint – internal – calculation of the “Purchasing Managers’ Index” for the five component indices in December 1994. Exactly one year later the index figures were published for the first time. The model for what was then known as the ICI (now the PMI, Purchasing Managers’ Index) was the NAPM index – one of the USA’s most important and most well known economic indicators. The NAPM index has existed since 1931 and was subsequently renamed PMI (or ISM index). Participants About 200 purchasing managers in the manufacturing industry. Publication First business day of every month, 8:30 a.m. Survey period Comparison with the previous month. Composition New orders (in manager’s own company) 30 of PMI (%) Production (same as above) 25 Employment (same as above) 20 Suppliers’ delivery times 15 Inventories (purchased material) 10 Other ratios New export orders (not included in PMI) New domestic orders Order Backlogs Suppliers’ commodity and intermediate goods prices Imports Production plans for the next six months Goals Quick economic indicator Simple statistics and ease of interpretation Statistics with relatively short publication intervals Constant contact with well-informed professional group Calculation Same as for calculating a diffusion index. Positive changes are noted in percent for the five component indexes. The percentage of unchanged replies, multiplied by 0.5, is added to this figure. Then the different component indices are weighted as described above to calculate the total index. The Purchasing Managers’ Index does not indicate activity levels but rather monthly changes in industrial activity. The seasonally adjusted figures are shown first. ”Break even” The dividing line between growth and contraction in the industrial economy has – in line with American practice – been set at 50. However, this figure should not be interpreted as a precise boundary or “neutral growth zone.” A PMI index level of 49.7 or 50.3 would not indicate a particularly different economic situation. We believe we have used reliable sources and procedures to generate and analyze the Purchasing Managers’ Index (ICI/PMI). However, Swedbank AB (publ) and Silf cannot guarantee the accuracy or completeness of the analyses and cannot be responsible for any errors or omissions in the basic data or processing thereof. Readers are encouraged to base any decisions on other sources as well. Neither Swedbank, Silf nor their employees or other associates shall be deemed liable for loss or damage, direct or indirect, arising from any errors or omissions in analyses reported in the Purchasing Managers’ Index.