Purchasing Managers' Index Report August 2009
•
0 gefällt mir•187 views

Swedbank was founded in 1820, as Sweden’s first savings bank was established. Today, our heritage is visible in that we truly are a bank for each and every one and in that we still strive to contribute to a sustainable development of society and our environment. We are strongly committed to society as a whole and keen to help bring about a sustainable form of societal development. Our Swedish operations hold an ISO 14001 environmental certification, and environmental work is an integral part of our business activities.

Empfohlen
Empfohlen
Weitere ähnliche Inhalte
Andere mochten auch
Andere mochten auch (14)
Ähnlich wie Purchasing Managers' Index Report August 2009
Ähnlich wie Purchasing Managers' Index Report August 2009 (20)
Mehr von Swedbank
Mehr von Swedbank (20)
Kürzlich hochgeladen
Kürzlich hochgeladen (20)
Purchasing Managers' Index Report August 2009
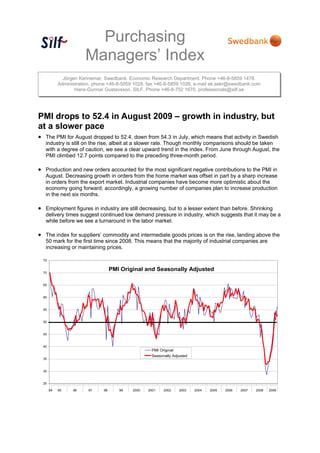
- 1. Purchasing Managers’ Index Jörgen Kennemar. Swedbank. Economic Research Department. Phone +46-8-5859 1478. Administration. phone +46-8-5859 1028. fax +46-8-5859 1026. e-mail ek.sekr@swedbank.com Hans-Gunnar Gustavsson. SILF. Phone +46-8-752 1670. professionals@silf.se PMI drops to 52.4 in August 2009 – growth in industry, but at a slower pace • The PMI for August dropped to 52.4, down from 54.3 in July, which means that activity in Swedish industry is still on the rise, albeit at a slower rate. Though monthly comparisons should be taken with a degree of caution, we see a clear upward trend in the index. From June through August, the PMI climbed 12.7 points compared to the preceding three-month period. • Production and new orders accounted for the most significant negative contributions to the PMI in August. Decreasing growth in orders from the home market was offset in part by a sharp increase in orders from the export market. Industrial companies have become more optimistic about the economy going forward; accordingly, a growing number of companies plan to increase production in the next six months. • Employment figures in industry are still decreasing, but to a lesser extent than before. Shrinking delivery times suggest continued low demand pressure in industry, which suggests that it may be a while before we see a turnaround in the labor market. • The index for suppliers’ commodity and intermediate goods prices is on the rise, landing above the 50 mark for the first time since 2008. This means that the majority of industrial companies are increasing or maintaining prices. 25 30 35 40 45 50 55 60 65 70 75 94 95 96 97 98 99 2000 2001 2002 2003 2004 2005 2006 2007 2008 2009 PMI Original Seasonally Adjusted PMI Original and Seasonally Adjusted
- 2. 2 (4) Silf/Swedbanks’ Purchasing Managers’ Index. seasonally adjusted PMI Components of PMI Other indices Forecast Total New Produc- Employ- Delivery Export Domestic Back-log Planned Index orders tion ment times Inventories orders orders of orders Prices Import Production 2006 Jul 64.1 66.1 69.6 56.7 69.6 48.9 65.7 61.7 62.8 78.0 65.2 75.3 Aug 60.4 61.9 63.4 56.0 65.8 51.2 61.2 57.0 59.8 78.5 59.8 70.7 Sep 61.8 63.5 64.9 58.0 65.6 48.8 62.4 60.1 63.2 72.3 58.9 71.9 Oct 60.7 61.4 62.4 57.1 68.7 50.5 59.9 57.5 59.4 73.0 61.0 72.4 Nov 61.5 66.2 65.1 54.6 68.6 58.1 64.7 60.9 61.9 69.3 60.6 74.7 Dec 63.6 69.1 68.6 54.6 66.5 52.2 66.5 64.8 65.2 69.9 61.5 72.0 2007 Jan 61.4 62.9 64.1 59.3 65.0 50.9 62.4 60.0 60.7 68.2 59.8 74.3 Feb 63.1 65.6 67.3 59.3 67.6 53.7 63.7 59.5 62.5 64.5 60.2 74.1 Mar 60.6 64.3 60.9 56.3 63.7 47.7 62.9 58.4 60.2 68.9 57.8 73.1 Apr 58.5 56.2 60.7 59.3 64.0 50.0 57.3 53.5 58.3 70.5 60.5 72.3 May 58.9 58.8 63.8 55.1 64.1 52.7 59.0 54.2 57.6 67.9 59.0 70.8 Jun 60.3 59.6 62.5 57.9 70.5 53.9 61.0 54.4 54.5 71.7 61.1 69.2 Jul 60.5 63.0 65.6 54.0 64.4 53.1 62.7 59.7 56.3 67.8 64.1 71.8 Aug 56.8 57.3 58.4 54.9 61.0 52.3 59.2 54.1 55.8 63.0 55.7 70.2 Sep 58.2 62.0 59.2 56.7 59.6 55.0 61.0 56.4 60.0 59.0 58.1 72.1 Oct 59.4 61.0 63.7 57.1 60.2 52.8 59.1 58.9 62.7 62.3 59.0 72.5 Nov 55.1 54.7 57.4 55.7 57.5 53.1 53.3 54.5 53.7 60.4 55.7 69.2 Dec 55.5 57.1 58.3 53.8 55.5 53.1 57.7 55.0 60.2 62.7 56.4 69.7 2008 Jan 54.6 53.6 55.2 55.4 58.2 50.5 54.2 54.5 51.5 65.6 55.7 67.8 Feb 55.7 56.9 60.2 52.5 55.6 52.6 56.1 57.9 57.9 67.5 59.2 64.4 Mar 54.7 56.5 56.8 51.9 57.0 53.5 56.9 51.6 51.5 70.4 56.5 63.9 Apr 50.1 47.1 54.0 48.0 52.0 48.9 46.4 49.7 47.1 69.6 52.1 61.9 May 51.2 51.3 53.4 48.6 51.1 49.0 50.9 50.7 52.0 74.3 56.2 59.9 Jun 50.6 50.3 53.9 47.8 51.8 52.2 52.5 46.7 49.0 75.6 56.2 64.7 Jul 48.6 46.0 53.6 45.5 50.4 53.1 46.6 44.6 42.7 76.8 58.5 58.7 Aug 46.4 42.7 47.8 44.2 51.0 49.1 44.0 43.3 43.0 70.2 51.2 49.5 Sep 42.3 38.7 41.3 42.6 42.5 45.4 40.9 38.0 39.7 55.1 48.7 47.4 Oct 39.0 34.8 39.1 39.8 35.9 45.7 37.0 35.4 36.0 38.2 44.5 39.5 Nov 33.1 26.0 31.0 36.5 31.0 43.6 29.4 25.8 28.1 29.4 37.5 31.8 Dec 32.7 26.1 31.0 33.5 28.6 38.9 26.3 23.3 25.7 27.9 32.3 26.3 2009 Jan 33.8 29.0 33.3 32.1 30.3 41.8 34.2 27.9 25.9 29.1 35.5 32.9 Feb 33.9 28.8 34.0 31.0 28.4 36.6 29.7 30.5 29.7 30.4 33.5 35.8 Mar 36.7 35.1 38.8 31.1 28.0 39.6 39.7 35.5 30.8 27.7 38.5 38.2 Apr 38.8 41.5 39.4 28.3 29.6 35.9 45.3 37.7 39.7 30.6 38.8 42.4 May 43.7 46.4 47.4 31.1 34.2 33.5 47.5 44.1 42.8 32.7 41.0 47.3 Jun 50.5 54.7 55.8 36.0 42.4 34.0 54.4 49.2 47.4 43.3 47.3 55.2 Jul 54.3 60.5 61.0 40.3 44.4 38.4 56.4 58.1 54.1 46.9 51.0 59.1 Aug 52.4 57.8 56.1 40.6 46.4 40.4 61.1 50.1 54.3 52.6 50.7 61.7
- 3. 3 (4) Silf/Swedbanks’ Purchasing Managers’ Index PMI Components of PMI Other indices Forecast Total New- Produc- Employ- Delivery Export Domestic Back-log Planned Index orders tion ment times Inventories orders orders of orders Prices Import Production 2006 Jul 59.3 59.7 58.1 56.8 71.0 50.7 61.6 55.7 61.0 76.2 59.8 74.0 Aug 63.7 66.5 69.8 56.9 67.7 52.0 63.8 61.9 65.0 78.5 62.5 73.1 Sep 63.1 63.5 67.7 59.0 67.8 48.3 61.8 61.9 62.4 74.2 60.3 70.8 Oct 59.8 58.9 61.4 56.4 69.2 49.1 57.2 56.0 54.7 73.4 59.4 69.7 Nov 59.9 63.1 63.0 53.7 67.3 55.9 62.1 58.9 57.6 67.3 59.3 72.7 Dec 59.5 62.7 62.4 52.2 63.5 49.4 61.5 59.7 58.4 65.7 58.6 69.7 2007 Jan 59.6 61.8 61.7 56.8 61.2 49.4 62.2 57.4 60.1 66.9 58.8 75.6 Feb 63.9 68.5 68.2 58.4 65.7 52.6 67.0 60.5 64.9 64.1 60.5 76.5 Mar 61.8 67.0 63.7 55.8 63.1 48.5 65.1 59.8 63.3 69.3 59.7 75.2 Apr 60.5 59.0 64.1 61.0 64.9 51.3 59.3 55.5 60.6 73.5 62.3 74.2 May 60.3 60.2 65.8 57.0 65.9 54.9 60.1 55.6 59.6 70.3 60.7 70.9 Jun 62.6 62.8 66.0 60.5 72.4 57.2 63.5 57.8 56.3 71.5 62.8 66.9 Jul 55.7 56.6 54.1 54.1 65.8 54.9 58.6 53.7 54.5 66.0 58.7 70.5 Aug 59.9 61.7 64.5 55.7 62.6 53.1 61.7 58.8 60.9 62.7 58.1 72.4 Sep 59.4 62.2 61.9 57.7 61.5 54.6 60.5 58.2 59.5 60.6 59.4 71.1 Oct 58.5 58.6 62.8 56.4 60.6 51.3 56.3 57.6 58.4 62.7 57.4 69.9 Nov 53.3 51.2 55.0 54.7 55.9 50.9 50.3 52.4 49.1 58.3 54.2 67.1 Dec 51.8 51.7 52.6 51.2 52.1 49.7 53.4 50.3 54.9 59.4 53.8 68.6 2008 Jan 52.7 52.3 52.6 52.9 54.4 48.9 53.8 52.0 50.6 64.6 54.7 68.9 Feb 56.5 59.9 61.4 51.5 53.6 51.5 59.5 59.2 60.5 67.5 59.7 66.5 Mar 56.0 59.4 59.6 51.2 56.5 54.4 59.3 52.9 54.4 71.3 58.3 65.8 Apr 51.9 49.4 57.2 49.4 52.7 50.0 47.9 51.5 49.1 73.0 53.7 63.6 May 52.5 52.7 55.3 50.3 52.7 51.0 51.9 52.0 54.0 77.5 57.9 59.7 Jun 52.9 53.4 57.4 50.3 53.7 55.5 55.0 49.7 50.7 76.0 58.0 62.5 Jul 43.8 39.6 42.1 45.6 51.8 54.9 42.5 38.6 40.9 75.0 53.1 57.4 Aug 49.3 46.7 53.6 44.7 52.7 49.7 46.2 47.7 47.7 69.9 53.4 51.0 Sep 43.2 38.5 43.4 43.4 44.0 44.7 40.1 39.3 38.8 55.6 49.7 45.8 Oct 37.7 31.9 37.8 38.9 35.7 44.0 33.8 33.6 31.3 36.6 42.5 36.0 Nov 30.7 21.8 27.9 35.2 28.8 41.1 25.7 22.9 22.9 25.3 35.3 28.8 Dec 28.6 20.2 24.8 30.6 24.6 35.1 21.5 17.9 19.9 22.9 28.9 24.3 2009 Jan 31.7 27.6 30.5 29.4 26.3 40.1 34.0 25.2 24.7 26.9 34.0 33.9 Feb 34.8 32.0 35.3 29.9 26.3 35.2 33.1 32.1 32.5 29.7 33.7 38.2 Mar 38.3 38.7 42.1 30.5 27.5 40.5 42.8 37.5 34.2 28.2 40.6 40.7 Apr 41.1 44.8 43.2 29.7 30.6 36.8 47.8 40.4 42.6 34.1 40.6 45.1 May 45.8 49.0 50.3 33.1 36.5 35.3 49.6 46.6 45.9 36.5 43.2 48.3 Jun 53.9 59.4 60.8 39.1 45.5 37.3 58.3 53.5 50.3 45.1 50.0 54.6 Jul 50.7 55.7 51.3 40.8 46.9 40.7 53.5 53.6 53.1 47.4 47.3 59.2 Aug 56.2 62.9 62.9 41.9 49.3 41.5 64.6 55.3 60.2 54.5 53.9 64.7
- 4. 4 (4) Silf/Swedbank’s Purchasing Managers’ Index - objectives and methodology History Silf (earlier I&L) and Swedbank AB. publ. (at that time Sparbanken Sweden) make the first joint – internal – calculation of the “Purchasing Managers’ Index” for the five indexes (PMI) in December 1994. Exactly one year later, the index was publicly announced for the first time. In Sweden the Puchasing Managers’ Index is known as the ICI index. The model for PMI is the ISM index (Institute for Supply Management, formerly known as the NAPM index) – one of the most highly regarded and well-recognized economic indicators in the United States. The ISM index has existed since 1931 in the form of its predecessor, the NAPM index. Participants About 200 purchasing managers in the manufacturing industry. Publication First weekday of each month. 8:30 am. Analysis Period Comparison with previous month. Composition of PMI (%) New orders (within the company) 30 Production (within the company) 25 Employment (within the company) 20 Suppliers’ Delivery Times 15 Inventories (purchased material) 10 Other leading indicators New Export Orders (not included in PMI) New Domestic Orders Backlog of Orders Suppliers’ commodity and intermediate goods prices Imports Production Plans next six months Other questions Reason for higher/lower inventories level Important commodities and intermediate goods with rising/falling prices Objective Quick economic indicator Simple statistics Statistics with relatively short publication intervals Constant contact with well-informed professional group Calculation According to “diffusion index”. Positive changes are noted in percent for the five sub indexes. The percentage of unchanged replies, multiplied by 0.5, is added to this figure. Then the different sub indexes are weighted as described above to reach the total index. The Purchasing Managers’ Index does not indicate activity levels but rather monthly changes in industrial activity. “Break-even” The dividing line between growth and decline – in line with US praxis – has been drawn at a total index of 50. However, this boundary or “neutral growth zone” should not be applied excessively. Rather, “Break-even” at 50 indicates a target value. We believe we have used reliable sources and procedures to generate and analyze the Purchasing Managers’ Index (PMI – in Sweden ICI). However, Swedbank AB (publ) and SILF (earlier Organisationen för Inköp och Logistik, /I&L/ – The Organization for Purchasing and Logistics) cannot guarantee the accuracy or completeness of the analyses and cannot be responsible for any errors or omissions in the basic data or processing thereof. The reader should base any decisions on other background material as well. Swedbank AB (publ), SILF. their employees, and other coworkers accept no liability whatsoever for any direct or consequential loss or injury of any kind arising from any errors or omissions in the analyses presented in the Purchasing Managers’ Index.