Weitere ähnliche Inhalte Ähnlich wie Purchasing Managers' Index May 2012 (15) Kürzlich hochgeladen (20) 1. Purchasing Managers’ Index June 1, 2012
PMI drops to 49.0 in May – industrial economy flags as new
orders numbers sag
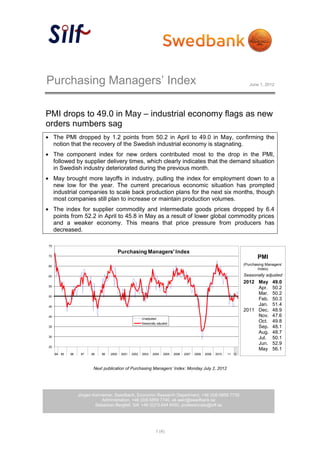
The PMI dropped by 1.2 points from 50.2 in April to 49.0 in May, confirming the
notion that the recovery of the Swedish industrial economy is stagnating.
The component index for new orders contributed most to the drop in the PMI,
followed by supplier delivery times, which clearly indicates that the demand situation
in Swedish industry deteriorated during the previous month.
May brought more layoffs in industry, pulling the index for employment down to a
new low for the year. The current precarious economic situation has prompted
industrial companies to scale back production plans for the next six months, though
most companies still plan to increase or maintain production volumes.
The index for supplier commodity and intermediate goods prices dropped by 6.4
points from 52.2 in April to 45.8 in May as a result of lower global commodity prices
and a weaker economy. This means that price pressure from producers has
decreased.
75
Purchasing Managers' Index
70
PMI
65
(Purchasing Managers’
Index)
60 Seasonally adjusted
2012 May 49.0
55
Apr. 50.2
Mar. 50.2
50
Feb. 50.3
45
Jan. 51.4
2011 Dec. 48.9
40 Nov. 47.6
Unadjusted
Seasonally adjusted
Oct. 49.8
35 Sep. 48.1
Aug. 48.7
30 Jul. 50.1
Jun. 52.9
25
May 56.1
94 95 96 97 98 99 2000 2001 2002 2003 2004 2005 2006 2007 2008 2009 2010 11 12
Next publication of Purchasing Managers’ Index: Monday July 2, 2012
Jörgen Kennemar, Swedbank, Economic Research Department, +46 (0)8-5859 7730
Administration, +46 (0)8-5859 7740, ek.sekr@swedbank.se
Sebastian Bergfelt, Silf, +46 (0)73-944 6450, professionals@silf.se
1 (4)
2. Silf/Swedbanks’ Purchasing Managers’ Index. seasonally adjusted
PMI Components of PMI Other indices Forecast
Total New Produc- Employ- Delivery Export Domestic Back-log Planned
Index orders tion ment times Inventories orders orders of orders Prices Import Production
2009 Feb 33.9 28.8 34.0 31.0 28.4 36.6 29.7 30.5 29.7 30.4 33.5 35.8
Mar 36.7 35.1 38.8 31.1 28.0 39.6 39.7 35.5 30.8 27.7 38.5 38.2
Apr 38.8 41.5 39.4 28.3 29.6 35.9 45.3 37.7 39.7 30.6 38.8 42.4
May 43.7 46.4 47.4 31.1 34.2 33.5 47.5 44.1 42.8 32.7 41.0 47.3
Jun 50.5 54.7 55.8 36.0 42.4 34.0 54.4 49.2 47.4 43.3 47.3 55.2
Jul 54.3 60.5 61.0 40.3 44.4 38.4 56.4 58.1 54.1 46.9 51.0 59.1
Aug 52.4 57.8 56.1 40.6 46.4 40.4 61.1 50.1 54.3 52.6 50.7 61.7
Sep 55.9 59.2 60.5 45.0 53.7 40.6 61.1 55.0 54.0 54.5 55.7 63.3
Oct 56.7 60.8 61.7 43.8 56.2 41.6 60.7 55.8 58.9 56.7 55.8 62.2
Nov 56.0 57.9 59.0 48.7 55.0 41.3 59.7 53.6 53.6 59.8 57.0 62.2
Dec 58.2 63.7 59.7 49.5 56.3 42.7 58.1 66.3 56.6 57.3 59.0 67.4
2010 Jan 61.7 66.8 70.2 49.6 61.5 48.3 62.3 64.8 62.6 61.2 61.3 69.5
Feb 61.5 67.5 65.3 55.0 61.4 53.6 62.7 63.6 64.2 61.3 59.7 68.1
Mar 61.1 63.8 63.7 54.9 67.0 50.2 62.3 58.9 60.6 65.7 62.3 69.6
Apr 64.0 68.1 66.3 56.6 68.3 46.0 64.6 63.2 62.5 75.6 60.3 77.5
May 66.0 68.8 71.0 60.1 71.5 50.7 62.6 64.1 64.3 71.0 59.9 73.0
Jun 62.4 61.1 66.8 60.3 69.2 50.4 57.4 60.1 60.9 71.1 59.5 73.1
Jul 64.2 67.3 72.2 56.3 66.4 51.4 61.4 63.2 63.4 70.9 60.9 72.0
Aug 60.6 61.8 61.9 60.5 64.5 52.0 57.4 58.7 59.7 68.5 56.1 72.4
Sep 63.3 65.8 67.4 60.3 66.3 52.9 61.4 62.9 62.2 71.1 58.6 70.8
Oct 61.8 63.0 63.5 59.0 66.8 47.9 61.6 58.2 61.7 66.4 59.3 72.4
Nov 61.3 60.4 64.2 60.2 67.2 50.2 58.9 56.3 58.2 70.8 61.4 72.5
Dec 60.2 63.6 62.8 57.1 64.5 55.5 60.5 63.6 59.5 71.9 59.7 74.0
2011 Jan 61.5 64.2 64.9 57.7 64.6 51.9 61.9 62.1 60.2 77.1 58.6 70.9
Feb 60.9 59.5 65.0 61.1 67.2 54.4 58.8 56.3 58.0 77.1 60.2 71.0
Mar 58.6 56.1 61.4 58.3 66.0 52.0 54.7 54.0 54.3 73.8 58.9 71.6
Apr 59.8 61.5 61.9 57.7 65.1 54.6 58.3 56.9 57.3 74.5 58.5 70.5
May 56.1 55.4 59.8 54.4 61.0 55.6 52.8 56.4 55.3 63.5 56.2 69.1
Jun 52.9 52.3 54.0 51.3 58.1 51.4 52.5 48.8 51.0 60.5 52.2 64.5
Jul 50.1 45.4 49.4 53.7 55.4 50.1 46.9 43.4 49.1 51.5 50.4 63.1
Aug 48.7 47.0 48.6 50.9 49.1 51.5 48.0 42.3 47.9 47.4 48.5 55.8
Sep 48.1 46.5 48.9 50.0 47.5 52.0 48.3 46.2 47.0 47.0 45.8 53.8
Oct 49.8 50.5 48.2 50.7 47.8 47.1 48.9 49.1 48.9 39.9 46.8 53.6
Nov 47.6 47.1 46.2 48.3 45.6 46.0 47.5 46.1 45.1 42.6 44.5 51.6
Dec 48.9 47.0 49.2 49.5 49.9 48.3 48.7 45.1 46.4 42.6 46.5 59.3
2012 Jan 51.4 52.0 52.9 48.0 51.0 47.0 49.9 49.0 50.6 50.3 50.3 56.2
Feb 50.3 49.5 51.9 48.3 52.6 51.2 48.7 48.5 48.0 52.5 50.6 57.7
Mar 50.2 50.5 48.6 49.5 49.3 43.7 50.1 48.6 48.6 55.3 47.9 56.5
Apr 50.2 51.2 51.2 46.7 49.3 46.3 52.3 48.3 52.7 52.3 48.6 55.0
May 49.0 49.2 51.2 46.3 46.9 47.9 51.1 44.9 47.0 45.8 46.5 54.5
2 (4)
3. Silf/Swedbanks’ Purchasing Managers’ Index
PMI Components of PMI Other indices Forecast
Total New- Produc- Employ- Delivery Export Domestic Back-log Planned
Index orders tion ment times Inventories orders orders of orders Prices Import Production
2009 Feb 34.8 32.0 35.3 29.9 26.3 35.2 33.1 32.1 32.5 29.7 33.7 38.2
Mar 38.3 38.7 42.1 30.5 27.5 40.5 42.8 37.5 34.2 28.2 40.6 40.7
Apr 41.1 44.8 43.2 29.7 30.6 36.8 47.8 40.4 42.6 34.1 40.6 45.1
May 45.8 49.0 50.3 33.1 36.5 35.3 49.6 46.6 45.9 36.5 43.2 48.3
Jun 53.9 59.4 60.8 39.1 45.5 37.3 58.3 53.5 50.3 45.1 50.0 54.6
Jul 50.7 55.7 51.3 40.8 46.9 40.7 53.5 53.6 53.1 47.4 47.3 59.2
Aug 56.2 62.9 62.9 41.9 49.3 41.5 64.6 55.3 60.2 54.5 53.9 64.7
Sep 57.7 59.9 63.6 46.7 56.6 40.4 61.2 57.1 54.0 57.0 57.8 62.9
Oct 56.1 58.6 61.1 43.6 57.2 40.4 58.1 54.7 55.0 56.8 54.7 59.6
Nov 53.9 53.8 56.1 48.1 53.5 39.3 56.1 50.8 48.5 56.9 55.4 59.5
Dec 54.2 57.9 53.5 47.2 52.8 39.3 61.6 52.8 50.8 52.8 56.0 65.7
2010 Jan 59.7 65.4 67.7 47.2 57.9 49.2 61.7 62.3 61.5 59.4 60.1 70.6
Feb 62.2 70.4 66.3 54.3 59.4 52.9 65.5 65.0 66.9 60.6 59.8 70.2
Mar 62.4 66.7 66.4 54.5 66.6 51.4 64.8 60.3 63.4 66.1 64.2 71.6
Apr 66.0 70.9 69.6 58.0 69.2 46.8 66.6 65.4 64.9 79.3 61.7 79.9
May 67.8 70.8 73.6 62.1 73.6 52.5 64.0 66.1 66.9 74.4 61.6 73.4
Jun 65.3 64.9 71.2 63.2 71.8 53.6 60.4 63.7 63.2 72.5 61.6 72.0
Jul 60.3 62.1 62.4 56.3 68.2 53.6 58.0 58.4 62.1 70.8 56.8 71.6
Aug 63.9 66.3 68.0 61.5 66.7 53.0 60.4 63.4 65.1 69.7 58.7 75.0
Sep 64.8 66.2 70.2 61.7 68.7 52.6 61.4 64.9 61.9 73.2 60.3 70.0
Oct 60.9 60.5 62.5 58.4 67.3 46.3 58.9 56.6 57.6 65.8 57.9 69.5
Nov 58.9 55.9 61.0 59.4 65.3 47.9 55.2 53.1 52.8 67.6 59.7 69.6
Dec 56.0 57.6 56.2 54.3 60.5 52.1 55.9 58.3 53.4 67.2 56.6 72.2
2011 Jan 59.4 62.7 62.3 54.9 60.6 50.7 61.5 59.6 59.0 75.3 57.3 71.7
Feb 61.5 62.2 65.9 60.3 65.0 53.7 61.6 57.4 60.5 76.4 60.3 72.8
Mar 59.6 58.6 63.9 57.6 65.4 53.1 56.9 55.1 56.8 74.0 60.8 73.4
Apr 61.7 64.3 65.0 58.9 65.8 55.4 60.3 59.0 59.6 78.1 59.9 72.8
May 57.7 57.3 62.3 56.1 62.9 57.5 54.0 58.4 57.8 66.2 57.8 69.4
Jun 55.6 56.1 58.1 54.1 59.9 54.8 55.8 52.4 53.7 61.8 54.0 63.1
Jul 45.8 39.7 39.2 53.5 56.9 52.0 43.1 38.1 47.5 50.5 46.0 62.4
Aug 51.7 51.3 54.4 51.7 50.7 52.4 50.7 46.6 53.0 47.7 50.7 57.8
Sep 49.4 46.8 51.6 51.3 49.4 51.6 48.1 48.1 46.5 48.4 47.1 52.5
Oct 48.9 48.1 47.1 50.0 48.1 45.1 46.2 47.7 44.9 38.5 45.2 50.3
Nov 45.2 42.6 42.9 47.4 43.5 43.4 43.8 42.9 39.6 39.0 42.6 48.4
Dec 44.8 41.2 42.8 46.7 46.0 44.8 44.2 39.9 40.4 37.7 43.4 57.7
2012 Jan 49.6 51.0 50.7 45.2 47.3 45.5 49.7 46.9 49.7 49.0 49.3 57.2
Feb 51.1 52.4 53.1 47.6 50.7 50.7 51.7 50.0 50.7 52.5 51.0 59.8
Mar 51.5 53.3 51.3 49.0 49.0 44.6 52.6 50.0 51.3 56.3 50.0 58.6
Apr 52.4 54.4 54.7 48.0 50.3 47.2 54.7 50.7 55.5 56.5 50.3 57.5
May 50.8 51.3 54.0 48.0 49.0 50.0 52.6 47.0 50.0 49.0 48.3 55.0
3 (4)