SlideShare ist ein Scribd-Unternehmen logo
1 von 4
Downloaden Sie, um offline zu lesen
Purchasing Managers’ Index – Services                                                        July 4, 2012


Services PMI falls to 47.4 in June – fewer jobs in services
companies as economy cools
 The purchasing managers’ index for services (Services PMI) dropped from 47.7 in
  May to 47.4 in June. This is the lowest level since the summer of 2009 and indicates
  that the cooling trend in the service economy is still underway.

 Employment contributed most to the drop in the Services PMI, followed by delivery
  times. Even though the indices for business activity and new orders rose in July,
  they remained outside the growth zone.

 Service companies have scaled back their business plans for the next six months in
  response to the weaker global economy and shrinking order backlogs. This is also
  likely to mean that hiring activity will be limited.

 The index for supplier intermediate goods prices dropped from 51.0 in May to 50.9
  in June. Weak demand and a shaky global economy are contributing to fewer
  companies reporting rising intermediate goods prices, which should also decrease
  domestic price pressure in the Swedish economy.


                                                                                          Services PMI
                                                                                      (Purchasing Managers’
                                                                                         Index - Services)
                                                                                     Seasonally adjusted
                                                                                    2012 Jun. 47.4
                                                                                          May 47.7
                                                                                          Apr. 48.6
                                                                                          Mar. 52.5
                                                                                          Feb. 54.0
                                                                                          Jan. 54.3
                                                                                          Dec. 51.0
                                                                                          Nov. 48.8
                                                                                          Oct. 48.9
                                                                                          Sep. 51.1
                                                                                          Aug. 53.4
                                                                                          Jul. 54.0
                                                                                          Jun. 53.9


                         Next publication of Services PMI: Friday August 3, 2012


            Jörgen Kennemar Swedbank, Economic Research Department, +46 (0)8-5859 7730
                       Administration, +46 (0)8-5859 7740, ek.sekr@swedbank.se
                    Sebastian Bergfelt, Silf, +46 (0)73-944 6450, professionals@silf.se


                                                  1 (4)
Silf/Swedbank’s Purchasing Managers’ Index Service Sector. seasonally adjusted
                           Components of PMI                               Other indicies            Forecast

             Total index    Business    Delivery    New         Employ-     Back -log       Prices    Planned
                             activity    times     orders        ment       of orders                business
                                                                                                       activity
  2006 oct     61,7           68,0       55,3      62,8             58,4      56,6          54,9       68,2
       nov     64,3           65,7       62,1      63,6             66,0      60,5          55,8       73,6
       dec     67,4           71,9       59,9      68,3             67,9      58,8          53,2       75,4
  2007 jan     65,7           70,4       61,0      66,7             62,7      62,2          57,7       73,9
       feb     62,2           69,8       60,1      61,9             55,4      61,6          60,0       69,7
       mar     58,9           59,9       54,5      61,0             58,2      56,2          55,8       68,0
       apr     66,1           73,4       59,6      69,6             57,4      64,5          57,8       66,5
       may     61,0           62,3       59,4      62,4             58,6      66,6          60,3       66,7
       jun     62,4           62,4       57,3      64,9             63,4      62,4          55,3       63,6
       jul     60,2           63,7       61,2      60,9             53,5      59,9          58,4       64,8
       aug     57,1           58,0       58,9      55,0             57,5      53,2          58,5       61,2
       sep     58,6           59,6       57,6      55,7             63,3      57,6          52,8       62,8
       oct     57,7           56,6       57,0      57,2             60,4      53,8          57,5       70,0
       nov     61,2           67,4       55,4      61,7             58,5      59,3          61,5       55,3
       dec     62,2           67,0       57,2      61,2             62,9      64,9          62,1       60,4
  2008 jan     57,3           59,5       52,7      55,7             61,8      55,1          63,1       67,5
       feb     55,9           56,3       54,3      57,8             53,5      58,7          61,1       63,9
       mar     54,0           53,3       52,1      53,2             58,3      52,0          59,2       70,7
       apr     52,7           53,6       48,8      49,6             60,7      53,0          56,0       61,7
       may     60,9           68,7       50,4      57,9             66,7      56,2          56,6       64,0
       jun     52,4           55,9       49,7      47,8             58,8      45,7          63,8       63,7
       jul     53,1           57,4       45,4      49,2             62,5      44,7          66,2       59,5
       aug     50,5           53,0       49,4      45,5             57,3      49,3          57,4       61,0
       sep     52,5           56,8       48,0      47,6             60,2      39,2          58,1       57,1
       oct     43,0           44,8       46,0      36,0             49,7      44,9          58,2       49,1
       nov     44,3           44,2       50,1      37,6             50,4      36,4          53,6       43,4
       dec     38,2           37,8       40,0      36,7             39,5      37,2          45,2       40,5
  2009 jan     34,8           32,8       42,4      34,5             30,2      27,2          48,5       33,9
       feb     37,6           36,4       38,8      35,2             42,4      34,7          47,3       40,5
       mar     40,1           43,3       41,2      41,7             32,5      38,6          48,1       36,0
       apr     40,1           41,4       38,6      40,0             40,2      38,9          42,5       46,3
       may     40,9           44,4       42,4      44,1             29,3      38,7          41,0       44,2
       jun     41,8           43,4       40,1      46,3             33,5      44,1          35,3       51,3
       jul     42,5           44,9       38,2      47,1             36,1      42,5          40,1       54,8
       aug     45,7           51,3       40,8      50,5             35,2      47,6          45,7       56,0
       sep     49,1           53,2       46,1      55,9             34,9      54,7          49,3       59,5
       oct     55,6           62,7       47,5      63,3             41,3      63,3          45,2       62,2
       nov     51,8           57,0       48,3      57,4             38,9      57,6          44,7       68,3
       dec     47,6           52,6       46,9      49,6             38,4      48,7          52,4       61,5
  2010 jan     54,7           59,0       50,8      58,2             47,1      55,1          48,5       61,8
       feb     60,4           63,1       54,0      66,8             52,1      60,8          46,3       74,9
       mar     60,9           64,4       58,1      63,1             55,7      59,8          55,8       71,1
       apr     62,4           66,6       60,5      64,5             55,4      61,0          60,2       73,9
       may     59,5           60,5       59,4      61,0             56,0      59,3          62,8       69,2
       jun     59,7           61,3       62,1      61,1             52,7      61,2          62,0       68,9
       jul     62,9           66,4       61,1      65,8             55,4      62,9          63,0       71,2
       aug     64,0           66,3       61,9      67,7             56,5      64,0          62,2       70,7
       sep     61,4           60,0       64,8      64,3             54,7      60,6          63,6       74,2
       oct     64,3           65,8       62,0      68,1             57,9      62,0          60,5       77,4
       nov     64,6           65,4       59,2      68,2             62,6      64,5          65,8       78,6
       dec     65,9           69,8       64,7      65,6             62,8      60,9          63,6       77,1
  2011 jan     65,1           70,2       61,3      65,0             62,6      63,6          67,0       77,9
       feb     61,4           61,7       62,6      60,5             61,7      58,4          68,9       69,2
       mar     60,4           63,8       60,2      58,3             60,0      55,2          64,5       68,9
       apr     61,1           63,2       59,8      61,4             59,1      58,1          65,1       67,4
       may     56,9           56,3       58,1      55,9             58,1      50,9          60,3       67,3
       jun     53,3           58,4       54,6      47,8             55,1      47,9          57,5       62,0
       jul     54,0           54,9       55,6      52,2             54,7      53,1          54,0       62,0
       aug     53,4           53,6       55,4      53,2             51,6      49,3          55,0       59,5
       sep     51,1           52,2       51,7      48,0             54,7      47,7          54,1       57,3
       oct     49,0           48,7       51,0      45,3             53,6      45,7          52,8       53,6
       nov     48,9           49,9       49,2      46,8             51,0      45,7          53,6       54,4
       dec     51,1           50,7       50,6      50,6             52,8      47,7          54,3       57,8
  2012 jan     54,4           54,3       50,8      56,4             54,5      55,6          55,0       59,0
       feb     54,0           57,2       50,1      54,0             54,0      48,1          53,8       60,7
       mar     52,6           54,2       52,6      52,3             51,1      51,4          53,8       61,2
       apr     48,6           47,7       51,5      47,2             49,3      48,0          52,0       56,9
       may     47,7           48,7       49,8      45,5             48,4      44,5          51,1       56,6
       jun     47,4           49,3       48,3      46,8             45,0      45,1          50,9       54,1


                                                            2 (4)
Silf/Swedbank’s Purchasing Managers’ Index Service Sector, orginal
                         Components of PMI                          Other indicies            Forecast

           Total index    Business    Delivery    New     Employ-    Back -log       Prices    Planned
                           activity    times     orders    ment      of orders                business
                                                                                                activity
2007 jan     60,9           63,3       58,3      62,2      58,2        57,1          59,2       71,4
     feb     61,7           68,9       60,0      62,2      53,3        64,0          61,1       71,1
     mar     60,6           63,4       52,4      64,6      58,5        59,8          56,1       69,5
     apr     68,7           76,2       59,5      73,8      59,5        67,9          59,5       70,2
     may     63,8           66,3       60,5      65,1      61,6        69,8          62,8       70,9
     jun     68,0           69,0       60,7      70,2      70,2        66,7          57,1       67,1
     jul     56,1           56,3       64,1      53,1      53,1        53,1          59,4       65,6
     aug     58,8           60,0       57,8      57,8      60,2        55,6          57,8       60,2
     sep     60,4           63,1       58,1      58,1      63,4        58,1          53,5       61,6
     oct     56,7           55,6       57,8      55,6      59,1        52,2          55,6       67,8
     nov     59,1           65,8       55,3      57,9      56,6        55,3          57,9       51,3
     dec     58,4           62,5       54,7      57,8      57,8        62,5          57,8       56,3
2008 jan     52,5           52,4       50,0      51,2      57,3        50,0          64,6       65,0
     feb     55,3           55,4       54,2      58,1      51,4        61,1          62,2       65,3
     mar     55,8           56,8       50,0      56,8      58,6        55,6          59,5       72,2
     apr     55,2           56,4       48,7      53,8      62,8        56,4          57,7       65,4
     may     63,6           72,7       51,5      60,6      69,7        59,4          59,1       68,2
     jun     58,0           62,5       53,1      53,1      65,6        50,0          65,6       67,2
     jul     49,1           50,0       48,3      41,4      62,1        37,9          67,2       60,3
     aug     52,3           55,0       48,3      48,3      60,0        51,7          56,7       60,0
     sep     54,3           60,3       48,5      50,0      60,3        39,7          58,8       55,9
     oct     42,0           43,8       46,8      34,4      48,4        43,3          56,3       46,9
     nov     42,2           42,6       50,0      33,8      48,5        32,4          50,0       39,4
     dec     34,4           33,3       37,5      33,3      34,4        34,8          40,9       36,4
2009 jan     30,0           25,7       39,7      30,0      25,7        22,1          50,0       31,4
     feb     37,1           35,5       38,7      35,5      40,3        37,1          48,4       41,9
     mar     41,9           46,8       39,1      45,3      32,8        42,2          48,4       37,5
     apr     42,7           44,2       38,5      44,2      42,3        42,3          44,2       50,0
     may     43,6           48,4       43,5      46,8      32,3        41,9          43,5       48,4
     jun     47,3           50,0       43,5      51,6      40,3        48,4          37,1       54,8
     jul     38,5           37,5       41,1      39,3      35,7        35,7          41,1       55,6
     aug     47,5           53,3       39,7      53,3      37,9        50,0          45,0       55,0
     sep     50,9           56,7       46,6      58,3      35,0        55,2          50,0       58,3
     oct     54,7           61,7       48,3      61,7      40,0        61,7          43,3       60,0
     nov     49,7           55,4       48,2      53,6      37,0        53,6          41,1       64,3
     dec     43,7           48,1       44,4      46,2      33,3        46,3          48,1       57,4
2010 jan     49,9           51,9       48,1      53,7      42,6        50,0          50,0       59,3
     feb     59,8           62,2       53,9      67,1      50,0        63,2          47,4       76,3
     mar     62,7           67,9       56,0      66,7      56,0        63,4          56,1       72,6
     apr     65,0           69,4       60,4      68,7      57,5        64,4          61,9       77,6
     may     62,3           64,5       60,5      63,7      59,0        62,5          65,3       73,4
     jun     65,2           67,9       65,5      66,4      59,5        65,5          63,8       72,4
     jul     58,9           59,0       64,0      58,0      55,0        56,1          64,0       72,0
     aug     65,8           68,3       60,8      70,5      59,2        66,4          61,5       69,7
     sep     63,2           63,5       65,3      66,7      54,8        61,1          64,3       73,0
     oct     63,4           64,8       62,8      66,5      56,6        60,4          58,6       75,2
     nov     62,5           63,8       59,1      64,4      60,7        60,5          62,2       74,6
     dec     62,1           65,3       62,2      62,2      57,7        58,5          59,3       73,0
2011 jan     60,3           63,1       58,6      60,5      58,1        58,5          68,5       75,4
     feb     60,9           60,8       62,5      60,8      59,6        60,8          70,0       70,6
     mar     62,2           67,3       58,1      61,9      60,3        58,8          64,8       70,4
     apr     63,6           66,0       59,7      65,6      61,2        61,5          66,8       71,1
     may     59,6           60,3       59,2      58,6      61,1        54,1          62,8       71,5
     jun     58,8           65,0       58,0      53,1      61,9        52,2          59,3       65,5
     jul     50,0           47,5       58,5      44,4      54,3        46,3          55,0       62,8
     aug     55,2           55,6       54,3      56,0      54,3        51,7          54,3       58,5
     sep     53,0           55,7       52,2      50,4      54,8        48,2          54,8       56,1
     oct     48,0           47,7       51,8      43,7      52,3        44,1          50,9       51,4
     nov     46,8           48,3       49,1      43,0      49,1        41,7          50,0       50,4
     dec     47,2           46,2       48,1      47,2      47,7        45,3          50,0       53,7
2012 jan     49,6           47,2       48,1      51,9      50,0        50,5          56,5       56,5
     feb     53,5           56,3       50,0      54,3      51,9        50,5          54,9       62,1
     mar     54,4           57,7       50,5      55,9      51,4        55,0          54,1       62,7
     apr     51,2           50,5       51,4      51,4      51,4        51,4          53,7       60,6
     may     50,5           52,7       50,9      48,2      51,4        47,7          53,6       60,8
     jun     52,3           55,4       51,4      51,4      50,9        48,6          52,3       56,8


                                                  3 (4)
4 (4)

Weitere ähnliche Inhalte

Mehr von Swedbank

Mehr von Swedbank (20)

Swedbank corporate presentation April 25 2017
Swedbank corporate presentation April 25 2017Swedbank corporate presentation April 25 2017
Swedbank corporate presentation April 25 2017
 
Swedbank foretagspresentation 25 april 2017
Swedbank foretagspresentation 25 april 2017Swedbank foretagspresentation 25 april 2017
Swedbank foretagspresentation 25 april 2017
 
Delårsrapport kv1 2017
Delårsrapport kv1 2017Delårsrapport kv1 2017
Delårsrapport kv1 2017
 
Interim report q1 2017
Interim report q1 2017Interim report q1 2017
Interim report q1 2017
 
Year end report 2016
Year end report 2016Year end report 2016
Year end report 2016
 
Bokslutskommuniké 2016
Bokslutskommuniké 2016Bokslutskommuniké 2016
Bokslutskommuniké 2016
 
Swedbank företagspresentation, 2 februari 2017
Swedbank företagspresentation, 2 februari 2017Swedbank företagspresentation, 2 februari 2017
Swedbank företagspresentation, 2 februari 2017
 
Swedbank corporate presentation, February 2 2017
Swedbank corporate presentation, February 2 2017Swedbank corporate presentation, February 2 2017
Swedbank corporate presentation, February 2 2017
 
Swedbank Corporate Presentation, October 25 2016
Swedbank Corporate Presentation, October 25 2016Swedbank Corporate Presentation, October 25 2016
Swedbank Corporate Presentation, October 25 2016
 
Swedbank företagspresentation, 25 oktober 2016
Swedbank företagspresentation, 25 oktober 2016Swedbank företagspresentation, 25 oktober 2016
Swedbank företagspresentation, 25 oktober 2016
 
Swedbank Corporate Presentation, June 30 2016
Swedbank Corporate Presentation, June 30 2016Swedbank Corporate Presentation, June 30 2016
Swedbank Corporate Presentation, June 30 2016
 
Swedbank företagspresentation, 30 juni 2016
Swedbank företagspresentation, 30 juni 2016Swedbank företagspresentation, 30 juni 2016
Swedbank företagspresentation, 30 juni 2016
 
Swedbank företagspresentation kvartal 1, 2016.
Swedbank företagspresentation kvartal 1, 2016.Swedbank företagspresentation kvartal 1, 2016.
Swedbank företagspresentation kvartal 1, 2016.
 
Swedbank corporate presentation Q4, 2015
Swedbank corporate presentation Q4, 2015Swedbank corporate presentation Q4, 2015
Swedbank corporate presentation Q4, 2015
 
Swedbank företagspresentation kvartal 4,2015
Swedbank företagspresentation kvartal 4,2015Swedbank företagspresentation kvartal 4,2015
Swedbank företagspresentation kvartal 4,2015
 
Year end report 2015
Year end report 2015Year end report 2015
Year end report 2015
 
Bokslutskommuniké 2015
Bokslutskommuniké 2015Bokslutskommuniké 2015
Bokslutskommuniké 2015
 
Swedbank Företagspresentation, September 2015
Swedbank Företagspresentation, September 2015Swedbank Företagspresentation, September 2015
Swedbank Företagspresentation, September 2015
 
Swedbank Corporate Presentation, September 2015
Swedbank Corporate Presentation, September 2015Swedbank Corporate Presentation, September 2015
Swedbank Corporate Presentation, September 2015
 
Swedbank's third quarter 2015 results
Swedbank's third quarter 2015 resultsSwedbank's third quarter 2015 results
Swedbank's third quarter 2015 results
 

Purchasing Managers' Index Services - June 2012

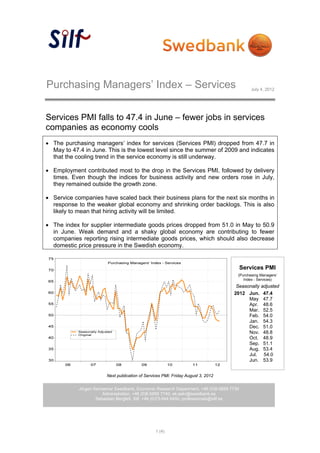
  • 1. Purchasing Managers’ Index – Services July 4, 2012 Services PMI falls to 47.4 in June – fewer jobs in services companies as economy cools  The purchasing managers’ index for services (Services PMI) dropped from 47.7 in May to 47.4 in June. This is the lowest level since the summer of 2009 and indicates that the cooling trend in the service economy is still underway.  Employment contributed most to the drop in the Services PMI, followed by delivery times. Even though the indices for business activity and new orders rose in July, they remained outside the growth zone.  Service companies have scaled back their business plans for the next six months in response to the weaker global economy and shrinking order backlogs. This is also likely to mean that hiring activity will be limited.  The index for supplier intermediate goods prices dropped from 51.0 in May to 50.9 in June. Weak demand and a shaky global economy are contributing to fewer companies reporting rising intermediate goods prices, which should also decrease domestic price pressure in the Swedish economy.   Services PMI (Purchasing Managers’ Index - Services) Seasonally adjusted 2012 Jun. 47.4 May 47.7 Apr. 48.6 Mar. 52.5 Feb. 54.0 Jan. 54.3 Dec. 51.0 Nov. 48.8 Oct. 48.9 Sep. 51.1 Aug. 53.4 Jul. 54.0 Jun. 53.9 Next publication of Services PMI: Friday August 3, 2012 Jörgen Kennemar Swedbank, Economic Research Department, +46 (0)8-5859 7730 Administration, +46 (0)8-5859 7740, ek.sekr@swedbank.se Sebastian Bergfelt, Silf, +46 (0)73-944 6450, professionals@silf.se 1 (4)
  • 2. Silf/Swedbank’s Purchasing Managers’ Index Service Sector. seasonally adjusted Components of PMI Other indicies Forecast Total index Business Delivery New Employ- Back -log Prices Planned activity times orders ment of orders business activity 2006 oct 61,7 68,0 55,3 62,8 58,4 56,6 54,9 68,2 nov 64,3 65,7 62,1 63,6 66,0 60,5 55,8 73,6 dec 67,4 71,9 59,9 68,3 67,9 58,8 53,2 75,4 2007 jan 65,7 70,4 61,0 66,7 62,7 62,2 57,7 73,9 feb 62,2 69,8 60,1 61,9 55,4 61,6 60,0 69,7 mar 58,9 59,9 54,5 61,0 58,2 56,2 55,8 68,0 apr 66,1 73,4 59,6 69,6 57,4 64,5 57,8 66,5 may 61,0 62,3 59,4 62,4 58,6 66,6 60,3 66,7 jun 62,4 62,4 57,3 64,9 63,4 62,4 55,3 63,6 jul 60,2 63,7 61,2 60,9 53,5 59,9 58,4 64,8 aug 57,1 58,0 58,9 55,0 57,5 53,2 58,5 61,2 sep 58,6 59,6 57,6 55,7 63,3 57,6 52,8 62,8 oct 57,7 56,6 57,0 57,2 60,4 53,8 57,5 70,0 nov 61,2 67,4 55,4 61,7 58,5 59,3 61,5 55,3 dec 62,2 67,0 57,2 61,2 62,9 64,9 62,1 60,4 2008 jan 57,3 59,5 52,7 55,7 61,8 55,1 63,1 67,5 feb 55,9 56,3 54,3 57,8 53,5 58,7 61,1 63,9 mar 54,0 53,3 52,1 53,2 58,3 52,0 59,2 70,7 apr 52,7 53,6 48,8 49,6 60,7 53,0 56,0 61,7 may 60,9 68,7 50,4 57,9 66,7 56,2 56,6 64,0 jun 52,4 55,9 49,7 47,8 58,8 45,7 63,8 63,7 jul 53,1 57,4 45,4 49,2 62,5 44,7 66,2 59,5 aug 50,5 53,0 49,4 45,5 57,3 49,3 57,4 61,0 sep 52,5 56,8 48,0 47,6 60,2 39,2 58,1 57,1 oct 43,0 44,8 46,0 36,0 49,7 44,9 58,2 49,1 nov 44,3 44,2 50,1 37,6 50,4 36,4 53,6 43,4 dec 38,2 37,8 40,0 36,7 39,5 37,2 45,2 40,5 2009 jan 34,8 32,8 42,4 34,5 30,2 27,2 48,5 33,9 feb 37,6 36,4 38,8 35,2 42,4 34,7 47,3 40,5 mar 40,1 43,3 41,2 41,7 32,5 38,6 48,1 36,0 apr 40,1 41,4 38,6 40,0 40,2 38,9 42,5 46,3 may 40,9 44,4 42,4 44,1 29,3 38,7 41,0 44,2 jun 41,8 43,4 40,1 46,3 33,5 44,1 35,3 51,3 jul 42,5 44,9 38,2 47,1 36,1 42,5 40,1 54,8 aug 45,7 51,3 40,8 50,5 35,2 47,6 45,7 56,0 sep 49,1 53,2 46,1 55,9 34,9 54,7 49,3 59,5 oct 55,6 62,7 47,5 63,3 41,3 63,3 45,2 62,2 nov 51,8 57,0 48,3 57,4 38,9 57,6 44,7 68,3 dec 47,6 52,6 46,9 49,6 38,4 48,7 52,4 61,5 2010 jan 54,7 59,0 50,8 58,2 47,1 55,1 48,5 61,8 feb 60,4 63,1 54,0 66,8 52,1 60,8 46,3 74,9 mar 60,9 64,4 58,1 63,1 55,7 59,8 55,8 71,1 apr 62,4 66,6 60,5 64,5 55,4 61,0 60,2 73,9 may 59,5 60,5 59,4 61,0 56,0 59,3 62,8 69,2 jun 59,7 61,3 62,1 61,1 52,7 61,2 62,0 68,9 jul 62,9 66,4 61,1 65,8 55,4 62,9 63,0 71,2 aug 64,0 66,3 61,9 67,7 56,5 64,0 62,2 70,7 sep 61,4 60,0 64,8 64,3 54,7 60,6 63,6 74,2 oct 64,3 65,8 62,0 68,1 57,9 62,0 60,5 77,4 nov 64,6 65,4 59,2 68,2 62,6 64,5 65,8 78,6 dec 65,9 69,8 64,7 65,6 62,8 60,9 63,6 77,1 2011 jan 65,1 70,2 61,3 65,0 62,6 63,6 67,0 77,9 feb 61,4 61,7 62,6 60,5 61,7 58,4 68,9 69,2 mar 60,4 63,8 60,2 58,3 60,0 55,2 64,5 68,9 apr 61,1 63,2 59,8 61,4 59,1 58,1 65,1 67,4 may 56,9 56,3 58,1 55,9 58,1 50,9 60,3 67,3 jun 53,3 58,4 54,6 47,8 55,1 47,9 57,5 62,0 jul 54,0 54,9 55,6 52,2 54,7 53,1 54,0 62,0 aug 53,4 53,6 55,4 53,2 51,6 49,3 55,0 59,5 sep 51,1 52,2 51,7 48,0 54,7 47,7 54,1 57,3 oct 49,0 48,7 51,0 45,3 53,6 45,7 52,8 53,6 nov 48,9 49,9 49,2 46,8 51,0 45,7 53,6 54,4 dec 51,1 50,7 50,6 50,6 52,8 47,7 54,3 57,8 2012 jan 54,4 54,3 50,8 56,4 54,5 55,6 55,0 59,0 feb 54,0 57,2 50,1 54,0 54,0 48,1 53,8 60,7 mar 52,6 54,2 52,6 52,3 51,1 51,4 53,8 61,2 apr 48,6 47,7 51,5 47,2 49,3 48,0 52,0 56,9 may 47,7 48,7 49,8 45,5 48,4 44,5 51,1 56,6 jun 47,4 49,3 48,3 46,8 45,0 45,1 50,9 54,1 2 (4)
  • 3. Silf/Swedbank’s Purchasing Managers’ Index Service Sector, orginal Components of PMI Other indicies Forecast Total index Business Delivery New Employ- Back -log Prices Planned activity times orders ment of orders business activity 2007 jan 60,9 63,3 58,3 62,2 58,2 57,1 59,2 71,4 feb 61,7 68,9 60,0 62,2 53,3 64,0 61,1 71,1 mar 60,6 63,4 52,4 64,6 58,5 59,8 56,1 69,5 apr 68,7 76,2 59,5 73,8 59,5 67,9 59,5 70,2 may 63,8 66,3 60,5 65,1 61,6 69,8 62,8 70,9 jun 68,0 69,0 60,7 70,2 70,2 66,7 57,1 67,1 jul 56,1 56,3 64,1 53,1 53,1 53,1 59,4 65,6 aug 58,8 60,0 57,8 57,8 60,2 55,6 57,8 60,2 sep 60,4 63,1 58,1 58,1 63,4 58,1 53,5 61,6 oct 56,7 55,6 57,8 55,6 59,1 52,2 55,6 67,8 nov 59,1 65,8 55,3 57,9 56,6 55,3 57,9 51,3 dec 58,4 62,5 54,7 57,8 57,8 62,5 57,8 56,3 2008 jan 52,5 52,4 50,0 51,2 57,3 50,0 64,6 65,0 feb 55,3 55,4 54,2 58,1 51,4 61,1 62,2 65,3 mar 55,8 56,8 50,0 56,8 58,6 55,6 59,5 72,2 apr 55,2 56,4 48,7 53,8 62,8 56,4 57,7 65,4 may 63,6 72,7 51,5 60,6 69,7 59,4 59,1 68,2 jun 58,0 62,5 53,1 53,1 65,6 50,0 65,6 67,2 jul 49,1 50,0 48,3 41,4 62,1 37,9 67,2 60,3 aug 52,3 55,0 48,3 48,3 60,0 51,7 56,7 60,0 sep 54,3 60,3 48,5 50,0 60,3 39,7 58,8 55,9 oct 42,0 43,8 46,8 34,4 48,4 43,3 56,3 46,9 nov 42,2 42,6 50,0 33,8 48,5 32,4 50,0 39,4 dec 34,4 33,3 37,5 33,3 34,4 34,8 40,9 36,4 2009 jan 30,0 25,7 39,7 30,0 25,7 22,1 50,0 31,4 feb 37,1 35,5 38,7 35,5 40,3 37,1 48,4 41,9 mar 41,9 46,8 39,1 45,3 32,8 42,2 48,4 37,5 apr 42,7 44,2 38,5 44,2 42,3 42,3 44,2 50,0 may 43,6 48,4 43,5 46,8 32,3 41,9 43,5 48,4 jun 47,3 50,0 43,5 51,6 40,3 48,4 37,1 54,8 jul 38,5 37,5 41,1 39,3 35,7 35,7 41,1 55,6 aug 47,5 53,3 39,7 53,3 37,9 50,0 45,0 55,0 sep 50,9 56,7 46,6 58,3 35,0 55,2 50,0 58,3 oct 54,7 61,7 48,3 61,7 40,0 61,7 43,3 60,0 nov 49,7 55,4 48,2 53,6 37,0 53,6 41,1 64,3 dec 43,7 48,1 44,4 46,2 33,3 46,3 48,1 57,4 2010 jan 49,9 51,9 48,1 53,7 42,6 50,0 50,0 59,3 feb 59,8 62,2 53,9 67,1 50,0 63,2 47,4 76,3 mar 62,7 67,9 56,0 66,7 56,0 63,4 56,1 72,6 apr 65,0 69,4 60,4 68,7 57,5 64,4 61,9 77,6 may 62,3 64,5 60,5 63,7 59,0 62,5 65,3 73,4 jun 65,2 67,9 65,5 66,4 59,5 65,5 63,8 72,4 jul 58,9 59,0 64,0 58,0 55,0 56,1 64,0 72,0 aug 65,8 68,3 60,8 70,5 59,2 66,4 61,5 69,7 sep 63,2 63,5 65,3 66,7 54,8 61,1 64,3 73,0 oct 63,4 64,8 62,8 66,5 56,6 60,4 58,6 75,2 nov 62,5 63,8 59,1 64,4 60,7 60,5 62,2 74,6 dec 62,1 65,3 62,2 62,2 57,7 58,5 59,3 73,0 2011 jan 60,3 63,1 58,6 60,5 58,1 58,5 68,5 75,4 feb 60,9 60,8 62,5 60,8 59,6 60,8 70,0 70,6 mar 62,2 67,3 58,1 61,9 60,3 58,8 64,8 70,4 apr 63,6 66,0 59,7 65,6 61,2 61,5 66,8 71,1 may 59,6 60,3 59,2 58,6 61,1 54,1 62,8 71,5 jun 58,8 65,0 58,0 53,1 61,9 52,2 59,3 65,5 jul 50,0 47,5 58,5 44,4 54,3 46,3 55,0 62,8 aug 55,2 55,6 54,3 56,0 54,3 51,7 54,3 58,5 sep 53,0 55,7 52,2 50,4 54,8 48,2 54,8 56,1 oct 48,0 47,7 51,8 43,7 52,3 44,1 50,9 51,4 nov 46,8 48,3 49,1 43,0 49,1 41,7 50,0 50,4 dec 47,2 46,2 48,1 47,2 47,7 45,3 50,0 53,7 2012 jan 49,6 47,2 48,1 51,9 50,0 50,5 56,5 56,5 feb 53,5 56,3 50,0 54,3 51,9 50,5 54,9 62,1 mar 54,4 57,7 50,5 55,9 51,4 55,0 54,1 62,7 apr 51,2 50,5 51,4 51,4 51,4 51,4 53,7 60,6 may 50,5 52,7 50,9 48,2 51,4 47,7 53,6 60,8 jun 52,3 55,4 51,4 51,4 50,9 48,6 52,3 56,8 3 (4)