Purchasing Managers´ Index Services, December 2011
•
0 gefällt mir•213 views

Purchasing Managers´ Index Services, December 2011: Services PMI climbs to 50.9 in December: signs of recovery but risk of further decline remains

Empfohlen
Weitere ähnliche Inhalte
Mehr von Swedbank
Mehr von Swedbank (20)
Purchasing Managers´ Index Services, December 2011
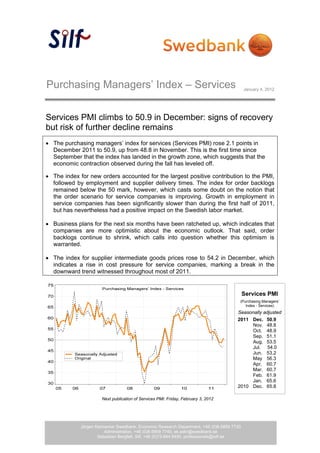
- 1. Purchasing Managers’ Index – Services January 4, 2012 Services PMI climbs to 50.9 in December: signs of recovery but risk of further decline remains The purchasing managers’ index for services (Services PMI) rose 2.1 points in December 2011 to 50.9, up from 48.8 in November. This is the first time since September that the index has landed in the growth zone, which suggests that the economic contraction observed during the fall has leveled off. The index for new orders accounted for the largest positive contribution to the PMI, followed by employment and supplier delivery times. The index for order backlogs remained below the 50 mark, however, which casts some doubt on the notion that the order scenario for service companies is improving. Growth in employment in service companies has been significantly slower than during the first half of 2011, but has nevertheless had a positive impact on the Swedish labor market. Business plans for the next six months have been ratcheted up, which indicates that companies are more optimistic about the economic outlook. That said, order backlogs continue to shrink, which calls into question whether this optimism is warranted. The index for supplier intermediate goods prices rose to 54.2 in December, which indicates a rise in cost pressure for service companies, marking a break in the downward trend witnessed throughout most of 2011. Services PMI (Purchasing Managers’ Index - Services) Seasonally adjusted 2011 Dec. 50.9 Nov. 48.8 Oct. 48.9 Sep. 51.1 Aug. 53.5 Jul. 54.0 Jun. 53.2 May 56.3 Apr. 60.7 Mar. 60.7 Feb. 61.9 Jan. 65.6 2010 Dec. 65.8 Next publication of Services PMI: Friday, February 3, 2012 Jörgen Kennemar Swedbank, Economic Research Department, +46 (0)8-5859 7730 1 (3) Administration, +46 (0)8-5859 7740, ek.sekr@swedbank.se Sebastian Bergfelt, Silf, +46 (0)73-944 6450, professionals@silf.se
- 2. Silf/Swedbank’s Purchasing Managers’ Index Service Sector. seasonally adjusted Components of PMI Other indicies Forecast Total index Business Delivery New Employ- Back -log Prices Planned activity times orders ment of orders business activity 2006 okt 61,7 68,0 55,4 62,7 58,5 56,4 54,9 68,1 nov 64,2 65,6 62,2 63,4 66,0 60,3 55,8 73,4 dec 67,3 71,7 59,9 68,0 67,9 58,5 53,1 75,0 2007 jan 66,2 70,7 60,8 67,8 63,0 63,3 58,0 74,0 feb 62,7 70,6 59,9 62,6 55,7 61,5 60,1 70,3 mar 59,2 60,3 54,8 61,5 58,1 56,7 55,9 68,6 apr 65,7 72,8 59,7 69,2 57,0 64,4 57,7 66,3 maj 60,4 61,7 59,3 61,5 58,1 65,8 59,9 66,3 jun 62,4 62,3 57,2 64,9 63,3 62,4 55,3 63,6 jul 60,1 63,6 61,1 60,9 53,4 59,9 58,5 64,8 aug 57,1 58,0 58,9 55,0 57,6 53,2 58,5 61,2 sep 58,6 59,6 57,6 55,7 63,3 57,6 52,9 62,8 okt 57,6 56,6 57,1 57,1 60,5 53,6 57,5 69,9 nov 61,2 67,3 55,5 61,5 58,5 59,1 61,5 55,1 dec 62,0 66,8 57,2 60,9 62,9 64,6 62,0 60,0 2008 jan 57,8 59,8 52,5 56,8 62,1 56,2 63,4 67,6 feb 56,3 57,1 54,1 58,5 53,8 58,6 61,2 64,5 mar 54,3 53,7 52,4 53,7 58,2 52,5 59,3 71,3 apr 52,3 53,0 48,9 49,2 60,3 52,9 55,9 61,5 maj 60,3 68,1 50,3 57,0 66,2 55,4 56,2 63,6 jun 52,3 55,8 49,6 47,8 58,7 45,7 63,8 63,7 jul 53,1 57,3 45,3 49,2 62,4 44,7 66,3 59,5 aug 50,6 53,0 49,4 45,5 57,4 49,3 57,4 61,0 sep 52,5 56,8 48,0 47,6 60,2 39,2 58,2 57,1 okt 42,9 44,8 46,1 35,9 49,8 44,7 58,2 49,0 nov 44,2 44,1 50,2 37,4 50,4 36,2 53,6 43,2 dec 38,0 37,6 40,0 36,4 39,5 36,9 45,1 40,1 2009 jan 35,3 33,1 42,2 35,6 30,5 28,3 48,8 34,0 feb 38,1 37,2 38,6 35,9 42,7 34,6 47,4 41,1 mar 40,5 43,7 41,5 42,2 32,4 39,1 48,2 36,6 apr 39,7 40,8 38,7 39,6 39,8 38,8 42,4 46,1 maj 40,3 43,8 42,3 43,2 28,8 37,9 40,6 43,8 juni 41,7 43,3 40,0 46,3 33,4 44,1 35,3 51,3 juli 42,5 44,8 38,1 47,1 36,0 42,5 40,2 54,8 aug 45,7 51,3 40,8 50,5 35,3 47,6 45,7 56,0 sep 49,1 53,2 46,1 55,9 34,9 54,7 49,4 59,5 okt 55,6 62,7 47,6 63,2 41,4 63,1 45,2 62,1 nov 51,7 56,9 48,4 57,2 38,9 57,4 44,7 68,1 dec 47,4 52,4 46,9 49,3 38,4 48,4 52,3 61,1 2010 jan 55,2 59,3 50,6 59,3 47,4 56,2 48,8 61,9 feb 60,8 63,9 53,8 67,5 52,4 60,7 46,4 75,5 mar 61,2 64,8 58,4 63,6 55,6 60,3 55,9 71,7 apr 62,0 66,0 60,6 64,1 55,0 60,9 60,1 73,7 maj 59,0 59,9 59,3 60,1 55,5 58,5 62,4 68,8 juni 59,6 61,2 62,0 61,1 52,6 61,2 62,0 68,9 juli 62,9 66,3 61,0 65,8 55,3 62,9 63,1 71,2 aug 64,0 66,3 61,9 67,7 56,6 64,0 62,2 70,7 sep 61,4 60,0 64,8 64,3 54,7 60,6 63,7 74,2 okt 64,2 65,8 62,1 68,0 58,0 61,8 60,5 77,3 nov 64,5 65,3 59,3 68,0 62,6 64,3 65,8 78,4 dec 65,8 69,6 64,7 65,3 62,8 60,6 63,5 76,7 2011 jan 65,6 70,5 61,1 66,1 62,9 64,7 67,3 78,0 feb 61,9 62,5 62,4 61,2 62,0 58,3 69,0 69,8 mar 60,7 64,2 60,5 58,8 59,9 55,7 64,6 69,5 apr 60,7 62,6 59,9 61,0 58,7 58,0 65,0 67,2 maj 56,3 55,7 58,0 55,0 57,6 50,1 59,9 66,9 juni 53,2 58,3 54,5 47,8 55,0 47,9 57,5 62,0 juli 54,0 54,8 55,5 52,2 54,6 53,1 54,1 62,0 aug 53,5 53,6 55,4 53,2 51,7 49,3 55,0 59,5 sep 51,1 52,2 51,7 48,0 54,7 47,7 54,2 57,3 okt 48,9 48,7 51,1 45,2 53,7 45,5 52,8 53,5 nov 48,8 49,8 49,3 46,6 51,0 45,5 53,6 54,2 dec 50,9 50,5 50,6 50,3 52,8 47,4 54,2 57,4 2 (3)
- 3. Silf/Swedbank’s Purchasing Managers’ Index Service Sector, orginal Components of PMI Other indicies Forecast Total index Business Delivery New Employ- Back -log Prices Planned activity times orders ment of orders business activity 2006 okt 60,8 67,0 56,1 61,2 57,1 55,0 53,0 66,0 nov 62,2 64,1 62,0 59,8 64,1 56,5 52,2 69,6 dec 63,6 67,4 57,4 64,9 62,8 56,4 48,9 71,3 2007 jan 60,9 63,3 58,3 62,2 58,2 57,1 59,2 71,4 feb 61,7 68,9 60,0 62,2 53,3 64,0 61,1 71,1 mar 60,6 63,4 52,4 64,6 58,5 59,8 56,1 69,5 apr 68,7 76,2 59,5 73,8 59,5 67,9 59,5 70,2 maj 63,8 66,3 60,5 65,1 61,6 69,8 62,8 70,9 jun 68,0 69,0 60,7 70,2 70,2 66,7 57,1 67,1 jul 56,1 56,3 64,1 53,1 53,1 53,1 59,4 65,6 aug 58,8 60,0 57,8 57,8 60,2 55,6 57,8 60,2 sep 60,4 63,1 58,1 58,1 63,4 58,1 53,5 61,6 okt 56,7 55,6 57,8 55,6 59,1 52,2 55,6 67,8 nov 59,1 65,8 55,3 57,9 56,6 55,3 57,9 51,3 dec 58,4 62,5 54,7 57,8 57,8 62,5 57,8 56,3 2008 jan 52,5 52,4 50,0 51,2 57,3 50,0 64,6 65,0 feb 55,3 55,4 54,2 58,1 51,4 61,1 62,2 65,3 mar 55,8 56,8 50,0 56,8 58,6 55,6 59,5 72,2 apr 55,2 56,4 48,7 53,8 62,8 56,4 57,7 65,4 maj 63,6 72,7 51,5 60,6 69,7 59,4 59,1 68,2 jun 58,0 62,5 53,1 53,1 65,6 50,0 65,6 67,2 jul 49,1 50,0 48,3 41,4 62,1 37,9 67,2 60,3 aug 52,3 55,0 48,3 48,3 60,0 51,7 56,7 60,0 sep 54,3 60,3 48,5 50,0 60,3 39,7 58,8 55,9 okt 42,0 43,8 46,8 34,4 48,4 43,3 56,3 46,9 nov 42,2 42,6 50,0 33,8 48,5 32,4 50,0 39,4 dec 34,4 33,3 37,5 33,3 34,4 34,8 40,9 36,4 2009 jan 30,0 25,7 39,7 30,0 25,7 22,1 50,0 31,4 feb 37,1 35,5 38,7 35,5 40,3 37,1 48,4 41,9 mar 41,9 46,8 39,1 45,3 32,8 42,2 48,4 37,5 apr 42,7 44,2 38,5 44,2 42,3 42,3 44,2 50,0 maj 43,6 48,4 43,5 46,8 32,3 41,9 43,5 48,4 juni 47,3 50,0 43,5 51,6 40,3 48,4 37,1 54,8 juli 38,5 37,5 41,1 39,3 35,7 35,7 41,1 55,6 aug 47,5 53,3 39,7 53,3 37,9 50,0 45,0 55,0 sep 50,9 56,7 46,6 58,3 35,0 55,2 50,0 58,3 okt 54,7 61,7 48,3 61,7 40,0 61,7 43,3 60,0 nov 49,7 55,4 48,2 53,6 37,0 53,6 41,1 64,3 dec 43,7 48,1 44,4 46,2 33,3 46,3 48,1 57,4 2010 jan 49,9 51,9 48,1 53,7 42,6 50,0 50,0 59,3 feb 59,8 62,2 53,9 67,1 50,0 63,2 47,4 76,3 mar 62,7 67,9 56,0 66,7 56,0 63,4 56,1 72,6 apr 65,0 69,4 60,4 68,7 57,5 64,4 61,9 77,6 maj 62,3 64,5 60,5 63,7 59,0 62,5 65,3 73,4 juni 65,2 67,9 65,5 66,4 59,5 65,5 63,8 72,4 juli 58,9 59,0 64,0 58,0 55,0 56,1 64,0 72,0 aug 65,8 68,3 60,8 70,5 59,2 66,4 61,5 69,7 sep 63,2 63,5 65,3 66,7 54,8 61,1 64,3 73,0 okt 63,4 64,8 62,8 66,5 56,6 60,4 58,6 75,2 nov 62,5 63,8 59,1 64,4 60,7 60,5 62,2 74,6 dec 62,1 65,3 62,2 62,2 57,7 58,5 59,3 73,0 2011 jan 60,3 63,1 58,6 60,5 58,1 58,5 68,5 75,4 feb 60,9 60,8 62,5 60,8 59,6 60,8 70,0 70,6 mar 62,2 67,3 58,1 61,9 60,3 58,8 64,8 70,4 apr 63,6 66,0 59,7 65,6 61,2 61,5 66,8 71,1 maj 59,6 60,3 59,2 58,6 61,1 54,1 62,8 71,5 juni 58,8 65,0 58,0 53,1 61,9 52,2 59,3 65,5 juli 50,0 47,5 58,5 44,4 54,3 46,3 55,0 62,8 aug 55,2 55,6 54,3 56,0 54,3 51,7 54,3 58,5 sep 53,0 55,7 52,2 50,4 54,8 48,2 54,8 56,1 okt 48,0 47,7 51,8 43,7 52,3 44,1 50,9 51,4 nov 46,8 48,3 49,1 43,0 49,1 41,7 50,0 50,4 dec 47,2 46,2 48,1 47,2 47,7 45,3 50,0 53,7 3 (3)