SlideShare ist ein Scribd-Unternehmen logo
1 von 8
Downloaden Sie, um offline zu lesen
Housing Affordability Index for Baltics
Measures how well households can afford their purchases of apartments in the three Baltic capitals

                                                                                                                 14 December, 2011


The housing affordability index (HAI) increased to 141.1 in Riga and
105.2 in Vilnius, but decreased to 144.2 in Tallinn
          During the third quarter of this year, housing affordability strengthened the most in Vilnius: the
           housing affordability index (HAI) – which is calculated for a family whose income is equal to
           1.5 of average net wages with an average-sized apartment of 55 sq. m. – increased to 105.2
           from 103.8 in the second quarter. The HAI in Riga increased less, from 140.7 to 141.1, while
           in Tallinn it dropped to 144.2 from the second quarter’s 156.9. This means that in the third
           quarter households’ income from wages in Vilnius was 5.2%--and in Riga 41.1% and in Tallinn
           44.2%--higher than needed to afford an apartment, according to our norm of 30% of net
           wages for mortgage costs.
          Although the main reason for the significant decrease of housing affordability in Tallinn was
           the sharp increase in apartment prices, seasonal wage fluctuations and somewhat higher in-
           terest rates and other related charges on new mortgages had an impact as well. Apartment
           prices in the third quarter increased by 3.4% from the second quarter, while interest rates and
           other related charges on mortgages were up slightly from 3.72% to 3.77%.
          In Vilnius, the affordability increase was fuelled by a 1.9% drop in apartment prices on a quar-
           terly basis. The positive impact was diminished slightly by a rise in interest rates and other re-
           lated charges on mortgages of 4 basis points and 0.1% lower wages, compared with the sec-
           ond quarter.
          In Riga, the HAI rose over the same period despite an increase in interest rates and other re-
           lated charges on mortgages; this increase was offset by lower apartment prices and higher
           wages.
          The time needed to save for a down payment decreased marginally in Riga and Vilnius, to
           25.7 and 35.4 months respectively, but increased in Tallinn by 2 months to 26.4 months.
          The HAI is 100 when households use 30% of their net wages for mortgage costs. When the
           HAI is at least 100, households can afford their housing, according to the established norm.
           The higher the number, the higher the affordability.

                                                            Housing affordability index


190
                                                    179.5
180
170                                                                                                               Vilnius   Riga    Tallinn
160
150                                                             156.4                                  2005        69.6     66.5    109.3
                                                                                    144.2
140                                                                                 141.1              2006        56.5     60.3     76.3
130
120                                                                                                    2007        51.0     53.4     67.2
110
                                                                                     105.2             2008        55.3     77.8     86.6
100
 90                                                                                                    2009        86.4     140.5   161.5
 80                                                                                          Vilnius
 70
                                                                                                       2010       103.2     137.3   160.4
                                                                                             Riga
 60                                                                                                    2011 Q1    102.4     136.0   161.3
 50                                                                                          Tallinn
                                                                                                       2011 Q2    103.8     140.7   156.9
 40
    2005        2006         2007        2008        2009        2010        2011                      2011 Q3    105.2     141.1   144.2
 Source: National central banks, ECB, National statistical departments, Lithuanian Centre of
 Registers, Latv ian State Land Serv ice and National Real Estate Cadastre, Estonian Land Board,
 Swedbank

                                                 Economic Research Department.
                                   Swedbank AB. SE-105 34 Stockholm. Phone +46-8-5859 1000
                                      E-mail: ek.sekr@swedbank.com www.swedbank.com
                               Legally responsible publisher: Cecilia Hermansson, +46-8-5859 7720
                  Dainis Stikuts +371 67 445 844; Vaiva Šečkutė +370 2 582156; Annika Paabut +372 888 5440
Components of the HAI: apartment prices, interest rates, and wages
Apartment prices
In the third quarter of this year, the price of apartments increased in Tallinn by 3.4%, but decreased in
Vilnius and Riga by 1.9% and 0.9%, respectively, compared with the previous quarter. Nevertheless,
on an annual basis, apartment prices fell only in Riga – the price of a standard apartment was 1.6%
lower in Riga, but 4.1% higher in Vilnius and 18% higher in Tallinn.
In the third quarter, the average-sized apartment of 55 sq. m. apartment was the most expensive in
Tallinn, where its price reached EUR 58,751 and became higher than in Vilnius for the first time in four
years. A standard apartment cost EUR 57,889 in Vilnius and EUR 41,333 in Riga.
The main reason for the rising prices of apartments on an annual basis is the economic recovery,
which has been the strongest in Estonia, as well as the lower interest rates, which have made hous-
ing more affordable and thus pushed up prices. Falling unemployment and less uncertainty about fu-
ture income could also have influenced buyers’ activity, although the number of transactions remains
well below the level of the boom years.
In Estonia - where price growth has been substantially higher - an extra boost to rising prices, in our
opinion, has come from the strongly improved confidence. This, in part, is connected to the change-
over to the euro, which has eliminated currency risk in the economy, possibly made borrowers more
optimistic, and made the country more attractive to foreign investors.

                                                    Apartment prices, EUR/m2

               70
                               63.5
                                                 60.3
               60


               50                  48.2
                                                                                                              Vilnius
                                                                                                              Riga
               40
                                                                                                  35.4        Tallinn

               30
                                                                                                 26.4
                                                                                                 25.7
               20


               10
                 2005       2006          2007          2008    2009       2010        2011
               Source: National statistical departments, Lithuanian Centre of Registers, Latv ian State Land Serv ice
               and National Real Estate Cadastre, Estonian Land Board, Swedbank


Interest rates on mortgages
Interest rates and other related charges for new mortgages (annual percentage rate of charge) in-
creased in the third quarter of this year the most in Latvia (from 4.07% in the second quarter to
4.16%). In Estonia, these rates climbed by 6 basis points to 3.77% and in Lithuania by 4 points to
3.93%. This growth in the annual percentage rate of charge for mortgages is most likely related to the
increase in the ECB's policy rate in mid-July (from 1.25% to 1.5%) and also to the higher risk premium
due to the greater risk aversion in financial markets – as a result, the three-month euro interbank of-
fered rate (EURIBOR) increased from 1.36% in the second quarter of 2011 to 1.51% in the third quar-
ter.
The affordability improvement in Riga was dampened because that city experienced the fastest in-
crease in interest rates and other related charges. The index would have been by 3.8 points higher
than in Tallinn if Latvia had enjoyed the same rates as Estonia because the difference between
apartment prices and wages was more favourable in Riga than in Tallinn.


2                                                               Housing Affordability Index for Baltics • December, 2011
Annual percentage rate of charge for new mortgages to households
               8.0%
                                                               7.8%
               7.5%

               7.0%
                                                            6.5%
               6.5%

               6.0%                                                                                       Lithuania
                                                            6.4%
               5.5%                                                                                       Estonia
                                                                                                          Latv ia
               5.0%

               4.5%
                                                                                                  4.16%
               4.0%                                                                               3.93%
                                                                                                  3.77%
               3.5%

               3.0%
                      2005        2006     2007      2008          2009     2010      2011
                                                                             Source: National central banks, ECB


Average net wages
The average net wages of a households grew slightly only in Riga, by 0.5%, from the second quarter
of 2011 to the third. Meanwhile, households in Tallinn faced a 4.3% decrease in their income from
wages, but this was due only to seasonal factors. Vilnius households experienced a smaller decrease
of 0.1%. On a yearly basis, average net household wages in Tallinn increased the most, reaching
EUR 1,115, 6.9% more than in the third quarter of 2010. In Riga, these wages increased by 4.1% to
EUR 804.6, and in Vilnius by 2.4% to EUR 816.7.
The higher housing affordability in Tallinn compared with Vilnius is mostly determined by the differ-
ence in wages. In Tallinn, households earn 36.5% more than in Vilnius, while apartment prices are
nearly on the same level.

                                                  Average net wage, EUR
               800
               750                                                                                 743 EUR
               700
               650
               600
               550                                                                                 544 EUR
                                                                                                  536 EUR
               500
               450
               400                                                                                         Riga
               350                                                                                         Vilnius
               300                                                                                         Tallinn
               250
               200
                     2005       2006      2007      2008           2009     2010        2011
                                                                          Source: National statistical departments


The HAI value of 144.2 in Tallinn means that households’ income from wages in this city is 44.2%
higher than required to afford an apartment, according to our norm (mortgage costs account for 30%
of net wages of a household, which earns 1.5 of the average net wage). In Latvia, meanwhile, house-
holds’ income from wages is 41.1% higher, and in Vilnius 5.2% higher than required to fulfil this norm.
In the third quarter, mortgage costs amounted to 20.8% of households’ net wages in Tallinn, 21.3% in
Riga, and 28.5% in Vilnius.
Net income from wages of households in Vilnius needs to be at least EUR 776.7 to meet the norm of
affordability (defined in paragraph above). This required income is lower in Tallinn (EUR 773.1), as
slightly higher apartment prices are compensated for by a lower annual percentage rate of charge for
mortgages. Meanwhile, households in Riga, which enjoy the lowest apartment prices, have to earn
only EUR 570.2 to afford an apartment. However, at the moment, households in Vilnius enjoy wages
that are similar to Riga’s and much lower than in Tallinn.


3                                                             Housing Affordability Index for Baltics • December, 2011
Compared with a year ago, the income margin when purchasing an apartment – or the HAI value –
increased by 6.3 points in Riga and 0.3 point in Vilnius. This is because apartment prices increased
faster in Vilnius (4.1% growth vs. 1.6% decrease) and wages increased less (2.4% vs. 4.1%) even
though interest rates and other related charges for mortgages fell more in Vilnius than in Riga (16 ba-
sis points vs. 9 basis points). Meanwhile, the income margin in Tallinn narrowed by 13.2 points in a
year. This was caused by a rise in apartment prices so rapid (18%) that it could not be offset even
by a 6.9% increase in net wages, or by a drop in interest rates of 9 basis points. This is an opposite
trend from that in Riga, where average net wages increased while apartment prices shrank.
Months to save for a down payment
In Vilnius and Riga, the number of months needed to save for a down payment, which equals 15% of
an apartment price, fell by less than a month to 35.4 and 25.7, respectively, from the second quarter
to the third quarter. However, this number increased by 2 months to 26.4 in Tallinn because of a si-
multaneous rise in apartment prices and fall in wages on a quarterly basis. Nevertheless, it still takes 9
months less to save for a down payment in Tallinn than in Vilnius.
It is assumed that household saves 30% of its net wages every month for a down payment.

                                             Months to save for a down payment
               70
                               63.5
                                                 60.3
               60


               50                  48.2
                                                                                                              Vilnius
                                                                                                              Riga
               40
                                                                                                  35.4        Tallinn

               30
                                                                                                 26.4
                                                                                                25.7
               20


               10
                 2005       2006          2007          2008    2009       2010        2011
               Source: National statistical departments, Lithuanian Centre of Registers, Latv ian State Land Serv ice
               and National Real Estate Cadastre, Estonian Land Board, Swedbank


Sensitivity analysis
Sensitivity analysis shows that, if interest rates were to rise by 2 percentage points, the affordability
margin would disappear in Vilnius and households’ income would be too low, by 16.3%, to afford an
apartment. An increase in interest rates of 2 percentage points would cause the margin to decrease by
28.8 percentage points in Riga and by 29.7 percentage points in Tallinn, but the HAI would remain
above 100 – at 112.6 and 114.4 in the respective capitals.
The margins would disappear in all three Baltic capitals if apartment prices were to increase by 5.2%
in Vilnius, 41.1% in Riga, and 44.2% in Tallinn—i.e., by the amount of the current margins. House-
holds would no longer be able to afford apartments if interest rates were to increase by more than 0.42
percentage points in Vilnius, by more than 3.16 percentage points in Riga, and by more than 3.29 per-
centage points in Tallinn.


4                                                               Housing Affordability Index for Baltics • December, 2011
Housing affordability index: method

Purpose                 Measure changes in household buying power primarily as relates to apart-
                        ment purchases, but can also provide indications on existing housing.

Norm                    Household mortgage costs according to our definition should not exceed
                        30% of net wages of a household.

Definition of housing
affordability index     Actual income in relation to income required to meet the “norm,” where
                        mortgage costs account for 30% of net wages of a household. If the index
                        = 100, households are using 30% of their net wages. If the index > 100,
                        household buying power exceeds the norm. And if the index < 100, house-
                        hold buying power is below the norm. Index is calculated according to the
                        following formula:

                                 AverageINC
                         HAI               *100
                                    NINC
                        where
                                    PMT
                         NINC          .
                                    30%
                        HAI - housing affordability index
                        AverageINC – 1.5 of average monthly net wages
                        NINC - net wages that would satisfy the “norm”
                        PMT - monthly mortgage payment

Variables                Three-month average prices of apartments of average size (55 sq. m.)
                        in capitals
                         Average net wages of a household, which equal 1.5 of average monthly
                          net wages in capital cities
                         Three-month average interest rates and other related charges (or an-
                          nual percentage rate of charge - a rate that comprises an interest compo-
                          nent and a component of other charges) for new housing loans to house-
                          holds issued in euros for Latvia and Estonia and weighted against dif-
                          ferent currencies (the litas and the euro) in Lithuania-- produce the
                          monthly mortgage cost, assuming a 15% down payment and 30-year
                          term

Limits                  The housing affordability index includes mortgage costs but excludes taxes
                        and subsidies, including property tax and interest deductions. The index
                        provides an indication of the situation for households composed of one or
                        two working people, which, combined, earn one-and-a-half times the aver-
                        age monthly wage; however, it does not reflect conditions for individual
                        households. The index does not provide any direct guidance for business
                        decisions, including lending and interest rate decisions. The index reflects
                        household buying power based on apartment purchases that have been
                        made, but says nothing about opportunities for apartment sales.

                        The housing affordability index is of informative nature and reflects macro-
                        economic developments rather than banks' decisions and lending policies
                        or possible decisions made by individual households.

Periodicity             Quarterly
Geography               Vilnius, Riga, Tallinn


5                                                Housing Affordability Index for Baltics • December, 2011
Appendix 1

                   Housing affordability         Months to save for a
                          index                    down payment


                Vilnius     Riga    Tallinn    Vilnius    Riga    Tallinn
    2005 Q1       72.6      64.4     113.7       46.7     50.0     32.7
    2005 Q2       69.8      66.7     118.4       53.1     53.1     32.7
    2005 Q3       75.2      66.4     105.2       50.9     53.5     37.4
    2005 Q4       60.5      68.3     100.1       58.9     52.5     38.6
    2006 Q1       58.6      60.0      84.2       62.8     57.6     44.0
    2006 Q2       55.8      63.4      81.2       63.5     53.5     44.0
    2006 Q3       58.6      57.9      70.4       58.3     56.3     48.2
    2006 Q4       53.1      60.0      69.5       62.1     52.0     46.9
    2007 Q1       54.4      53.0      65.5       59.1     57.4     47.8
    2007 Q2       51.1      52.0      67.4       59.6     56.7     45.3
    2007 Q3       50.0      47.5      62.6       59.1     60.3     46.9
    2007 Q4       48.5      61.1      73.2       59.9     46.0     39.5
    2008 Q1       54.1      70.5      80.5       55.3     40.7     37.3
    2008 Q2       53.5      75.4      87.1       54.4     36.4     34.0
    2008 Q3       54.4      80.0      83.3       51.7     31.9     33.5
    2008 Q4       59.0      85.3      95.4       48.4     28.8     29.8
    2009 Q1       68.8     116.8     129.6       44.1     25.1     25.6
    2009 Q2       87.7     148.3     160.0       38.1     22.0     22.3
    2009 Q3       93.9     140.7     179.5       36.3     25.1     20.6
    2009 Q4       95.5     156.4     176.9       35.6     22.8     21.3
    2010 Q1      100.6     138.5     160.5       35.3     26.3     23.1
    2010 Q2      102.6     137.2     162.9       35.8     26.4     23.1
    2010 Q3      104.9     134.8     157.3       34.9     27.2     23.9
    2010 Q4      104.6     138.6     160.9       35.4     26.7     23.8
    2011 Q1      102.4     136.0     161.3       36.4     26.9     23.7
    2011 Q2      103.8     140.7     156.9       36.1     26.1     24.4
    2011 Q3      105.2     141.1     144.2       35.4     25.7     26.4
    High         105.2     156.4     179.5       63.5     60.3     48.2
    Low           48.5      47.5      62.6       34.9     22.0     20.6
    Average       74.0      94.9     115.1       48.4     39.5     33.2
    Sources: National central banks, National statistical departments,
    Lithuanian Centre of Registers, Latvian State Land Service and
    National Real Estate Cadastre, Estonian Land Board, Swedbank


6                                                                 Housing Affordability Index for Baltics • December, 2011
Economic Research Department

Sweden
Cecilia Hermansson             +46 8 5859 7720   cecilia.hermansson@swedbank.se
Group Chief Economist
Chief Economist, Sweden

Magnus Alvesson                +46 8 5859 3341   magnus.alvesson@swedbank.se
Senior Economist

Jörgen Kennemar                +46 8 5859 7730   jorgen.kennemar@swedbank.se
Senior Economist

Anna Ibegbulem                 +46 8 5859 7740   anna.ibegbulem@swedbank.se
Assistant

Estonia
Annika Paabut                  +372 888 5440     annika.paabut@swedbank.ee
Chief Economist

Elina Allikalt                 +372 888 1989     elina.allikalt@swedbank.ee
Senior Economist

Latvia
Mārtiņš Kazāks                 +371 67 445 859   martins.kazaks@swedbank.lv
Deputy Group Chief Economist
Chief Economist, Latvia

Dainis Stikuts                 +371 67 445 844   dainis.stikuts@swedbank.lv
Senior Economist

Lija Strašuna                  +371 67 445 875   lija.strasuna@swedbank.lv
Senior Economist

Lithuania
Nerijus Mačiulis               +370 5 258 2237   nerijus.maciulis@swedbank.lt
Chief Economist, Lithuania

Lina Vrubliauskienė            +370 5 258 2275   lina.vrubliauskiene@swedbank.lt
Senior Economist

Vaiva Šečkutė                  +370 5 258 2156   vaiva.seckute@swedbank.lt
Senior Economist


7                                                      Housing Affordability Index for Baltics • December, 2011
Disclaimer
This research report has been prepared by economists of Swedbank’s Economic Research Department. The Economic Research Depart-
ment consists of research units in Estonia, Latvia, Lithuania, and Sweden, is independent of other departments of Swedbank AB (publ)
(“Swedbank”) and responsible for preparing reports on global and home market economic developments. The activities of this research
department differ from the activities of other departments of Swedbank, and therefore the opinions expressed in the reports are independ-
ent from interests and opinions that might be expressed by other employees of Swedbank.
This report is based on information available to the public, which is deemed to be reliable, and reflects the economists’ personal and
professional opinions of such information. It reflects the economists’ best understanding of the information at the moment the research
was prepared and due to change of circumstances such understanding might change accordingly.
This report has been prepared pursuant to the best skills of the economists and with respect to their best knowledge this report is correct
and accurate, however neither Swedbank nor any enterprise belonging to Swedbank or Swedbank directors, officers, or other employees
or affiliates shall be liable for any loss or damage, direct or indirect, based on any flaws or faults within this report.
Enterprises belonging to Swedbank might have holdings in the enterprises mentioned in this report and provide financial services (issue
loans, among others) to them. Aforementioned circumstances might influence the economic activities of such companies and the prices
of securities issued by them.
The research presented to you is of an informative nature. This report should in no way be interpreted as a promise or confirmation of
Swedbank or any of its directors, officers, or employees that the events described in the report shall take place or that the forecasts turn
out to be accurate. This report is not a recommendation to invest into securities or in any other way enter into any financial transactions
based on the report. Swedbank and its directors, officers, or employees shall not be liable for any loss that you may suffer as a result of
relying on this report.
We stress that forecasting the developments of the economic environment is somewhat speculative in nature, and the real situation might
turn out different from what this report presumes.
IF YOU DECIDE TO OPERATE ON THE BASIS OF THIS REPORT, THEN YOU ACT SOLELY ON YOUR OWN RISK AND
ARE OBLIGED TO VERIFY AND ESTIMATE THE ECONOMIC REASONABILITY AND THE RISKS OF SUCH ACTION INDE-
PENDENTLY.


8                                                             Housing Affordability Index for Baltics • December, 2011

Weitere ähnliche Inhalte

Mehr von Swedbank

Swedbank corporate presentation April 25 2017
Swedbank corporate presentation April 25 2017Swedbank corporate presentation April 25 2017
Swedbank corporate presentation April 25 2017Swedbank
 
Swedbank foretagspresentation 25 april 2017
Swedbank foretagspresentation 25 april 2017Swedbank foretagspresentation 25 april 2017
Swedbank foretagspresentation 25 april 2017Swedbank
 
Delårsrapport kv1 2017
Delårsrapport kv1 2017Delårsrapport kv1 2017
Delårsrapport kv1 2017Swedbank
 
Interim report q1 2017
Interim report q1 2017Interim report q1 2017
Interim report q1 2017Swedbank
 
Year end report 2016
Year end report 2016Year end report 2016
Year end report 2016Swedbank
 
Bokslutskommuniké 2016
Bokslutskommuniké 2016Bokslutskommuniké 2016
Bokslutskommuniké 2016Swedbank
 
Swedbank företagspresentation, 2 februari 2017
Swedbank företagspresentation, 2 februari 2017Swedbank företagspresentation, 2 februari 2017
Swedbank företagspresentation, 2 februari 2017Swedbank
 
Swedbank corporate presentation, February 2 2017
Swedbank corporate presentation, February 2 2017Swedbank corporate presentation, February 2 2017
Swedbank corporate presentation, February 2 2017Swedbank
 
Swedbank Corporate Presentation, October 25 2016
Swedbank Corporate Presentation, October 25 2016Swedbank Corporate Presentation, October 25 2016
Swedbank Corporate Presentation, October 25 2016Swedbank
 
Swedbank företagspresentation, 25 oktober 2016
Swedbank företagspresentation, 25 oktober 2016Swedbank företagspresentation, 25 oktober 2016
Swedbank företagspresentation, 25 oktober 2016Swedbank
 
Swedbank Corporate Presentation, June 30 2016
Swedbank Corporate Presentation, June 30 2016Swedbank Corporate Presentation, June 30 2016
Swedbank Corporate Presentation, June 30 2016Swedbank
 
Swedbank företagspresentation, 30 juni 2016
Swedbank företagspresentation, 30 juni 2016Swedbank företagspresentation, 30 juni 2016
Swedbank företagspresentation, 30 juni 2016Swedbank
 
Swedbank corporate presentation Q1, 2016
Swedbank corporate presentation Q1, 2016Swedbank corporate presentation Q1, 2016
Swedbank corporate presentation Q1, 2016Swedbank
 
Swedbank företagspresentation kvartal 1, 2016.
Swedbank företagspresentation kvartal 1, 2016.Swedbank företagspresentation kvartal 1, 2016.
Swedbank företagspresentation kvartal 1, 2016.Swedbank
 
Swedbank corporate presentation Q4, 2015
Swedbank corporate presentation Q4, 2015Swedbank corporate presentation Q4, 2015
Swedbank corporate presentation Q4, 2015Swedbank
 
Swedbank företagspresentation kvartal 4,2015
Swedbank företagspresentation kvartal 4,2015Swedbank företagspresentation kvartal 4,2015
Swedbank företagspresentation kvartal 4,2015Swedbank
 
Year end report 2015
Year end report 2015Year end report 2015
Year end report 2015Swedbank
 
Bokslutskommuniké 2015
Bokslutskommuniké 2015Bokslutskommuniké 2015
Bokslutskommuniké 2015Swedbank
 
Swedbank Företagspresentation, September 2015
Swedbank Företagspresentation, September 2015Swedbank Företagspresentation, September 2015
Swedbank Företagspresentation, September 2015Swedbank
 
Swedbank Corporate Presentation, September 2015
Swedbank Corporate Presentation, September 2015Swedbank Corporate Presentation, September 2015
Swedbank Corporate Presentation, September 2015Swedbank
 

Mehr von Swedbank (20)

Swedbank corporate presentation April 25 2017
Swedbank corporate presentation April 25 2017Swedbank corporate presentation April 25 2017
Swedbank corporate presentation April 25 2017
 
Swedbank foretagspresentation 25 april 2017
Swedbank foretagspresentation 25 april 2017Swedbank foretagspresentation 25 april 2017
Swedbank foretagspresentation 25 april 2017
 
Delårsrapport kv1 2017
Delårsrapport kv1 2017Delårsrapport kv1 2017
Delårsrapport kv1 2017
 
Interim report q1 2017
Interim report q1 2017Interim report q1 2017
Interim report q1 2017
 
Year end report 2016
Year end report 2016Year end report 2016
Year end report 2016
 
Bokslutskommuniké 2016
Bokslutskommuniké 2016Bokslutskommuniké 2016
Bokslutskommuniké 2016
 
Swedbank företagspresentation, 2 februari 2017
Swedbank företagspresentation, 2 februari 2017Swedbank företagspresentation, 2 februari 2017
Swedbank företagspresentation, 2 februari 2017
 
Swedbank corporate presentation, February 2 2017
Swedbank corporate presentation, February 2 2017Swedbank corporate presentation, February 2 2017
Swedbank corporate presentation, February 2 2017
 
Swedbank Corporate Presentation, October 25 2016
Swedbank Corporate Presentation, October 25 2016Swedbank Corporate Presentation, October 25 2016
Swedbank Corporate Presentation, October 25 2016
 
Swedbank företagspresentation, 25 oktober 2016
Swedbank företagspresentation, 25 oktober 2016Swedbank företagspresentation, 25 oktober 2016
Swedbank företagspresentation, 25 oktober 2016
 
Swedbank Corporate Presentation, June 30 2016
Swedbank Corporate Presentation, June 30 2016Swedbank Corporate Presentation, June 30 2016
Swedbank Corporate Presentation, June 30 2016
 
Swedbank företagspresentation, 30 juni 2016
Swedbank företagspresentation, 30 juni 2016Swedbank företagspresentation, 30 juni 2016
Swedbank företagspresentation, 30 juni 2016
 
Swedbank corporate presentation Q1, 2016
Swedbank corporate presentation Q1, 2016Swedbank corporate presentation Q1, 2016
Swedbank corporate presentation Q1, 2016
 
Swedbank företagspresentation kvartal 1, 2016.
Swedbank företagspresentation kvartal 1, 2016.Swedbank företagspresentation kvartal 1, 2016.
Swedbank företagspresentation kvartal 1, 2016.
 
Swedbank corporate presentation Q4, 2015
Swedbank corporate presentation Q4, 2015Swedbank corporate presentation Q4, 2015
Swedbank corporate presentation Q4, 2015
 
Swedbank företagspresentation kvartal 4,2015
Swedbank företagspresentation kvartal 4,2015Swedbank företagspresentation kvartal 4,2015
Swedbank företagspresentation kvartal 4,2015
 
Year end report 2015
Year end report 2015Year end report 2015
Year end report 2015
 
Bokslutskommuniké 2015
Bokslutskommuniké 2015Bokslutskommuniké 2015
Bokslutskommuniké 2015
 
Swedbank Företagspresentation, September 2015
Swedbank Företagspresentation, September 2015Swedbank Företagspresentation, September 2015
Swedbank Företagspresentation, September 2015
 
Swedbank Corporate Presentation, September 2015
Swedbank Corporate Presentation, September 2015Swedbank Corporate Presentation, September 2015
Swedbank Corporate Presentation, September 2015
 

Kürzlich hochgeladen

Call Girls Service Pune ₹7.5k Pick Up & Drop With Cash Payment 9352852248 Cal...
Call Girls Service Pune ₹7.5k Pick Up & Drop With Cash Payment 9352852248 Cal...Call Girls Service Pune ₹7.5k Pick Up & Drop With Cash Payment 9352852248 Cal...
Call Girls Service Pune ₹7.5k Pick Up & Drop With Cash Payment 9352852248 Cal...roshnidevijkn ( Why You Choose Us? ) Escorts
 
Top Rated Pune Call Girls Aundh ⟟ 6297143586 ⟟ Call Me For Genuine Sex Servi...
Top Rated  Pune Call Girls Aundh ⟟ 6297143586 ⟟ Call Me For Genuine Sex Servi...Top Rated  Pune Call Girls Aundh ⟟ 6297143586 ⟟ Call Me For Genuine Sex Servi...
Top Rated Pune Call Girls Aundh ⟟ 6297143586 ⟟ Call Me For Genuine Sex Servi...Call Girls in Nagpur High Profile
 
( Jasmin ) Top VIP Escorts Service Dindigul 💧 7737669865 💧 by Dindigul Call G...
( Jasmin ) Top VIP Escorts Service Dindigul 💧 7737669865 💧 by Dindigul Call G...( Jasmin ) Top VIP Escorts Service Dindigul 💧 7737669865 💧 by Dindigul Call G...
( Jasmin ) Top VIP Escorts Service Dindigul 💧 7737669865 💧 by Dindigul Call G...dipikadinghjn ( Why You Choose Us? ) Escorts
 
VIP Independent Call Girls in Taloja 🌹 9920725232 ( Call Me ) Mumbai Escorts ...
VIP Independent Call Girls in Taloja 🌹 9920725232 ( Call Me ) Mumbai Escorts ...VIP Independent Call Girls in Taloja 🌹 9920725232 ( Call Me ) Mumbai Escorts ...
VIP Independent Call Girls in Taloja 🌹 9920725232 ( Call Me ) Mumbai Escorts ...dipikadinghjn ( Why You Choose Us? ) Escorts
 
Top Rated Pune Call Girls Viman Nagar ⟟ 6297143586 ⟟ Call Me For Genuine Sex...
Top Rated  Pune Call Girls Viman Nagar ⟟ 6297143586 ⟟ Call Me For Genuine Sex...Top Rated  Pune Call Girls Viman Nagar ⟟ 6297143586 ⟟ Call Me For Genuine Sex...
Top Rated Pune Call Girls Viman Nagar ⟟ 6297143586 ⟟ Call Me For Genuine Sex...Call Girls in Nagpur High Profile
 
VIP Independent Call Girls in Andheri 🌹 9920725232 ( Call Me ) Mumbai Escorts...
VIP Independent Call Girls in Andheri 🌹 9920725232 ( Call Me ) Mumbai Escorts...VIP Independent Call Girls in Andheri 🌹 9920725232 ( Call Me ) Mumbai Escorts...
VIP Independent Call Girls in Andheri 🌹 9920725232 ( Call Me ) Mumbai Escorts...dipikadinghjn ( Why You Choose Us? ) Escorts
 
WhatsApp 📞 Call : 9892124323 ✅Call Girls In Chembur ( Mumbai ) secure service
WhatsApp 📞 Call : 9892124323  ✅Call Girls In Chembur ( Mumbai ) secure serviceWhatsApp 📞 Call : 9892124323  ✅Call Girls In Chembur ( Mumbai ) secure service
WhatsApp 📞 Call : 9892124323 ✅Call Girls In Chembur ( Mumbai ) secure servicePooja Nehwal
 
Stock Market Brief Deck (Under Pressure).pdf
Stock Market Brief Deck (Under Pressure).pdfStock Market Brief Deck (Under Pressure).pdf
Stock Market Brief Deck (Under Pressure).pdfMichael Silva
 
Webinar on E-Invoicing for Fintech Belgium
Webinar on E-Invoicing for Fintech BelgiumWebinar on E-Invoicing for Fintech Belgium
Webinar on E-Invoicing for Fintech BelgiumFinTech Belgium
 
Mira Road Awesome 100% Independent Call Girls NUmber-9833754194-Dahisar Inter...
Mira Road Awesome 100% Independent Call Girls NUmber-9833754194-Dahisar Inter...Mira Road Awesome 100% Independent Call Girls NUmber-9833754194-Dahisar Inter...
Mira Road Awesome 100% Independent Call Girls NUmber-9833754194-Dahisar Inter...priyasharma62062
 
Gurley shaw Theory of Monetary Economics.
Gurley shaw Theory of Monetary Economics.Gurley shaw Theory of Monetary Economics.
Gurley shaw Theory of Monetary Economics.Vinodha Devi
 
Solution Manual for Financial Accounting, 11th Edition by Robert Libby, Patri...
Solution Manual for Financial Accounting, 11th Edition by Robert Libby, Patri...Solution Manual for Financial Accounting, 11th Edition by Robert Libby, Patri...
Solution Manual for Financial Accounting, 11th Edition by Robert Libby, Patri...ssifa0344
 
Booking open Available Pune Call Girls Shivane 6297143586 Call Hot Indian Gi...
Booking open Available Pune Call Girls Shivane  6297143586 Call Hot Indian Gi...Booking open Available Pune Call Girls Shivane  6297143586 Call Hot Indian Gi...
Booking open Available Pune Call Girls Shivane 6297143586 Call Hot Indian Gi...Call Girls in Nagpur High Profile
 
Navi Mumbai Cooperetive Housewife Call Girls-9833754194-Natural Panvel Enjoye...
Navi Mumbai Cooperetive Housewife Call Girls-9833754194-Natural Panvel Enjoye...Navi Mumbai Cooperetive Housewife Call Girls-9833754194-Natural Panvel Enjoye...
Navi Mumbai Cooperetive Housewife Call Girls-9833754194-Natural Panvel Enjoye...priyasharma62062
 
Business Principles, Tools, and Techniques in Participating in Various Types...
Business Principles, Tools, and Techniques  in Participating in Various Types...Business Principles, Tools, and Techniques  in Participating in Various Types...
Business Principles, Tools, and Techniques in Participating in Various Types...jeffreytingson
 
Mira Road Memorable Call Grls Number-9833754194-Bhayandar Speciallty Call Gir...
Mira Road Memorable Call Grls Number-9833754194-Bhayandar Speciallty Call Gir...Mira Road Memorable Call Grls Number-9833754194-Bhayandar Speciallty Call Gir...
Mira Road Memorable Call Grls Number-9833754194-Bhayandar Speciallty Call Gir...priyasharma62062
 
Call Girls Koregaon Park Call Me 7737669865 Budget Friendly No Advance Booking
Call Girls Koregaon Park Call Me 7737669865 Budget Friendly No Advance BookingCall Girls Koregaon Park Call Me 7737669865 Budget Friendly No Advance Booking
Call Girls Koregaon Park Call Me 7737669865 Budget Friendly No Advance Bookingroncy bisnoi
 
Top Rated Pune Call Girls Pashan ⟟ 6297143586 ⟟ Call Me For Genuine Sex Serv...
Top Rated  Pune Call Girls Pashan ⟟ 6297143586 ⟟ Call Me For Genuine Sex Serv...Top Rated  Pune Call Girls Pashan ⟟ 6297143586 ⟟ Call Me For Genuine Sex Serv...
Top Rated Pune Call Girls Pashan ⟟ 6297143586 ⟟ Call Me For Genuine Sex Serv...Call Girls in Nagpur High Profile
 
VIP Independent Call Girls in Bandra West 🌹 9920725232 ( Call Me ) Mumbai Esc...
VIP Independent Call Girls in Bandra West 🌹 9920725232 ( Call Me ) Mumbai Esc...VIP Independent Call Girls in Bandra West 🌹 9920725232 ( Call Me ) Mumbai Esc...
VIP Independent Call Girls in Bandra West 🌹 9920725232 ( Call Me ) Mumbai Esc...dipikadinghjn ( Why You Choose Us? ) Escorts
 

Kürzlich hochgeladen (20)

Call Girls Service Pune ₹7.5k Pick Up & Drop With Cash Payment 9352852248 Cal...
Call Girls Service Pune ₹7.5k Pick Up & Drop With Cash Payment 9352852248 Cal...Call Girls Service Pune ₹7.5k Pick Up & Drop With Cash Payment 9352852248 Cal...
Call Girls Service Pune ₹7.5k Pick Up & Drop With Cash Payment 9352852248 Cal...
 
Top Rated Pune Call Girls Aundh ⟟ 6297143586 ⟟ Call Me For Genuine Sex Servi...
Top Rated  Pune Call Girls Aundh ⟟ 6297143586 ⟟ Call Me For Genuine Sex Servi...Top Rated  Pune Call Girls Aundh ⟟ 6297143586 ⟟ Call Me For Genuine Sex Servi...
Top Rated Pune Call Girls Aundh ⟟ 6297143586 ⟟ Call Me For Genuine Sex Servi...
 
( Jasmin ) Top VIP Escorts Service Dindigul 💧 7737669865 💧 by Dindigul Call G...
( Jasmin ) Top VIP Escorts Service Dindigul 💧 7737669865 💧 by Dindigul Call G...( Jasmin ) Top VIP Escorts Service Dindigul 💧 7737669865 💧 by Dindigul Call G...
( Jasmin ) Top VIP Escorts Service Dindigul 💧 7737669865 💧 by Dindigul Call G...
 
VIP Independent Call Girls in Taloja 🌹 9920725232 ( Call Me ) Mumbai Escorts ...
VIP Independent Call Girls in Taloja 🌹 9920725232 ( Call Me ) Mumbai Escorts ...VIP Independent Call Girls in Taloja 🌹 9920725232 ( Call Me ) Mumbai Escorts ...
VIP Independent Call Girls in Taloja 🌹 9920725232 ( Call Me ) Mumbai Escorts ...
 
Top Rated Pune Call Girls Viman Nagar ⟟ 6297143586 ⟟ Call Me For Genuine Sex...
Top Rated  Pune Call Girls Viman Nagar ⟟ 6297143586 ⟟ Call Me For Genuine Sex...Top Rated  Pune Call Girls Viman Nagar ⟟ 6297143586 ⟟ Call Me For Genuine Sex...
Top Rated Pune Call Girls Viman Nagar ⟟ 6297143586 ⟟ Call Me For Genuine Sex...
 
VIP Independent Call Girls in Andheri 🌹 9920725232 ( Call Me ) Mumbai Escorts...
VIP Independent Call Girls in Andheri 🌹 9920725232 ( Call Me ) Mumbai Escorts...VIP Independent Call Girls in Andheri 🌹 9920725232 ( Call Me ) Mumbai Escorts...
VIP Independent Call Girls in Andheri 🌹 9920725232 ( Call Me ) Mumbai Escorts...
 
WhatsApp 📞 Call : 9892124323 ✅Call Girls In Chembur ( Mumbai ) secure service
WhatsApp 📞 Call : 9892124323  ✅Call Girls In Chembur ( Mumbai ) secure serviceWhatsApp 📞 Call : 9892124323  ✅Call Girls In Chembur ( Mumbai ) secure service
WhatsApp 📞 Call : 9892124323 ✅Call Girls In Chembur ( Mumbai ) secure service
 
Stock Market Brief Deck (Under Pressure).pdf
Stock Market Brief Deck (Under Pressure).pdfStock Market Brief Deck (Under Pressure).pdf
Stock Market Brief Deck (Under Pressure).pdf
 
Webinar on E-Invoicing for Fintech Belgium
Webinar on E-Invoicing for Fintech BelgiumWebinar on E-Invoicing for Fintech Belgium
Webinar on E-Invoicing for Fintech Belgium
 
Mira Road Awesome 100% Independent Call Girls NUmber-9833754194-Dahisar Inter...
Mira Road Awesome 100% Independent Call Girls NUmber-9833754194-Dahisar Inter...Mira Road Awesome 100% Independent Call Girls NUmber-9833754194-Dahisar Inter...
Mira Road Awesome 100% Independent Call Girls NUmber-9833754194-Dahisar Inter...
 
Gurley shaw Theory of Monetary Economics.
Gurley shaw Theory of Monetary Economics.Gurley shaw Theory of Monetary Economics.
Gurley shaw Theory of Monetary Economics.
 
Solution Manual for Financial Accounting, 11th Edition by Robert Libby, Patri...
Solution Manual for Financial Accounting, 11th Edition by Robert Libby, Patri...Solution Manual for Financial Accounting, 11th Edition by Robert Libby, Patri...
Solution Manual for Financial Accounting, 11th Edition by Robert Libby, Patri...
 
Booking open Available Pune Call Girls Shivane 6297143586 Call Hot Indian Gi...
Booking open Available Pune Call Girls Shivane  6297143586 Call Hot Indian Gi...Booking open Available Pune Call Girls Shivane  6297143586 Call Hot Indian Gi...
Booking open Available Pune Call Girls Shivane 6297143586 Call Hot Indian Gi...
 
Navi Mumbai Cooperetive Housewife Call Girls-9833754194-Natural Panvel Enjoye...
Navi Mumbai Cooperetive Housewife Call Girls-9833754194-Natural Panvel Enjoye...Navi Mumbai Cooperetive Housewife Call Girls-9833754194-Natural Panvel Enjoye...
Navi Mumbai Cooperetive Housewife Call Girls-9833754194-Natural Panvel Enjoye...
 
Call Girls in New Ashok Nagar, (delhi) call me [9953056974] escort service 24X7
Call Girls in New Ashok Nagar, (delhi) call me [9953056974] escort service 24X7Call Girls in New Ashok Nagar, (delhi) call me [9953056974] escort service 24X7
Call Girls in New Ashok Nagar, (delhi) call me [9953056974] escort service 24X7
 
Business Principles, Tools, and Techniques in Participating in Various Types...
Business Principles, Tools, and Techniques  in Participating in Various Types...Business Principles, Tools, and Techniques  in Participating in Various Types...
Business Principles, Tools, and Techniques in Participating in Various Types...
 
Mira Road Memorable Call Grls Number-9833754194-Bhayandar Speciallty Call Gir...
Mira Road Memorable Call Grls Number-9833754194-Bhayandar Speciallty Call Gir...Mira Road Memorable Call Grls Number-9833754194-Bhayandar Speciallty Call Gir...
Mira Road Memorable Call Grls Number-9833754194-Bhayandar Speciallty Call Gir...
 
Call Girls Koregaon Park Call Me 7737669865 Budget Friendly No Advance Booking
Call Girls Koregaon Park Call Me 7737669865 Budget Friendly No Advance BookingCall Girls Koregaon Park Call Me 7737669865 Budget Friendly No Advance Booking
Call Girls Koregaon Park Call Me 7737669865 Budget Friendly No Advance Booking
 
Top Rated Pune Call Girls Pashan ⟟ 6297143586 ⟟ Call Me For Genuine Sex Serv...
Top Rated  Pune Call Girls Pashan ⟟ 6297143586 ⟟ Call Me For Genuine Sex Serv...Top Rated  Pune Call Girls Pashan ⟟ 6297143586 ⟟ Call Me For Genuine Sex Serv...
Top Rated Pune Call Girls Pashan ⟟ 6297143586 ⟟ Call Me For Genuine Sex Serv...
 
VIP Independent Call Girls in Bandra West 🌹 9920725232 ( Call Me ) Mumbai Esc...
VIP Independent Call Girls in Bandra West 🌹 9920725232 ( Call Me ) Mumbai Esc...VIP Independent Call Girls in Bandra West 🌹 9920725232 ( Call Me ) Mumbai Esc...
VIP Independent Call Girls in Bandra West 🌹 9920725232 ( Call Me ) Mumbai Esc...
 

Housing Affordability Index for Baltics - December 14, 2011

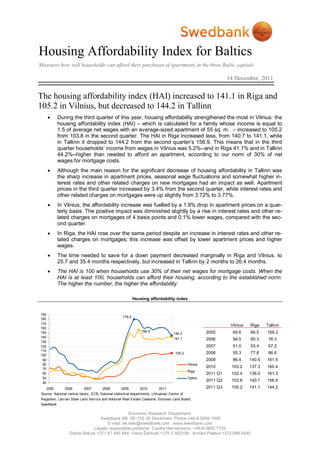
  • 1. Housing Affordability Index for Baltics Measures how well households can afford their purchases of apartments in the three Baltic capitals 14 December, 2011 The housing affordability index (HAI) increased to 141.1 in Riga and 105.2 in Vilnius, but decreased to 144.2 in Tallinn  During the third quarter of this year, housing affordability strengthened the most in Vilnius: the housing affordability index (HAI) – which is calculated for a family whose income is equal to 1.5 of average net wages with an average-sized apartment of 55 sq. m. – increased to 105.2 from 103.8 in the second quarter. The HAI in Riga increased less, from 140.7 to 141.1, while in Tallinn it dropped to 144.2 from the second quarter’s 156.9. This means that in the third quarter households’ income from wages in Vilnius was 5.2%--and in Riga 41.1% and in Tallinn 44.2%--higher than needed to afford an apartment, according to our norm of 30% of net wages for mortgage costs.  Although the main reason for the significant decrease of housing affordability in Tallinn was the sharp increase in apartment prices, seasonal wage fluctuations and somewhat higher in- terest rates and other related charges on new mortgages had an impact as well. Apartment prices in the third quarter increased by 3.4% from the second quarter, while interest rates and other related charges on mortgages were up slightly from 3.72% to 3.77%.  In Vilnius, the affordability increase was fuelled by a 1.9% drop in apartment prices on a quar- terly basis. The positive impact was diminished slightly by a rise in interest rates and other re- lated charges on mortgages of 4 basis points and 0.1% lower wages, compared with the sec- ond quarter.  In Riga, the HAI rose over the same period despite an increase in interest rates and other re- lated charges on mortgages; this increase was offset by lower apartment prices and higher wages.  The time needed to save for a down payment decreased marginally in Riga and Vilnius, to 25.7 and 35.4 months respectively, but increased in Tallinn by 2 months to 26.4 months.  The HAI is 100 when households use 30% of their net wages for mortgage costs. When the HAI is at least 100, households can afford their housing, according to the established norm. The higher the number, the higher the affordability. Housing affordability index 190 179.5 180 170 Vilnius Riga Tallinn 160 150 156.4 2005 69.6 66.5 109.3 144.2 140 141.1 2006 56.5 60.3 76.3 130 120 2007 51.0 53.4 67.2 110 105.2 2008 55.3 77.8 86.6 100 90 2009 86.4 140.5 161.5 80 Vilnius 70 2010 103.2 137.3 160.4 Riga 60 2011 Q1 102.4 136.0 161.3 50 Tallinn 2011 Q2 103.8 140.7 156.9 40 2005 2006 2007 2008 2009 2010 2011 2011 Q3 105.2 141.1 144.2 Source: National central banks, ECB, National statistical departments, Lithuanian Centre of Registers, Latv ian State Land Serv ice and National Real Estate Cadastre, Estonian Land Board, Swedbank Economic Research Department. Swedbank AB. SE-105 34 Stockholm. Phone +46-8-5859 1000 E-mail: ek.sekr@swedbank.com www.swedbank.com Legally responsible publisher: Cecilia Hermansson, +46-8-5859 7720 Dainis Stikuts +371 67 445 844; Vaiva Šečkutė +370 2 582156; Annika Paabut +372 888 5440
  • 2. Components of the HAI: apartment prices, interest rates, and wages Apartment prices In the third quarter of this year, the price of apartments increased in Tallinn by 3.4%, but decreased in Vilnius and Riga by 1.9% and 0.9%, respectively, compared with the previous quarter. Nevertheless, on an annual basis, apartment prices fell only in Riga – the price of a standard apartment was 1.6% lower in Riga, but 4.1% higher in Vilnius and 18% higher in Tallinn. In the third quarter, the average-sized apartment of 55 sq. m. apartment was the most expensive in Tallinn, where its price reached EUR 58,751 and became higher than in Vilnius for the first time in four years. A standard apartment cost EUR 57,889 in Vilnius and EUR 41,333 in Riga. The main reason for the rising prices of apartments on an annual basis is the economic recovery, which has been the strongest in Estonia, as well as the lower interest rates, which have made hous- ing more affordable and thus pushed up prices. Falling unemployment and less uncertainty about fu- ture income could also have influenced buyers’ activity, although the number of transactions remains well below the level of the boom years. In Estonia - where price growth has been substantially higher - an extra boost to rising prices, in our opinion, has come from the strongly improved confidence. This, in part, is connected to the change- over to the euro, which has eliminated currency risk in the economy, possibly made borrowers more optimistic, and made the country more attractive to foreign investors. Apartment prices, EUR/m2 70 63.5 60.3 60 50 48.2 Vilnius Riga 40 35.4 Tallinn 30 26.4 25.7 20 10 2005 2006 2007 2008 2009 2010 2011 Source: National statistical departments, Lithuanian Centre of Registers, Latv ian State Land Serv ice and National Real Estate Cadastre, Estonian Land Board, Swedbank Interest rates on mortgages Interest rates and other related charges for new mortgages (annual percentage rate of charge) in- creased in the third quarter of this year the most in Latvia (from 4.07% in the second quarter to 4.16%). In Estonia, these rates climbed by 6 basis points to 3.77% and in Lithuania by 4 points to 3.93%. This growth in the annual percentage rate of charge for mortgages is most likely related to the increase in the ECB's policy rate in mid-July (from 1.25% to 1.5%) and also to the higher risk premium due to the greater risk aversion in financial markets – as a result, the three-month euro interbank of- fered rate (EURIBOR) increased from 1.36% in the second quarter of 2011 to 1.51% in the third quar- ter. The affordability improvement in Riga was dampened because that city experienced the fastest in- crease in interest rates and other related charges. The index would have been by 3.8 points higher than in Tallinn if Latvia had enjoyed the same rates as Estonia because the difference between apartment prices and wages was more favourable in Riga than in Tallinn. 2 Housing Affordability Index for Baltics • December, 2011
  • 3. Annual percentage rate of charge for new mortgages to households 8.0% 7.8% 7.5% 7.0% 6.5% 6.5% 6.0% Lithuania 6.4% 5.5% Estonia Latv ia 5.0% 4.5% 4.16% 4.0% 3.93% 3.77% 3.5% 3.0% 2005 2006 2007 2008 2009 2010 2011 Source: National central banks, ECB Average net wages The average net wages of a households grew slightly only in Riga, by 0.5%, from the second quarter of 2011 to the third. Meanwhile, households in Tallinn faced a 4.3% decrease in their income from wages, but this was due only to seasonal factors. Vilnius households experienced a smaller decrease of 0.1%. On a yearly basis, average net household wages in Tallinn increased the most, reaching EUR 1,115, 6.9% more than in the third quarter of 2010. In Riga, these wages increased by 4.1% to EUR 804.6, and in Vilnius by 2.4% to EUR 816.7. The higher housing affordability in Tallinn compared with Vilnius is mostly determined by the differ- ence in wages. In Tallinn, households earn 36.5% more than in Vilnius, while apartment prices are nearly on the same level. Average net wage, EUR 800 750 743 EUR 700 650 600 550 544 EUR 536 EUR 500 450 400 Riga 350 Vilnius 300 Tallinn 250 200 2005 2006 2007 2008 2009 2010 2011 Source: National statistical departments The HAI value of 144.2 in Tallinn means that households’ income from wages in this city is 44.2% higher than required to afford an apartment, according to our norm (mortgage costs account for 30% of net wages of a household, which earns 1.5 of the average net wage). In Latvia, meanwhile, house- holds’ income from wages is 41.1% higher, and in Vilnius 5.2% higher than required to fulfil this norm. In the third quarter, mortgage costs amounted to 20.8% of households’ net wages in Tallinn, 21.3% in Riga, and 28.5% in Vilnius. Net income from wages of households in Vilnius needs to be at least EUR 776.7 to meet the norm of affordability (defined in paragraph above). This required income is lower in Tallinn (EUR 773.1), as slightly higher apartment prices are compensated for by a lower annual percentage rate of charge for mortgages. Meanwhile, households in Riga, which enjoy the lowest apartment prices, have to earn only EUR 570.2 to afford an apartment. However, at the moment, households in Vilnius enjoy wages that are similar to Riga’s and much lower than in Tallinn. 3 Housing Affordability Index for Baltics • December, 2011
  • 4. Compared with a year ago, the income margin when purchasing an apartment – or the HAI value – increased by 6.3 points in Riga and 0.3 point in Vilnius. This is because apartment prices increased faster in Vilnius (4.1% growth vs. 1.6% decrease) and wages increased less (2.4% vs. 4.1%) even though interest rates and other related charges for mortgages fell more in Vilnius than in Riga (16 ba- sis points vs. 9 basis points). Meanwhile, the income margin in Tallinn narrowed by 13.2 points in a year. This was caused by a rise in apartment prices so rapid (18%) that it could not be offset even by a 6.9% increase in net wages, or by a drop in interest rates of 9 basis points. This is an opposite trend from that in Riga, where average net wages increased while apartment prices shrank. Months to save for a down payment In Vilnius and Riga, the number of months needed to save for a down payment, which equals 15% of an apartment price, fell by less than a month to 35.4 and 25.7, respectively, from the second quarter to the third quarter. However, this number increased by 2 months to 26.4 in Tallinn because of a si- multaneous rise in apartment prices and fall in wages on a quarterly basis. Nevertheless, it still takes 9 months less to save for a down payment in Tallinn than in Vilnius. It is assumed that household saves 30% of its net wages every month for a down payment. Months to save for a down payment 70 63.5 60.3 60 50 48.2 Vilnius Riga 40 35.4 Tallinn 30 26.4 25.7 20 10 2005 2006 2007 2008 2009 2010 2011 Source: National statistical departments, Lithuanian Centre of Registers, Latv ian State Land Serv ice and National Real Estate Cadastre, Estonian Land Board, Swedbank Sensitivity analysis Sensitivity analysis shows that, if interest rates were to rise by 2 percentage points, the affordability margin would disappear in Vilnius and households’ income would be too low, by 16.3%, to afford an apartment. An increase in interest rates of 2 percentage points would cause the margin to decrease by 28.8 percentage points in Riga and by 29.7 percentage points in Tallinn, but the HAI would remain above 100 – at 112.6 and 114.4 in the respective capitals. The margins would disappear in all three Baltic capitals if apartment prices were to increase by 5.2% in Vilnius, 41.1% in Riga, and 44.2% in Tallinn—i.e., by the amount of the current margins. House- holds would no longer be able to afford apartments if interest rates were to increase by more than 0.42 percentage points in Vilnius, by more than 3.16 percentage points in Riga, and by more than 3.29 per- centage points in Tallinn. 4 Housing Affordability Index for Baltics • December, 2011
  • 5. Housing affordability index: method Purpose Measure changes in household buying power primarily as relates to apart- ment purchases, but can also provide indications on existing housing. Norm Household mortgage costs according to our definition should not exceed 30% of net wages of a household. Definition of housing affordability index Actual income in relation to income required to meet the “norm,” where mortgage costs account for 30% of net wages of a household. If the index = 100, households are using 30% of their net wages. If the index > 100, household buying power exceeds the norm. And if the index < 100, house- hold buying power is below the norm. Index is calculated according to the following formula: AverageINC HAI  *100 NINC where PMT NINC  . 30% HAI - housing affordability index AverageINC – 1.5 of average monthly net wages NINC - net wages that would satisfy the “norm” PMT - monthly mortgage payment Variables  Three-month average prices of apartments of average size (55 sq. m.) in capitals  Average net wages of a household, which equal 1.5 of average monthly net wages in capital cities  Three-month average interest rates and other related charges (or an- nual percentage rate of charge - a rate that comprises an interest compo- nent and a component of other charges) for new housing loans to house- holds issued in euros for Latvia and Estonia and weighted against dif- ferent currencies (the litas and the euro) in Lithuania-- produce the monthly mortgage cost, assuming a 15% down payment and 30-year term Limits The housing affordability index includes mortgage costs but excludes taxes and subsidies, including property tax and interest deductions. The index provides an indication of the situation for households composed of one or two working people, which, combined, earn one-and-a-half times the aver- age monthly wage; however, it does not reflect conditions for individual households. The index does not provide any direct guidance for business decisions, including lending and interest rate decisions. The index reflects household buying power based on apartment purchases that have been made, but says nothing about opportunities for apartment sales. The housing affordability index is of informative nature and reflects macro- economic developments rather than banks' decisions and lending policies or possible decisions made by individual households. Periodicity Quarterly Geography Vilnius, Riga, Tallinn 5 Housing Affordability Index for Baltics • December, 2011
  • 6. Appendix 1 Housing affordability Months to save for a index down payment Vilnius Riga Tallinn Vilnius Riga Tallinn 2005 Q1 72.6 64.4 113.7 46.7 50.0 32.7 2005 Q2 69.8 66.7 118.4 53.1 53.1 32.7 2005 Q3 75.2 66.4 105.2 50.9 53.5 37.4 2005 Q4 60.5 68.3 100.1 58.9 52.5 38.6 2006 Q1 58.6 60.0 84.2 62.8 57.6 44.0 2006 Q2 55.8 63.4 81.2 63.5 53.5 44.0 2006 Q3 58.6 57.9 70.4 58.3 56.3 48.2 2006 Q4 53.1 60.0 69.5 62.1 52.0 46.9 2007 Q1 54.4 53.0 65.5 59.1 57.4 47.8 2007 Q2 51.1 52.0 67.4 59.6 56.7 45.3 2007 Q3 50.0 47.5 62.6 59.1 60.3 46.9 2007 Q4 48.5 61.1 73.2 59.9 46.0 39.5 2008 Q1 54.1 70.5 80.5 55.3 40.7 37.3 2008 Q2 53.5 75.4 87.1 54.4 36.4 34.0 2008 Q3 54.4 80.0 83.3 51.7 31.9 33.5 2008 Q4 59.0 85.3 95.4 48.4 28.8 29.8 2009 Q1 68.8 116.8 129.6 44.1 25.1 25.6 2009 Q2 87.7 148.3 160.0 38.1 22.0 22.3 2009 Q3 93.9 140.7 179.5 36.3 25.1 20.6 2009 Q4 95.5 156.4 176.9 35.6 22.8 21.3 2010 Q1 100.6 138.5 160.5 35.3 26.3 23.1 2010 Q2 102.6 137.2 162.9 35.8 26.4 23.1 2010 Q3 104.9 134.8 157.3 34.9 27.2 23.9 2010 Q4 104.6 138.6 160.9 35.4 26.7 23.8 2011 Q1 102.4 136.0 161.3 36.4 26.9 23.7 2011 Q2 103.8 140.7 156.9 36.1 26.1 24.4 2011 Q3 105.2 141.1 144.2 35.4 25.7 26.4 High 105.2 156.4 179.5 63.5 60.3 48.2 Low 48.5 47.5 62.6 34.9 22.0 20.6 Average 74.0 94.9 115.1 48.4 39.5 33.2 Sources: National central banks, National statistical departments, Lithuanian Centre of Registers, Latvian State Land Service and National Real Estate Cadastre, Estonian Land Board, Swedbank 6 Housing Affordability Index for Baltics • December, 2011
  • 7. Economic Research Department Sweden Cecilia Hermansson +46 8 5859 7720 cecilia.hermansson@swedbank.se Group Chief Economist Chief Economist, Sweden Magnus Alvesson +46 8 5859 3341 magnus.alvesson@swedbank.se Senior Economist Jörgen Kennemar +46 8 5859 7730 jorgen.kennemar@swedbank.se Senior Economist Anna Ibegbulem +46 8 5859 7740 anna.ibegbulem@swedbank.se Assistant Estonia Annika Paabut +372 888 5440 annika.paabut@swedbank.ee Chief Economist Elina Allikalt +372 888 1989 elina.allikalt@swedbank.ee Senior Economist Latvia Mārtiņš Kazāks +371 67 445 859 martins.kazaks@swedbank.lv Deputy Group Chief Economist Chief Economist, Latvia Dainis Stikuts +371 67 445 844 dainis.stikuts@swedbank.lv Senior Economist Lija Strašuna +371 67 445 875 lija.strasuna@swedbank.lv Senior Economist Lithuania Nerijus Mačiulis +370 5 258 2237 nerijus.maciulis@swedbank.lt Chief Economist, Lithuania Lina Vrubliauskienė +370 5 258 2275 lina.vrubliauskiene@swedbank.lt Senior Economist Vaiva Šečkutė +370 5 258 2156 vaiva.seckute@swedbank.lt Senior Economist 7 Housing Affordability Index for Baltics • December, 2011
  • 8. Disclaimer This research report has been prepared by economists of Swedbank’s Economic Research Department. The Economic Research Depart- ment consists of research units in Estonia, Latvia, Lithuania, and Sweden, is independent of other departments of Swedbank AB (publ) (“Swedbank”) and responsible for preparing reports on global and home market economic developments. The activities of this research department differ from the activities of other departments of Swedbank, and therefore the opinions expressed in the reports are independ- ent from interests and opinions that might be expressed by other employees of Swedbank. This report is based on information available to the public, which is deemed to be reliable, and reflects the economists’ personal and professional opinions of such information. It reflects the economists’ best understanding of the information at the moment the research was prepared and due to change of circumstances such understanding might change accordingly. This report has been prepared pursuant to the best skills of the economists and with respect to their best knowledge this report is correct and accurate, however neither Swedbank nor any enterprise belonging to Swedbank or Swedbank directors, officers, or other employees or affiliates shall be liable for any loss or damage, direct or indirect, based on any flaws or faults within this report. Enterprises belonging to Swedbank might have holdings in the enterprises mentioned in this report and provide financial services (issue loans, among others) to them. Aforementioned circumstances might influence the economic activities of such companies and the prices of securities issued by them. The research presented to you is of an informative nature. This report should in no way be interpreted as a promise or confirmation of Swedbank or any of its directors, officers, or employees that the events described in the report shall take place or that the forecasts turn out to be accurate. This report is not a recommendation to invest into securities or in any other way enter into any financial transactions based on the report. Swedbank and its directors, officers, or employees shall not be liable for any loss that you may suffer as a result of relying on this report. We stress that forecasting the developments of the economic environment is somewhat speculative in nature, and the real situation might turn out different from what this report presumes. IF YOU DECIDE TO OPERATE ON THE BASIS OF THIS REPORT, THEN YOU ACT SOLELY ON YOUR OWN RISK AND ARE OBLIGED TO VERIFY AND ESTIMATE THE ECONOMIC REASONABILITY AND THE RISKS OF SUCH ACTION INDE- PENDENTLY. 8 Housing Affordability Index for Baltics • December, 2011