Energy & Commodities, No. 6 - June 8, 2012
•
1 gefällt mir•234 views

Energy & Commodities, No. 6 - June 8, 2012: Shaky economic outlook and falling commodity prices

Empfohlen
Empfohlen
Weitere ähnliche Inhalte
Was ist angesagt?
Was ist angesagt? (20)
Andere mochten auch
Andere mochten auch (9)
Ähnlich wie Energy & Commodities, No. 6 - June 8, 2012
Ähnlich wie Energy & Commodities, No. 6 - June 8, 2012 (19)
Mehr von Swedbank
Mehr von Swedbank (20)
Kürzlich hochgeladen
Kürzlich hochgeladen (20)
Energy & Commodities, No. 6 - June 8, 2012
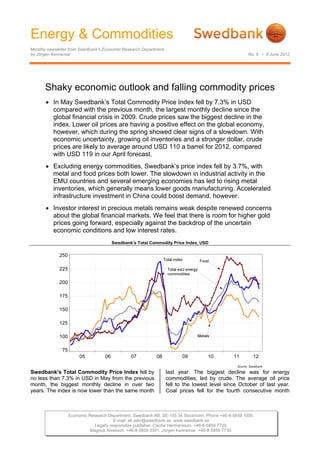
- 1. Energy & Commodities Monthly newsletter from Swedbank’s Economic Research Department by Jörgen Kennemar No. 6 • 8 June 2012 Shaky economic outlook and falling commodity prices In May Swedbank’s Total Commodity Price Index fell by 7.3% in USD compared with the previous month, the largest monthly decline since the global financial crisis in 2009. Crude prices saw the biggest decline in the index. Lower oil prices are having a positive effect on the global economy, however, which during the spring showed clear signs of a slowdown. With economic uncertainty, growing oil inventories and a stronger dollar, crude prices are likely to average around USD 110 a barrel for 2012, compared with USD 119 in our April forecast. Excluding energy commodities, Swedbank’s price index fell by 3.7%, with metal and food prices both lower. The slowdown in industrial activity in the EMU countries and several emerging economies has led to rising metal inventories, which generally means lower goods manufacturing. Accelerated infrastructure investment in China could boost demand, however. Investor interest in precious metals remains weak despite renewed concerns about the global financial markets. We feel that there is room for higher gold prices going forward, especially against the backdrop of the uncertain economic conditions and low interest rates. Swedbank’s Total Commodity Price Index, USD Swedbank’s Total Commodity Price Index fell by last year. The biggest decline was for energy no less than 7.3% in USD in May from the previous commodities, led by crude. The average oil price month, the biggest monthly decline in over two fell to the lowest level since October of last year. years. The index is now lower than the same month Coal prices fell for the fourth consecutive month Economic Research Department. Swedbank AB. SE-105 34 Stockholm. Phone +46-8-5859 1000. E-mail: ek.sekr@swedbank.se www.swedbank.se Legally responsible publisher: Cecilia Hermansson. +46-8-5859 7720. Magnus Alvesson. +46-8-5859 3341. Jörgen Kennemar. +46-8-5859 7730.
- 2. Energy & Commodities Monthly newsletter from Swedbank’s Economic Research Department, continued No. 6 • 8 June 2012 and are nearly 20% lower than a year ago. This SEK, which means that it is not just a currency suggests lower energy consumption and steel effect. production, where a large share of the coal goes to. As a whole, the index for energy commodities fell Crude prices by currency by 8.3% between April and May. This is a 29-mar 04-jun %-change significant reversal from earlier this year, when USD 129,9 98,4 -24,2 rising oil prices stoked concerns about the impact EUR 99,1 78,7 -20,6 on the global economy. The risk premium on crude SEK 884,3 706,1 -20,2 due to growing geopolitical uncertainty in the Middle East has decreased during the latest month despite The average oil price this year is slightly over USD that political negotiations on Iran's nuclear policy 117 a barrel, slightly below our spring forecast of have produced few results so far. Instead, USD 119. Because of the price slide this spring and increased uncertainty about the global recovery is the shaky global economy, however, we are what's driving oil prices lower. revising our forecast downward for this year. The biggest price decline is probably already behind us, During the last month there have been growing and it seems less likely that OPEC will allow crude signs that the international economy has slowed. prices to continue falling without taking action, This applies to the OECD countries as well as provided that the global economy doesn't several fast-growing emerging economies such as significantly worsen. An oil price of around USD 100 China and India. Crude demand is weaker and during the second half-year would mean an supplies have risen. Record-high production in average price for 2012 of USD 110 a barrel. Lower Saudi Arabia – the highest in 30 years – and projected prices later in 2012 are also affecting the growing inventories in the US are driving down oil average price forecast for 2013, which is expected prices. The spot price for Brent crude was just to be around USD 105, compared with our under USD 100 a barrel at the time of writing, a prediction this spring of USD 114. On the other level Saudi Arabia and other producers are more hand, prices could be driven higher by a more comfortable with than the higher prices earlier this expansive monetary policy through liquidity spring. Brent crude futures for delivery in December injections, geopolitical developments in the Middle 2012 indicate a continued price decline. East, a weaker dollar or economic stimulus in China, among other places. Oil prices and USD/Euro Lower metal prices and growing inventories The decline in commodity prices in May isn't so conspicuous when energy commodities are taken out. In total, Swedbank’s Commodity Price Index excluding energy commodities fell by 3.7% compared with April, the third consecutive monthly decline. Economically sensitive metal prices fell by 3.3% in USD, with nickel and copper posting the biggest drops (4.8% and 4.0%). Other industrial metals (lead, zinc and aluminum), also trended lower as the global economy slowed. Rising metal inventories indicate that global demand is sliding. In China, the world’s largest metal consumer, imports have slowed in pace with industrial activity. Only copper inventories have shrunk, reaching the lowest level in over three years in May. In spite of this, average copper prices Oil prices are dropping at the same time that the fell to just under USD 8 000. Along with nickel, dollar has strengthened in nominal trade-weighted copper has seen the most price volatility among terms, which tends to drive global commodity prices industrial metals in recent years, due to both lower, since commodities are generally priced in fundamental changes (supply and demand) and USD. But prices have also dropped in euro and capital flows. The price of zinc on the other hand has been relatively stable at around USD 2 000 a
- 3. Energy & Commodities Monthly newsletter from Swedbank’s Economic Research Department, continued No. 6 • 8 June 2012 ton in the last three years. The trend for non-ferrous nearly 18% lower than a year ago. There are metals has largely been in line with a projected variations between food commodities, however. decline of 8% this spring. The recent shaky Oilseed prices, but also grains, have held up better, economy is increasing the risk that metal prices will while beverages and sugar have dipped to their be weaker during the second half-year than we had lowest levels in nearly two years. forecast this spring, however. Price trend for metals January 2011=100 Grain prices in USD, 2005=100 450 Wheat 400 350 300 Cereal products 250 200 150 Corn 100 50 05 06 07 08 09 10 11 12 Source: Reuters EcoWin Weather-related factors have a major impact on Iron ore prices fell by 5.5% in USD in May food prices, where droughts or floods in major food compared with the previous month and are back to producing regions such as Australia, Russia, the the same levels as early 2012. Capacity cutbacks in US and the EU can quickly affect supplies. The the Chinese steel industry and lower investment major fluctuations in food prices in recent years are growth suggest falling iron ore prices in the short also proof of the huge consequences of production term from today's USD 135 a ton. Estimates of the cutbacks. The first grain forecasts from the FAO for size of the decline vary from 5-20% for 65% ore, 2012 point to a record production level of 27 million depending not least on the Chinese economy. tons, up 1% from 2011. For wheat, however, lower Accelerated infrastructure investments in China production volume is expected partly due to have raised hopes of higher metal demand and unfavorable weather conditions in the EU and rising prices. A repeat of the huge infrastructure Russia. Global grain consumption is expected to programs in 2008/09 seems unlikely, however. remain in line with supply, so inventories shouldn’t rise significantly. In the case of wheat, inventories Long-term global demand for iron ore will rise, are expected to shrink. Lower biofuel production is especially in Asia's rapidly growing economies. The included in the forecast and had previously been a biggest iron ore producers in Brazil, Australia and factor in higher food prices. Although food prices India are expanding their capacity. This is also have been weaker than expected, we feel it is too happening in Sweden, so production volume should early to revise our forecast of higher food prices for increase in the years ahead. For Sweden’s part, the 2012 when such a large share of the year’s global increase in demand for iron ore has meant production still remains. Not until late summer will substantial export growth. During the first quarter we see a clear indication of where prices are going. iron ore exports rose in nominal terms by nearly A stronger dollar is also a contributing factor why 50% at an annual rate. food prices have been lower than expected. Increased grain production 2012 Gold has lost its luster Increased food supplies, especially grain, have The drop in gold prices continued in May despite pushed prices broadly lower. In May Swedbank’s renewed concerns about the global financial food price index fell by 2.4% in USD and it is now markets. Instead, investor interest in US and 3 (5)
- 4. Energy & Commodities Monthly newsletter from Swedbank’s Economic Research Department, continued No. 6 • 8 June 2012 German government bonds has grown At the same time gold demand has declined in substantially, driving long-term rates down to China and India, which account for the majority of historic lows. physical gold demand. The dollar's appreciation is another price-inhibiting factor for gold, which could Gold prices and US government bonds come under further pressure as long as uncertainty about the EMU and euro still remains. On the other hand more expansive monetary policy would drive up the price of gold, especially if the US Federal Reserve again decides to stimulate the economy through liquidity injections should the labor market continue to weaken. The increased liquidity would give a boost to other asset classes, especially gold. That would also increase the fears of rising inflation over time, which usually strengthens investor interest in gold. Jörgen Kennemar
- 5. Energy & Commodities Monthly newsletter from Swedbank’s Economic Research Department, continued No. 6 • 8 June 2012 Swedbank Commodity Index - US$ - Swedbank Commodity Index - SKr - Basis 2000 = 1oo 14-06-12 Basis 2000 = 1oo 14-06-12 3.2012 4.2012 5.2012 3.2012 4.2012 5.2012 T otal index 397,9 384,8 356,6 T otal index 290,6 282,3 272,8 Per cent change month ago 3,2 -3,3 -7,3 Per cent change month ago 4,2 -2,9 -3,3 Per cent change year ago 8,7 -1,1 -2,8 Per cent change year ago 15,2 7,7 9,5 T otal index exclusive energy 276,5 273,0 263,0 T otal index exclusive energy 202,0 200,3 201,2 Per cent change month ago -0,1 -1,3 -3,7 Per cent change month ago 0,8 -0,8 0,5 Per cent change year ago -12,3 -17,6 -18,4 Per cent change year ago -7,1 -10,3 -8,1 Food, tropical beverages 261,5 257,7 251,6 Food, tropical beverages 191,0 189,1 192,6 Per cent change month ago -1,7 -1,4 -2,4 Per cent change month ago -0,8 -1,0 1,8 Per cent change year ago -16,3 -17,9 -18,0 Per cent change year ago -11,2 -10,6 -7,6 Cereals 280,1 272,3 264,9 Cereals 204,6 199,8 202,7 Per cent change month ago 0,9 -2,8 -2,7 Per cent change month ago 1,8 -2,4 1,5 Per cent change year ago -7,8 -16,2 -16,9 Per cent change year ago -2,3 -8,8 -6,4 T ropical beverages and tobacco 260,1 248,3 240,8 T ropical beverages and tobacco 190,0 182,2 184,3 Per cent change month ago -5,1 -4,5 -3,0 Per cent change month ago -4,3 -4,1 1,1 Per cent change year ago -22,8 -25,6 -25,4 Per cent change year ago -18,2 -19,0 -16,0 Coffee 167,6 160,4 157,2 Coffee 122,4 117,7 120,3 Per cent change month ago -8,0 -4,3 -2,0 Per cent change month ago -7,1 -3,9 2,2 Per cent change year ago -25,3 -30,4 -31,1 Per cent change year ago -20,8 -24,3 -22,3 Oilseeds and oil 252,3 268,6 266,4 Oilseeds and oil 184,3 197,1 203,9 Per cent change month ago 4,7 6,5 -0,8 Per cent change month ago 5,6 6,9 3,4 Per cent change year ago -4,5 2,1 1,0 Per cent change year ago 1,3 11,1 13,8 Industrial raw materials 280,9 277,4 266,2 Industrial raw materials 205,2 203,5 203,7 Per cent change month ago 0,3 -1,2 -4,0 Per cent change month ago 1,2 -0,8 0,1 Per cent change year ago -11,2 -17,6 -18,6 Per cent change year ago -5,9 -10,3 -8,3 Agricultural raw materials 173,7 174,6 169,6 Agricultural raw materials 126,9 128,1 129,8 Per cent change month ago 1,2 0,5 -2,9 Per cent change month ago 2,1 1,0 1,3 Per cent change year ago -14,4 -16,9 -17,1 Per cent change year ago -9,3 -9,5 -6,6 Cotton 89,8 90,4 79,3 Cotton 65,6 66,3 60,7 Per cent change month ago -2,4 0,7 -12,3 Per cent change month ago -1,5 1,2 -8,5 Per cent change year ago -55,3 -53,2 -48,0 Per cent change year ago -52,6 -49,0 -41,4 Softwood 133,4 135,6 134,0 Softwood 97,4 99,5 102,5 Per cent change month ago 1,5 1,6 -1,2 Per cent change month ago 2,4 2,1 3,1 Per cent change year ago -9,1 -10,6 -13,4 Per cent change year ago -3,7 -2,7 -2,5 W oodpulp 837,0 849,6 852,4 W oodpulp 611,4 623,3 652,3 Per cent change month ago 1,0 1,5 0,3 Per cent change month ago 1,9 2,0 4,6 Per cent change year ago -13,2 -14,4 -15,6 Per cent change year ago -8,0 -6,8 -4,9 N on-ferrous metals 249,9 239,2 231,4 N on-ferrous metals 182,5 175,5 177,1 Per cent change month ago -1,5 -4,3 -3,3 Per cent change month ago -0,6 -3,9 0,9 Per cent change year ago -15,7 -20,8 -19,5 Per cent change year ago -10,6 -13,8 -9,3 Copper 8456,6 8258,8 7927,3 Copper 6177,0 6059,4 6066,1 Per cent change month ago 0,5 -2,3 -4,0 Per cent change month ago 1,4 -1,9 0,1 Per cent change year ago -11,3 -12,9 -11,5 Per cent change year ago -5,9 -5,1 -0,3 Aluminium 2182,6 2046,7 2000,5 Aluminium 1594,2 1501,7 1530,8 Per cent change month ago -0,9 -6,2 -2,3 Per cent change month ago 0,0 -5,8 1,9 Per cent change year ago -14,5 -23,1 -22,8 Per cent change year ago -9,4 -16,3 -13,1 Lead 2061,0 2062,4 2001,7 Lead 1505,4 1513,2 1531,7 Per cent change month ago -3,0 0,1 -2,9 Per cent change month ago -2,1 0,5 1,2 Per cent change year ago -21,4 -24,4 -17,6 Per cent change year ago -16,7 -17,7 -7,2 Z inc 2034,2 1997,0 1930,8 Z inc 1485,9 1465,2 1477,5 Per cent change month ago -1,1 -1,8 -3,3 Per cent change month ago -0,2 -1,4 0,8 Per cent change year ago -13,4 -15,5 -10,9 Per cent change year ago -8,2 -8,0 0,4 Nickel 18705,6 17877,8 17017,8 N ickel 13663,2 13116,9 13022,3 Per cent change month ago -8,5 -4,4 -4,8 Per cent change month ago -7,7 -4,0 -0,7 Per cent change year ago -30,2 -32,1 -29,9 Per cent change year ago -26,0 -26,1 -21,0 Iron ore, steel scrap 642,1 647,7 611,4 Iron ore, steel scrap 469,0 475,2 467,9 Per cent change month ago 1,7 0,9 -5,6 Per cent change month ago 2,6 1,3 -1,5 Per cent change year ago -3,1 -14,5 -18,6 Per cent change year ago 2,7 -6,9 -8,3 Energy raw materials 451,7 434,3 398,1 Energy raw materials 330,0 318,7 304,6 Per cent change month ago 4,2 -3,8 -8,3 Per cent change month ago 5,1 -3,4 -4,4 Per cent change year ago 16,2 4,8 2,9 Per cent change year ago 23,2 14,1 16,0 Coking coal 406,5 393,8 369,2 Coking coal 296,9 288,9 282,5 Per cent change month ago -7,1 -3,1 -6,2 Per cent change month ago -6,3 -2,7 -2,2 Per cent change year ago -15,1 -16,5 -19,6 Per cent change year ago -10,0 -9,1 -9,4 Crude oil 453,8 436,2 399,4 Crude oil 331,5 320,0 305,6 Per cent change month ago 4,7 -3,9 -8,4 Per cent change month ago 5,7 -3,4 -4,5 Per cent change year ago 18,0 5,9 4,2 Per cent change year ago 25,1 15,3 17,3 Source : SW ED BANK and HW W A-Institute for Economic Research Hamburg Source : SW ED BAN K and H W W A-Institute for Economic R esearch H amburg Swedbank Economic Research Department Swedbank’s monthly Energy & Commodities newsletter is published as a service to our customers. We believe that we have used reliable sources and methods in the preparation SE-105 34 Stockholm, Sweden of the analyses reported in this publication. However, we cannot guarantee the accuracy or Phone +46-8-5859 7740 completeness of the report and cannot be held responsible for any error or omission in the ek.sekr@swedbank.se underlying material or its use. Readers are encouraged to base any (investment) decisions www.swedbank.se on other material as well. Neither Swedbank nor its employees may be held responsible for Legally responsible publisher losses or damages, direct or indirect, owing to any errors or omissions in Swedbank’s Cecilia Hermansson, +46-88-5859 7720 monthly Energy & Commodities newsletter. Magnus Alvesson, +46-8-5859 3341 Jörgen Kennemar, +46-8-5859 7730 5 (5)