SlideShare ist ein Scribd-Unternehmen logo
1 von 12
Executive summary Market Analysis Acquisition strategy Acquisition valuation
Supply Modification
Decision
• Relatively inelastic
demand for wine , spirit
and beers
• Market fragmentation-
Easy to develop Brand
loyalty
Strengths Weakness
ThreatsOpportunities
• Well established
multinational supply
chain
• Established brand in
wine & spirits
industry
• Experience in cross-
cultural integration
• No experience in
Beer market
• Small brewers-Producing
quality products and
capturing market share
• Large brewers-
Developing their own
Premium beers and
capturing market share
• Changing customer taste
SWOT analysis of BevCo.
Change in customer taste
Increased Market
shareAcquisition of BeerCo.
BevCo.
• BevCo. is a leading International producer and
marketer of Wine & Spirits with operations in
USA , Canada , Mexico & Italy.
• Has 100 brands in its portfolio , sales in
approximate 100 countries , about 40 facilities
and approximately 6300 employees.
Revenue & Profitability
• Recently BevCo. Has been facing declining
revenue & profitability due to shifts in
consumer tastes to other categories , such as
beer.
• Also there is a high competition in Beer
market from other brewers.
BeerCo.
• One of the way to bolster growth is to enter
the Beer market , to diversify revenue streams
and broaden its portfolio of brands.
• BeerCo. is a potential acquisition target .
BeerCo has a selling & distribution solely in the
United states.
US Beer market segmentation
Segment
Revenue in Million
USD
Average annual
growth rate %
2014 2019 (E)
Super Premium 2035.2 2162.4 6.3
Craft 3434.4 4960.8 44.4
Import 6455.4 7294.92 13.0
Premium 8115.36 7584.3 -6.5
Sub Premium 12589.62 11479.8 -8.8
Total Beer Market 32629.98 33482.22 2.6
BEER
Expected US Alcoholic Beverage market in 2019
Super
Premium
Craft
Import
Premium
Sub
Premium
Beer Market Segmentation
-20% -10% 0% 10% 20% 30% 40% 50%
Super Premium
Craft
Import
Premium
Sub Premium
Average Annual growth rate of Beer segments
59.2
60.2
63
65
66.5
68.30
54
56
58
60
62
64
66
68
70
2014 2015 2016 2017 2018 2019
BillionUSD
Year
US Alcoholic Beverage Market In $Billion
High
Growth
Executive summary Market Analysis Acquisition strategy Acquisition valuation
Supply Modification
Decision
values in Billion USD
2014 2019 (Exp) CAGR(%)
Alcohol beverage industry 59.2 68.3 2.901
Wines 9.5 11.611 4.095
Spirits 17.2 23.222 6.186
Beer 32.6 33.428 0.498
Segment-wise Growth Rate of US Beverage industry
Company Financials in 2014($)
In Billions of USD BeerCo
Revenue 1.11B
COGS 669M
SG&A 201M
EBITDA 260M
Operating Income 235M
Operating Margin % 21.17%
Industry Craft Beer operating margin 20%
Financial Information Breakdown All numbers in Millions (USD)
Financial Information
Lager Ale Stout
2013 2014 2015 2013 2014 2015 2013 2014 2015
Revenue 625 719 863 208 228 262 150 158 173
COGS 400 460 552 113 124 138 81 85 94
SG&A 125 150 195 30 30 33 23 21 23
Operating Income 100 109 116 65 75 92 46 51 57
Operating Margin% 16% 15% 13% 31% 33% 35% 31% 32% 33%
 Lager has higher Revenue Growth compared to Ale and Stout
BUT
100
300
500
700
900
1100
1300
2015 2016 2017
RevenueinMillions(USD)
Year Revenue Growth
Lager
Ale
Stout 0%
5%
10%
15%
20%
25%
30%
35%
40%
2013 2014 2015
Operatingmargin
Year
Operating margin
Lager
Ale
Stout
 Ale would prove to be profitable in the long run due to growing operating margin.
Revenue growth needs to be improved with Higher Marketing and Cross selling
Executive summary Market Analysis Acquisition strategy Acquisition valuation
Supply Modification
Decision
Executive summary Market Analysis Acquisition strategy Acquisition valuation
Supply Modification
Decision
1
2
3
4
1
2
3
4
2014
1
2
3
4
2019
Low market share
& Low growth
Low market share
& High growth
High market
share &
growth
BeerCo acquisition proposal is based on the following factors-
Growth Synergy
Customer
Taste
•To address shifting customer tastes in US market towards craft brews and imports, BevCo should look towards expanding into the Beer market.
Small
brewers
•Small brewers are focusing on quality to capture market shares, taking advantage of the fragmented markets compared to last decade
• This could be countered by increasing the marketing and cross-selling between BevCo and BeerCo customers.
Large
brewers
•Since large brewers could make premium brands and try to retain market shares, BeerCo acquisition would woo their customers using existing Craft brews and Premium Beer segment of BeerCo
Customer
Loyalty
•Since market is fragmented and a rise in income is making people conscious of Brand, acquiring BeerCo with existing supply chain and customer base and marketing it heavily would lead to better brand
consciousness.
SOURCE: BCG Matrix
Based on Comparable Transaction analysis of Beer and craft Beer based
acquisitions, we establish a price range from $1887 million to $7215 million.
Which further validates the DCF pricing
Based on Discounted Cash Flow (DCF), Acquisition price: $4223.06 Million (Excluding Synergy cost)
Discounted Cash Flow
Analysis-
The future cash flows are
discounted at the treasury bill
rates to calculate the Net
Present Value and then
discounted at the present cost of
capital.
Pros: Revenue based so gives
precise market capture potential
Cons: T-Bill rate may vary and
may lead to inconsistency.
Comparable transaction method-
Acquisitions in the similar industry are
scrutinized and based on the Acquisition
to Revenue multiple or Acquisition to
EBITDA multiple ,the target company is
valued.
Pros: Reflects on market fluctuations
Cons: Hidden costs and transaction
using shares may not always disclose
the true value of the company
Multiples method-
The profitability ratios are
used for valuation , for
example P/E ratio.
Pros: Gives adequate
information on company
financials
Cons: The hidden costs
and auditing negligence
may result in error
e.g.: Satyam case
Market valuation method-
Demand and supply
equilibrium established and
valued accordingly.
Pros: Gauges exact demand
and supply dynamics of
market.
Cons: It would not work in
certain markets like monopoly
or in case of cartel formation
Executive summary Market Analysis Acquisition strategy Acquisition valuation
Supply Modification
Decision
Company Financials in
2014($ Millions) BevCo
BeerC
o
Synery
Benefits
Revenue 3350 1110 4683
COGS 2180 669 2564.1
SG&A 652.6 201 768.24
Operating
Income 517.4 235 1350.66
Operating
Synergy Based
operating margin
Factors Affecting Price other than Synergy
Market Saturation
Low cost base due to asset depreciation
Efficient manufacturing facilities of target
company
Established Supply Chain
Demand for the product line
0
50
100
150
200
250
2013 2014 2015 2016 2017 2018 2019 2020 2021
SupplyCostin$USDinMillions
Demand of cans in millions
Production facility vs Supply Costs
Supplier cost
Supply through
Production facility
BREAK-EVEN POINT
Production Facility Feasibility Study
Assumptions:
•Every expansion is finished & facility is operational within six months.
•The deficit in facility capacity, would be met by taking supply of cans
from supplier.
•The supplier prices per unit and the variable costs per unit remain same
across the time period.
Based on the Break-even point the facility for production
should be installed right away so that it becomes
profitable by 2015
Operational Considerations before acquiring BeerCo
Executive summary Market Analysis Acquisition strategy Acquisition valuation
Supply Modification
Decision
Established Customer Base:
BeerCo is larger by revenues compared to the
recent acquisitions.
Which implies it has a prominent customer base
accounting for additional market share for BevCo
Established Supply Chain:
BeerCo has established Supply chain in US markets.
BevCo would have a choice for continuing, modifying or
creating redundancy.
Synergistic benefits: Growth Synergy means entering
into a larger market share.
Beer Segment of the market is greater than the Wine
and Spirits market with increasing popularities of Craft
brews and imports
Low Operational costs of BeerCo:
BeerCo has higher operating margins compared to
industry.
Which speaks of the efficiency in operations and supply
chain management.
Market Demand Inelasticity:
Relatively inelastic market demand means it can absorb
any sudden price offsets due to inexperience of BeerCo
operations by the BevCo management
Change management:
People need to be told about change in management
else we may face irrational layoff fears from
employees or decrease in productivity.
Cultural indifference:
The work culture differs from organization to
organization and may hamper team work and
communication flow across organization.
Return On investment:
Your profitable the growth synergy would be based on
the synergy benefits forecasted by market research and
how quickly would it start giving return on capital
invested.
Lower Overall Beer market:
Compared to wine and spirits market, beer market has a
lower CAGR which means it would depend on few Beer
segments to capitalize on the invested capital
Approval from Federal Trade Commission(FTC) &
existing stakeholders:
Rationalizing the decision to acquire should be
explained to the shareholders.
In case acquisition fails due to FTC interruptions the
reputation of the BevCo CEO would have to suffer
US Beer market segmentation
Segment
Sales
volume(Barrels in
millions)
Average price per
bottle($)
Revenue in Million USD
Average annual growth rate %
2014 2019 (E) 2014 2019 (E) 2014 2019 (E)
Super Premium 10 10 0.64 0.68 =0.64*318*10 =0.68*318*10 =((2162.4-2035.2)/2035.2)*100
Craft 9 12 1.2 1.3 =1.2*318*9 =1.3*318*12 =((4960-3434.4)/3434.4)*100
Import 29 31 0.7 0.74 =0.7*318*29 =0.74*318*31 =((7294.92-6455.4)/6455.4)*100
Premium 58 53 0.44 0.45 =0.44*318*58 =0.45*318*53 =((7584.3-8115.36)/8155.36)*100
Sub Premium 107 95 0.37 0.38 =0.37*318*107 =0.38*318*95 =((11479.8-12589.62)/12589.62)*100
Total 32629.98 33482.22 =((33482.22-32629.98)/32629.98)*100Assuming, given are the only segments in Beer market
Appendix1-US Beer Market & Craft Beer growth calculation
Where
Xt = The nth year revenues
Xt-n = The base year revenues
n = number of years
CAGR= compound annual growth rate
Assumptions: Given 2.9% as the CAGR we calculate the 2019 revenues
In $Billion 2014 2019 (E) CAGR (%)
Alcohol beverage industry 59.2 68.3 =(((68.3/59.2)^(1/5))-1)*100
Wines 9.5 =0.17*68.3 =(((11.611/9.5)^(1/5))-1)*100
Spirits 17.2 =0.34*68.3 =(((23.22/17.2)^(1/5))-1)*100
Beer 32.6 33.428 =(33.42/32.6)^(1/5)-1 *100
Appendix2-US Alcoholic beverage market revenues
𝑪𝑨𝑮𝑹 = (
𝑿𝐭
𝑿𝒕−𝒏
)
𝟏
𝒏-1
Company Financials in 2014($ Millions) BevCo BeerCo Total Synery Benefits
Revenue 3350 1110 =3350+1110 =1.05*L14
COGS 2180 669 =2180+669 =0.9*L15
SG&A 652.6 201 =652.6+201 =0.9*853.6
Operating Income 517.4 235 =4460-2849-853.6 =4683-2564.1-768.24
Operating Margin % 0.154 =235/1110 =757.4/4460 =1350/4683
Assumptions: 5% Revenue Growth
10% Total Cost Reduction
Company Financials in 2014($
Millions) Synery Benefits BevCo + BeerCo Discounted at Cost of capital Value of Synergy
Revenue 4683 4407.83 275.17
Appendix3- Calculation of Synergy Benefits
Revenue Growth calculation
2015 2016 2017
Lager 863 =1.22*863 =1.23*1052.86
Ale 262 =1.1*262 =1.05*288.2
Stout 173 =1.08*173 =1.07*186.84
Revenue in %
2013 2014 2015 2016 2017
Lager 15 20 22 23 25
Ale 10 15 10 5 5
Stout 5 10 8 7 5
Appendix4-Revenue growth calculation
Appendix5-Valuation Calculation
Revenue Growth calculation $USD Millions
2015 2016 2017
Lager 863 1052.86 1295.0178
Ale 262 288.2 302.61
Stout 173 186.84 199.9188
TOTAL 1298 1527.9 1797.5466
Discounting future revenues at T-Bill rate 2.04%
2015 2016 2017
1298 1527.9 1797.5466
NPV 4431.345899
NPV discounted at the cost of capital 4.70%
Proposed Acquisition Price 4223.072642
BeerCo acquisition price based on
Target Segment Target Transac multiple Target EBITDA multiple Revenue multiple EBITDA
Craft Beer 1.9 12.3 2109 3198
Beer 6.5 25.9 7215 6734
Beer 1.7 8.7 1887 2262
Craft Beer 1.7 10.4 1887 2704
($/unit) Figures in Millions 2014 2015 2016 2017 2018 2019 2020 2021
Supply 500 700 900 1100 1300 1500 1700 1900
Supply Production facility 500 625 750 875 1000 1125 1250 1375
Deficit in production 0 75 150 225 300 375 450 525
0.15Cost of Supply from supplier 75 105 135 165 195 225 255 285
0.05
Cost of Supply from production
facility 125 67.5 85 102.5 120 137.5 155 172.5
Fixed Cost 100 25 25 25 25 25 25 25
Appendix6-Supply Calculation

Weitere ähnliche Inhalte

Was ist angesagt?

AB-Inbev -- Problem identification and solution
AB-Inbev -- Problem identification and solutionAB-Inbev -- Problem identification and solution
AB-Inbev -- Problem identification and solutionRoss Andrew Simons
 
Us gaap v ifrs dec 2011
Us gaap v ifrs dec 2011Us gaap v ifrs dec 2011
Us gaap v ifrs dec 2011Vanessa Parks
 
Neenah IR Presentation November 2014
Neenah IR Presentation November 2014Neenah IR Presentation November 2014
Neenah IR Presentation November 2014irneenahpaperinc
 
H.J. Heinz M&A Board meeting On the Proposed Acquisition
H.J. Heinz M&A  Board meeting On the Proposed AcquisitionH.J. Heinz M&A  Board meeting On the Proposed Acquisition
H.J. Heinz M&A Board meeting On the Proposed AcquisitionDebiprasad Dash
 
Test RRG Slideshare Example
Test RRG Slideshare ExampleTest RRG Slideshare Example
Test RRG Slideshare Exampleleecbriggs
 
Business Outlook coca cola enterprises
Business Outlook coca cola enterprises Business Outlook coca cola enterprises
Business Outlook coca cola enterprises finance12
 
Case study for mountain man brewing company
Case study for mountain man brewing companyCase study for mountain man brewing company
Case study for mountain man brewing companyTanmay Bhatia
 
BA 358 Ch 16 Intl Mktg
BA 358 Ch 16 Intl MktgBA 358 Ch 16 Intl Mktg
BA 358 Ch 16 Intl Mktgmattheweric
 
Lowe's after C&C investor power point
Lowe's after C&C investor power pointLowe's after C&C investor power point
Lowe's after C&C investor power pointsseligson
 
Lowes strategy overview
Lowes strategy overviewLowes strategy overview
Lowes strategy overviewamy_ostler
 
Adv 330, coca cola powerpoint
Adv 330, coca cola powerpointAdv 330, coca cola powerpoint
Adv 330, coca cola powerpointahagers
 
CFA Institute Global Research Challenge 2014 - University of Scranton
CFA Institute Global Research Challenge 2014 - University of ScrantonCFA Institute Global Research Challenge 2014 - University of Scranton
CFA Institute Global Research Challenge 2014 - University of ScrantonJacqueline Hollawell
 
Fx Risk Exposure Of Asia Pacific Breweries
Fx Risk Exposure Of Asia Pacific BreweriesFx Risk Exposure Of Asia Pacific Breweries
Fx Risk Exposure Of Asia Pacific BreweriesMeggiePhan
 

Was ist angesagt? (17)

AB-Inbev -- Problem identification and solution
AB-Inbev -- Problem identification and solutionAB-Inbev -- Problem identification and solution
AB-Inbev -- Problem identification and solution
 
Research report
Research reportResearch report
Research report
 
Us gaap v ifrs dec 2011
Us gaap v ifrs dec 2011Us gaap v ifrs dec 2011
Us gaap v ifrs dec 2011
 
Final_Case_Study
Final_Case_StudyFinal_Case_Study
Final_Case_Study
 
Neenah IR Presentation November 2014
Neenah IR Presentation November 2014Neenah IR Presentation November 2014
Neenah IR Presentation November 2014
 
H.J. Heinz M&A Board meeting On the Proposed Acquisition
H.J. Heinz M&A  Board meeting On the Proposed AcquisitionH.J. Heinz M&A  Board meeting On the Proposed Acquisition
H.J. Heinz M&A Board meeting On the Proposed Acquisition
 
Test RRG Slideshare Example
Test RRG Slideshare ExampleTest RRG Slideshare Example
Test RRG Slideshare Example
 
Business Outlook coca cola enterprises
Business Outlook coca cola enterprises Business Outlook coca cola enterprises
Business Outlook coca cola enterprises
 
P&G Case Analysis
P&G Case AnalysisP&G Case Analysis
P&G Case Analysis
 
Case study for mountain man brewing company
Case study for mountain man brewing companyCase study for mountain man brewing company
Case study for mountain man brewing company
 
BA 358 Ch 16 Intl Mktg
BA 358 Ch 16 Intl MktgBA 358 Ch 16 Intl Mktg
BA 358 Ch 16 Intl Mktg
 
Lowe's after C&C investor power point
Lowe's after C&C investor power pointLowe's after C&C investor power point
Lowe's after C&C investor power point
 
Lowes strategy overview
Lowes strategy overviewLowes strategy overview
Lowes strategy overview
 
Adv 330, coca cola powerpoint
Adv 330, coca cola powerpointAdv 330, coca cola powerpoint
Adv 330, coca cola powerpoint
 
20130425 do s 2
20130425 do s 220130425 do s 2
20130425 do s 2
 
CFA Institute Global Research Challenge 2014 - University of Scranton
CFA Institute Global Research Challenge 2014 - University of ScrantonCFA Institute Global Research Challenge 2014 - University of Scranton
CFA Institute Global Research Challenge 2014 - University of Scranton
 
Fx Risk Exposure Of Asia Pacific Breweries
Fx Risk Exposure Of Asia Pacific BreweriesFx Risk Exposure Of Asia Pacific Breweries
Fx Risk Exposure Of Asia Pacific Breweries
 

Andere mochten auch

Arabic alphabatical list
Arabic alphabatical listArabic alphabatical list
Arabic alphabatical listKhalid Hadari
 
Calculo de integrais_indefinidos_com_aplicacao_das_proprie
Calculo de integrais_indefinidos_com_aplicacao_das_proprieCalculo de integrais_indefinidos_com_aplicacao_das_proprie
Calculo de integrais_indefinidos_com_aplicacao_das_proprieRigo Rodrigues
 
1099 fire ppt
1099 fire ppt1099 fire ppt
1099 fire ppt1099fires
 
Sfida #2: Rete e Lavoro
Sfida #2: Rete e LavoroSfida #2: Rete e Lavoro
Sfida #2: Rete e LavoroMatteo Troìa
 
4.teoridasarlistrik01
4.teoridasarlistrik014.teoridasarlistrik01
4.teoridasarlistrik01Rianda Ecoel
 
Importance Of Email Encryption In Organizations
Importance Of Email Encryption In Organizations  Importance Of Email Encryption In Organizations
Importance Of Email Encryption In Organizations ZixMailEncryption.com
 
Виртуализация как инструмент разработчика
Виртуализация как инструмент разработчикаВиртуализация как инструмент разработчика
Виртуализация как инструмент разработчикаOpen-IT
 

Andere mochten auch (11)

minions_maggi
minions_maggiminions_maggi
minions_maggi
 
Summerschool Heelkunde UGent 2013
Summerschool Heelkunde UGent 2013Summerschool Heelkunde UGent 2013
Summerschool Heelkunde UGent 2013
 
Arabic alphabatical list
Arabic alphabatical listArabic alphabatical list
Arabic alphabatical list
 
Calculo de integrais_indefinidos_com_aplicacao_das_proprie
Calculo de integrais_indefinidos_com_aplicacao_das_proprieCalculo de integrais_indefinidos_com_aplicacao_das_proprie
Calculo de integrais_indefinidos_com_aplicacao_das_proprie
 
1099 fire ppt
1099 fire ppt1099 fire ppt
1099 fire ppt
 
Sfida #2: Rete e Lavoro
Sfida #2: Rete e LavoroSfida #2: Rete e Lavoro
Sfida #2: Rete e Lavoro
 
bucaramanga
bucaramanga bucaramanga
bucaramanga
 
4.teoridasarlistrik01
4.teoridasarlistrik014.teoridasarlistrik01
4.teoridasarlistrik01
 
Mpdf (14)
Mpdf (14)Mpdf (14)
Mpdf (14)
 
Importance Of Email Encryption In Organizations
Importance Of Email Encryption In Organizations  Importance Of Email Encryption In Organizations
Importance Of Email Encryption In Organizations
 
Виртуализация как инструмент разработчика
Виртуализация как инструмент разработчикаВиртуализация как инструмент разработчика
Виртуализация как инструмент разработчика
 

Ähnlich wie West Region_Case 1

Craft Beer Industry
Craft Beer IndustryCraft Beer Industry
Craft Beer IndustryAditya Khare
 
Motilal Oswal reiterate bullish long term view on United Spirits
Motilal Oswal reiterate bullish long term view on United SpiritsMotilal Oswal reiterate bullish long term view on United Spirits
Motilal Oswal reiterate bullish long term view on United SpiritsIndiaNotes.com
 
Coca-Cola’s Marketing Challenges in Brazil: The Tubainas War
Coca-Cola’s Marketing Challenges in Brazil: The Tubainas WarCoca-Cola’s Marketing Challenges in Brazil: The Tubainas War
Coca-Cola’s Marketing Challenges in Brazil: The Tubainas WarTARIQ KHAN
 
Asia Investment & Banking Conference 2019 – HSBC M&A Competition Champions (A...
Asia Investment & Banking Conference 2019 – HSBC M&A Competition Champions (A...Asia Investment & Banking Conference 2019 – HSBC M&A Competition Champions (A...
Asia Investment & Banking Conference 2019 – HSBC M&A Competition Champions (A...Amir Hisham
 
Thunderbird Consulting - First Year Solution to CBS Global Case Competition
Thunderbird Consulting - First Year Solution to CBS Global Case CompetitionThunderbird Consulting - First Year Solution to CBS Global Case Competition
Thunderbird Consulting - First Year Solution to CBS Global Case CompetitionSimon Roberts
 
Boston Beer Company PPT
Boston Beer Company PPTBoston Beer Company PPT
Boston Beer Company PPTafulham
 
Samuel Adams %281%29
Samuel Adams %281%29Samuel Adams %281%29
Samuel Adams %281%29ss7424
 
The Mountain Man Brewing Company : A Case Study
The Mountain Man Brewing Company : A Case StudyThe Mountain Man Brewing Company : A Case Study
The Mountain Man Brewing Company : A Case StudySara Jacob
 
May 2 2018 q earnings 05012018 compressed v2
May 2 2018   q earnings 05012018 compressed v2May 2 2018   q earnings 05012018 compressed v2
May 2 2018 q earnings 05012018 compressed v2molsoncoorsir
 
Ab-InBev: Internationalisation Startegy
Ab-InBev: Internationalisation StartegyAb-InBev: Internationalisation Startegy
Ab-InBev: Internationalisation StartegyRaoul Gauthier
 
Report to Shareholders
Report to ShareholdersReport to Shareholders
Report to Shareholderskliszewski11
 
Investment Banking Group Assignment
Investment Banking Group AssignmentInvestment Banking Group Assignment
Investment Banking Group AssignmentGerrard Liu
 
Abdelgawad capstone powerpoint
Abdelgawad capstone powerpointAbdelgawad capstone powerpoint
Abdelgawad capstone powerpointOmarAbdelgawad4
 
Under Armour_Security Analysis
Under Armour_Security AnalysisUnder Armour_Security Analysis
Under Armour_Security AnalysisTrang Nguyen
 
Team Medallion, Optimity'21, 2nd Round
Team Medallion, Optimity'21, 2nd RoundTeam Medallion, Optimity'21, 2nd Round
Team Medallion, Optimity'21, 2nd RoundAfnan Faruk
 
Clx investor presentation
Clx investor presentationClx investor presentation
Clx investor presentationcloroxir2016
 
MFIN 823 - Starbucks Presentation
MFIN 823 - Starbucks PresentationMFIN 823 - Starbucks Presentation
MFIN 823 - Starbucks PresentationSimon Wang
 

Ähnlich wie West Region_Case 1 (20)

Craft Beer Industry
Craft Beer IndustryCraft Beer Industry
Craft Beer Industry
 
Deloitte Maverick 2015: Qualifier West Zone
Deloitte Maverick 2015: Qualifier West Zone Deloitte Maverick 2015: Qualifier West Zone
Deloitte Maverick 2015: Qualifier West Zone
 
Motilal Oswal reiterate bullish long term view on United Spirits
Motilal Oswal reiterate bullish long term view on United SpiritsMotilal Oswal reiterate bullish long term view on United Spirits
Motilal Oswal reiterate bullish long term view on United Spirits
 
Coca-Cola’s Marketing Challenges in Brazil: The Tubainas War
Coca-Cola’s Marketing Challenges in Brazil: The Tubainas WarCoca-Cola’s Marketing Challenges in Brazil: The Tubainas War
Coca-Cola’s Marketing Challenges in Brazil: The Tubainas War
 
Asia Investment & Banking Conference 2019 – HSBC M&A Competition Champions (A...
Asia Investment & Banking Conference 2019 – HSBC M&A Competition Champions (A...Asia Investment & Banking Conference 2019 – HSBC M&A Competition Champions (A...
Asia Investment & Banking Conference 2019 – HSBC M&A Competition Champions (A...
 
Thunderbird Consulting - First Year Solution to CBS Global Case Competition
Thunderbird Consulting - First Year Solution to CBS Global Case CompetitionThunderbird Consulting - First Year Solution to CBS Global Case Competition
Thunderbird Consulting - First Year Solution to CBS Global Case Competition
 
Boston Beer Company PPT
Boston Beer Company PPTBoston Beer Company PPT
Boston Beer Company PPT
 
Samuel Adams %281%29
Samuel Adams %281%29Samuel Adams %281%29
Samuel Adams %281%29
 
Smucker Project
Smucker ProjectSmucker Project
Smucker Project
 
The Mountain Man Brewing Company : A Case Study
The Mountain Man Brewing Company : A Case StudyThe Mountain Man Brewing Company : A Case Study
The Mountain Man Brewing Company : A Case Study
 
May 2 2018 q earnings 05012018 compressed v2
May 2 2018   q earnings 05012018 compressed v2May 2 2018   q earnings 05012018 compressed v2
May 2 2018 q earnings 05012018 compressed v2
 
Ab-InBev: Internationalisation Startegy
Ab-InBev: Internationalisation StartegyAb-InBev: Internationalisation Startegy
Ab-InBev: Internationalisation Startegy
 
Report to Shareholders
Report to ShareholdersReport to Shareholders
Report to Shareholders
 
Investment Banking Group Assignment
Investment Banking Group AssignmentInvestment Banking Group Assignment
Investment Banking Group Assignment
 
Abdelgawad capstone powerpoint
Abdelgawad capstone powerpointAbdelgawad capstone powerpoint
Abdelgawad capstone powerpoint
 
Under Armour_Security Analysis
Under Armour_Security AnalysisUnder Armour_Security Analysis
Under Armour_Security Analysis
 
Team Medallion, Optimity'21, 2nd Round
Team Medallion, Optimity'21, 2nd RoundTeam Medallion, Optimity'21, 2nd Round
Team Medallion, Optimity'21, 2nd Round
 
Canned Wine.pptx
Canned Wine.pptxCanned Wine.pptx
Canned Wine.pptx
 
Clx investor presentation
Clx investor presentationClx investor presentation
Clx investor presentation
 
MFIN 823 - Starbucks Presentation
MFIN 823 - Starbucks PresentationMFIN 823 - Starbucks Presentation
MFIN 823 - Starbucks Presentation
 

West Region_Case 1

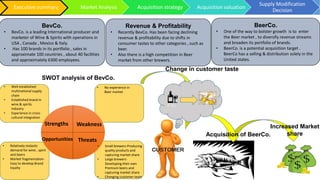
  • 1. Executive summary Market Analysis Acquisition strategy Acquisition valuation Supply Modification Decision • Relatively inelastic demand for wine , spirit and beers • Market fragmentation- Easy to develop Brand loyalty Strengths Weakness ThreatsOpportunities • Well established multinational supply chain • Established brand in wine & spirits industry • Experience in cross- cultural integration • No experience in Beer market • Small brewers-Producing quality products and capturing market share • Large brewers- Developing their own Premium beers and capturing market share • Changing customer taste SWOT analysis of BevCo. Change in customer taste Increased Market shareAcquisition of BeerCo. BevCo. • BevCo. is a leading International producer and marketer of Wine & Spirits with operations in USA , Canada , Mexico & Italy. • Has 100 brands in its portfolio , sales in approximate 100 countries , about 40 facilities and approximately 6300 employees. Revenue & Profitability • Recently BevCo. Has been facing declining revenue & profitability due to shifts in consumer tastes to other categories , such as beer. • Also there is a high competition in Beer market from other brewers. BeerCo. • One of the way to bolster growth is to enter the Beer market , to diversify revenue streams and broaden its portfolio of brands. • BeerCo. is a potential acquisition target . BeerCo has a selling & distribution solely in the United states.
  • 2. US Beer market segmentation Segment Revenue in Million USD Average annual growth rate % 2014 2019 (E) Super Premium 2035.2 2162.4 6.3 Craft 3434.4 4960.8 44.4 Import 6455.4 7294.92 13.0 Premium 8115.36 7584.3 -6.5 Sub Premium 12589.62 11479.8 -8.8 Total Beer Market 32629.98 33482.22 2.6 BEER Expected US Alcoholic Beverage market in 2019 Super Premium Craft Import Premium Sub Premium Beer Market Segmentation -20% -10% 0% 10% 20% 30% 40% 50% Super Premium Craft Import Premium Sub Premium Average Annual growth rate of Beer segments 59.2 60.2 63 65 66.5 68.30 54 56 58 60 62 64 66 68 70 2014 2015 2016 2017 2018 2019 BillionUSD Year US Alcoholic Beverage Market In $Billion High Growth Executive summary Market Analysis Acquisition strategy Acquisition valuation Supply Modification Decision values in Billion USD 2014 2019 (Exp) CAGR(%) Alcohol beverage industry 59.2 68.3 2.901 Wines 9.5 11.611 4.095 Spirits 17.2 23.222 6.186 Beer 32.6 33.428 0.498 Segment-wise Growth Rate of US Beverage industry
  • 3. Company Financials in 2014($) In Billions of USD BeerCo Revenue 1.11B COGS 669M SG&A 201M EBITDA 260M Operating Income 235M Operating Margin % 21.17% Industry Craft Beer operating margin 20% Financial Information Breakdown All numbers in Millions (USD) Financial Information Lager Ale Stout 2013 2014 2015 2013 2014 2015 2013 2014 2015 Revenue 625 719 863 208 228 262 150 158 173 COGS 400 460 552 113 124 138 81 85 94 SG&A 125 150 195 30 30 33 23 21 23 Operating Income 100 109 116 65 75 92 46 51 57 Operating Margin% 16% 15% 13% 31% 33% 35% 31% 32% 33%  Lager has higher Revenue Growth compared to Ale and Stout BUT 100 300 500 700 900 1100 1300 2015 2016 2017 RevenueinMillions(USD) Year Revenue Growth Lager Ale Stout 0% 5% 10% 15% 20% 25% 30% 35% 40% 2013 2014 2015 Operatingmargin Year Operating margin Lager Ale Stout  Ale would prove to be profitable in the long run due to growing operating margin. Revenue growth needs to be improved with Higher Marketing and Cross selling Executive summary Market Analysis Acquisition strategy Acquisition valuation Supply Modification Decision
  • 4. Executive summary Market Analysis Acquisition strategy Acquisition valuation Supply Modification Decision 1 2 3 4 1 2 3 4 2014 1 2 3 4 2019 Low market share & Low growth Low market share & High growth High market share & growth BeerCo acquisition proposal is based on the following factors- Growth Synergy Customer Taste •To address shifting customer tastes in US market towards craft brews and imports, BevCo should look towards expanding into the Beer market. Small brewers •Small brewers are focusing on quality to capture market shares, taking advantage of the fragmented markets compared to last decade • This could be countered by increasing the marketing and cross-selling between BevCo and BeerCo customers. Large brewers •Since large brewers could make premium brands and try to retain market shares, BeerCo acquisition would woo their customers using existing Craft brews and Premium Beer segment of BeerCo Customer Loyalty •Since market is fragmented and a rise in income is making people conscious of Brand, acquiring BeerCo with existing supply chain and customer base and marketing it heavily would lead to better brand consciousness. SOURCE: BCG Matrix
  • 5. Based on Comparable Transaction analysis of Beer and craft Beer based acquisitions, we establish a price range from $1887 million to $7215 million. Which further validates the DCF pricing Based on Discounted Cash Flow (DCF), Acquisition price: $4223.06 Million (Excluding Synergy cost) Discounted Cash Flow Analysis- The future cash flows are discounted at the treasury bill rates to calculate the Net Present Value and then discounted at the present cost of capital. Pros: Revenue based so gives precise market capture potential Cons: T-Bill rate may vary and may lead to inconsistency. Comparable transaction method- Acquisitions in the similar industry are scrutinized and based on the Acquisition to Revenue multiple or Acquisition to EBITDA multiple ,the target company is valued. Pros: Reflects on market fluctuations Cons: Hidden costs and transaction using shares may not always disclose the true value of the company Multiples method- The profitability ratios are used for valuation , for example P/E ratio. Pros: Gives adequate information on company financials Cons: The hidden costs and auditing negligence may result in error e.g.: Satyam case Market valuation method- Demand and supply equilibrium established and valued accordingly. Pros: Gauges exact demand and supply dynamics of market. Cons: It would not work in certain markets like monopoly or in case of cartel formation Executive summary Market Analysis Acquisition strategy Acquisition valuation Supply Modification Decision Company Financials in 2014($ Millions) BevCo BeerC o Synery Benefits Revenue 3350 1110 4683 COGS 2180 669 2564.1 SG&A 652.6 201 768.24 Operating Income 517.4 235 1350.66 Operating Synergy Based operating margin Factors Affecting Price other than Synergy Market Saturation Low cost base due to asset depreciation Efficient manufacturing facilities of target company Established Supply Chain Demand for the product line
  • 6. 0 50 100 150 200 250 2013 2014 2015 2016 2017 2018 2019 2020 2021 SupplyCostin$USDinMillions Demand of cans in millions Production facility vs Supply Costs Supplier cost Supply through Production facility BREAK-EVEN POINT Production Facility Feasibility Study Assumptions: •Every expansion is finished & facility is operational within six months. •The deficit in facility capacity, would be met by taking supply of cans from supplier. •The supplier prices per unit and the variable costs per unit remain same across the time period. Based on the Break-even point the facility for production should be installed right away so that it becomes profitable by 2015 Operational Considerations before acquiring BeerCo Executive summary Market Analysis Acquisition strategy Acquisition valuation Supply Modification Decision Established Customer Base: BeerCo is larger by revenues compared to the recent acquisitions. Which implies it has a prominent customer base accounting for additional market share for BevCo Established Supply Chain: BeerCo has established Supply chain in US markets. BevCo would have a choice for continuing, modifying or creating redundancy. Synergistic benefits: Growth Synergy means entering into a larger market share. Beer Segment of the market is greater than the Wine and Spirits market with increasing popularities of Craft brews and imports Low Operational costs of BeerCo: BeerCo has higher operating margins compared to industry. Which speaks of the efficiency in operations and supply chain management. Market Demand Inelasticity: Relatively inelastic market demand means it can absorb any sudden price offsets due to inexperience of BeerCo operations by the BevCo management Change management: People need to be told about change in management else we may face irrational layoff fears from employees or decrease in productivity. Cultural indifference: The work culture differs from organization to organization and may hamper team work and communication flow across organization. Return On investment: Your profitable the growth synergy would be based on the synergy benefits forecasted by market research and how quickly would it start giving return on capital invested. Lower Overall Beer market: Compared to wine and spirits market, beer market has a lower CAGR which means it would depend on few Beer segments to capitalize on the invested capital Approval from Federal Trade Commission(FTC) & existing stakeholders: Rationalizing the decision to acquire should be explained to the shareholders. In case acquisition fails due to FTC interruptions the reputation of the BevCo CEO would have to suffer
  • 7. US Beer market segmentation Segment Sales volume(Barrels in millions) Average price per bottle($) Revenue in Million USD Average annual growth rate % 2014 2019 (E) 2014 2019 (E) 2014 2019 (E) Super Premium 10 10 0.64 0.68 =0.64*318*10 =0.68*318*10 =((2162.4-2035.2)/2035.2)*100 Craft 9 12 1.2 1.3 =1.2*318*9 =1.3*318*12 =((4960-3434.4)/3434.4)*100 Import 29 31 0.7 0.74 =0.7*318*29 =0.74*318*31 =((7294.92-6455.4)/6455.4)*100 Premium 58 53 0.44 0.45 =0.44*318*58 =0.45*318*53 =((7584.3-8115.36)/8155.36)*100 Sub Premium 107 95 0.37 0.38 =0.37*318*107 =0.38*318*95 =((11479.8-12589.62)/12589.62)*100 Total 32629.98 33482.22 =((33482.22-32629.98)/32629.98)*100Assuming, given are the only segments in Beer market Appendix1-US Beer Market & Craft Beer growth calculation
  • 8. Where Xt = The nth year revenues Xt-n = The base year revenues n = number of years CAGR= compound annual growth rate Assumptions: Given 2.9% as the CAGR we calculate the 2019 revenues In $Billion 2014 2019 (E) CAGR (%) Alcohol beverage industry 59.2 68.3 =(((68.3/59.2)^(1/5))-1)*100 Wines 9.5 =0.17*68.3 =(((11.611/9.5)^(1/5))-1)*100 Spirits 17.2 =0.34*68.3 =(((23.22/17.2)^(1/5))-1)*100 Beer 32.6 33.428 =(33.42/32.6)^(1/5)-1 *100 Appendix2-US Alcoholic beverage market revenues 𝑪𝑨𝑮𝑹 = ( 𝑿𝐭 𝑿𝒕−𝒏 ) 𝟏 𝒏-1
  • 9. Company Financials in 2014($ Millions) BevCo BeerCo Total Synery Benefits Revenue 3350 1110 =3350+1110 =1.05*L14 COGS 2180 669 =2180+669 =0.9*L15 SG&A 652.6 201 =652.6+201 =0.9*853.6 Operating Income 517.4 235 =4460-2849-853.6 =4683-2564.1-768.24 Operating Margin % 0.154 =235/1110 =757.4/4460 =1350/4683 Assumptions: 5% Revenue Growth 10% Total Cost Reduction Company Financials in 2014($ Millions) Synery Benefits BevCo + BeerCo Discounted at Cost of capital Value of Synergy Revenue 4683 4407.83 275.17 Appendix3- Calculation of Synergy Benefits
  • 10. Revenue Growth calculation 2015 2016 2017 Lager 863 =1.22*863 =1.23*1052.86 Ale 262 =1.1*262 =1.05*288.2 Stout 173 =1.08*173 =1.07*186.84 Revenue in % 2013 2014 2015 2016 2017 Lager 15 20 22 23 25 Ale 10 15 10 5 5 Stout 5 10 8 7 5 Appendix4-Revenue growth calculation
  • 11. Appendix5-Valuation Calculation Revenue Growth calculation $USD Millions 2015 2016 2017 Lager 863 1052.86 1295.0178 Ale 262 288.2 302.61 Stout 173 186.84 199.9188 TOTAL 1298 1527.9 1797.5466 Discounting future revenues at T-Bill rate 2.04% 2015 2016 2017 1298 1527.9 1797.5466 NPV 4431.345899 NPV discounted at the cost of capital 4.70% Proposed Acquisition Price 4223.072642 BeerCo acquisition price based on Target Segment Target Transac multiple Target EBITDA multiple Revenue multiple EBITDA Craft Beer 1.9 12.3 2109 3198 Beer 6.5 25.9 7215 6734 Beer 1.7 8.7 1887 2262 Craft Beer 1.7 10.4 1887 2704
  • 12. ($/unit) Figures in Millions 2014 2015 2016 2017 2018 2019 2020 2021 Supply 500 700 900 1100 1300 1500 1700 1900 Supply Production facility 500 625 750 875 1000 1125 1250 1375 Deficit in production 0 75 150 225 300 375 450 525 0.15Cost of Supply from supplier 75 105 135 165 195 225 255 285 0.05 Cost of Supply from production facility 125 67.5 85 102.5 120 137.5 155 172.5 Fixed Cost 100 25 25 25 25 25 25 25 Appendix6-Supply Calculation