2012 State of the Vending Industry Report - Automatic Merchandiser - June / July 2012
•
3 gefällt mir•1,549 views

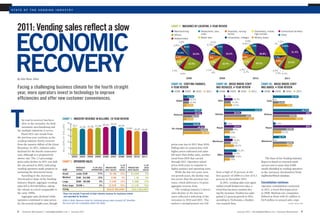
The road to recovery has been slow in the recession, for both automatic merchandising and the multiple industries it serves. Fiscal 2011 saw trends from the previous year continue, as the vending industry slowly recovers from the massive fallout of the Great Recession. In 2011, industry sales declined for the fourth consecutive year, although at a progressively slower rate. The 1.5 percentage point sales decline in 2011 was half the rate posted in 2010, indicating vending operators made progress in stemming the downward trend.

Empfohlen
Empfohlen
Weitere ähnliche Inhalte
Was ist angesagt?
Was ist angesagt? (20)
Andere mochten auch
Andere mochten auch (12)
Ähnlich wie 2012 State of the Vending Industry Report - Automatic Merchandiser - June / July 2012
Ähnlich wie 2012 State of the Vending Industry Report - Automatic Merchandiser - June / July 2012 (20)
Mehr von Steven Duque
Mehr von Steven Duque (20)
Kürzlich hochgeladen
Kürzlich hochgeladen (20)
2012 State of the Vending Industry Report - Automatic Merchandiser - June / July 2012
- 1. state of the vending industry state of the vending industry 2011: Vending sales reflect a slow Chart 3: Machines by location, 4-year review economic ● Manufacturing ● Restaurants, bars, ● Hospitals, nursing ● Elementary, middle, ● Correctional facilities ● Offices clubs homes high schools ● Other ● Hotels/motels ● Retail sites ● Universities, colleges ● Military bases 1.5% 2.2% 0.9% 1.1% 0.7% 0.4% 1% 2.0% 7.0% 8.55% 8.0% 8.3% 6.8% recovery 5% 11.5% 5.9% 31.3% 33.5% 5.8% 33.2% 26.8% 13.7% 6.5% 9% 8.8% 5.3% 8.5% 7.3% 9.1% 8.8% 28.5% 22.2% 22.5% 22.4% 1.5% 1.1% 1.3% 2.5% 5% 4.7% 1.4% 4.1% 4.5% By Elliot Maras, Editor 2008 2009 2010 2011 Chart 4A: STAFFING CHANGES, Chart 4B: AREAS WHERE STAFF Chart 4C: AREAS WHERE STAFF Facing a challenging business climate for the fourth straight 4-YEAR REVIEW WAS REDUCED, 4-YEAR REVIEW WAS ADDED, 4-YEAR REVIEW year, more operators invest in technology to improve ● 2008 ● 2009 ● 2010 ● 2011 ● 2008 ● 2009 ● 2010 ● 2011 ● 2008 ● 2009 ● 2010 ● 2011 efficiencies and offer new customer conveniences. Added 23.5% 12.7% Sales 1.9% 14.3% Sales 0% 33.3% 12.4% 11.3% 15.4% T 21.8% 13.3% 25% 39.7% 63.5% 46.7% 40.9% 28.6% 50% Reduced Delivery Delivery 34.1% 45% 30.8% he road to recovery has been Chart 1: industry revenue in billions, 10-year review 21.8% 50% 38.9% slow in the recession, for both 25 3.9% 3.3% 22.54 23.21 22.05 36.8% BILLIONS OF DOLLARS 22.1 automatic merchandising and 21.05 21.26 21.89 46.5% Repair 28.6% Repair 50% 20 19.85 19.25 No change 15% 26.9% the multiple industries it serves. 18.96 53.5% 56.3% 10% 11.1% Fiscal 2011 saw trends from 15 the previous year continue, as the 9.6% 16.7% vending industry slowly recovers 10 Warehouse 14.3% Warehouse 0% 11.3% 26.9% from the massive fallout of the Great prices rose less in 2011 than 2010. 16.7% 25% Recession. In 2011, industry sales 5 Falling sales in conjunction with declined for the fourth consecutive higher prices indicated unit sales 21.2% 0 14.3% year, although at a progressively fell more than dollar sales, another Office 2002 2003 2004 2005 2006 2007 2008 2009 2010 2011 17.5% slower rate. The 1.5 percentage trend from 2010 that carried 10% The State of the Vending Industry point sales decline in 2011 was half Chart 2: Operator sales through 2011. Operators raised Report is based on returned email the rate posted in 2010, indicating % of % of prices both years in response to surveys sent to more than 9,000 Revenue % of 2011 Projected 2011 Projected 2010 vending operators made progress in Size range operators 2011 sales sales 2010 sales sales higher product and operating costs. emails identified as vending operators stemming the downward trend. While the last two years were from a high of 10 percent in the in the Automatic Merchandiser/Vend- Small under $1M 77% $1.8B 10% $1.65B 9% According to the Automatic not growth years, the decline was first quarter of 2009 to a low of 8.5 ingMarketWatch database. Medium $1M - $4.9M 15% 0.9B 5% 1.1B 6% Merchandiser State of the Vending less severe than the previous two percent in December 2011. Industry Report, aggregate vending Large $5M - $9.9M 5% 2.34B 13% 2.38B 13% years, which delivered a 15-point In 2011, vending sales once again Consolidation continues sales fell to $18.96 billion, taking Extra large $10M + 3% 12.97B 72% 13.17B 72% aggregate revenue drop. trailed overall foodservice sales, a Operator consolidation continued the volume to a level comparable to Total $18.01 BILLION* $18.3 BILLION* The vending industry’s slower trend that has been constant dur- in 2011, a trend that began prior the early 1990s. *Does not include 5 percent of total industry revenue for machines owned sales decline in the last two ing the recession. Foodservice sales to 2008. Medium size companies, Aggregate sales declined while and operated by locations. years reflected a softening of the posted 2.5 percent growth in 2011, defined as those with $1 million to operators continued to raise prices Editor’s Note: Revenue totals for individual groups were rounded off, therefore recession in 2010 and 2011. The according to Technomic, a foodser- $4.9 million in annual sales, expe- for the second straight year, though the sums will not completely reflect the totals. nation’s unemployment rate fell vice research firm. Continued ▶ 8 Automatic Merchandiser VendingMarketWatch.com June/July 2012 June/July 2012 VendingMarketWatch.com Automatic Merchandiser 9
- 2. 2009 2009 state of the vending industry No Yes 1.5% 10.5% state of the vending industry 3.0% 1.5% 35.8% 48.6% 51.4% 10.5% Chart 5: ACQUIRED OR DIVESTED Chart 6: STRATEGIES FOR HANDLING 2008. Like workers in other loca- Chart 8A: ADJUSTED PRODUCT Chart 8B: 14.3%THOSE WHO 14.9% FOR sales and profitability. However, BUSINESS, 3-YEAR REVIEW HIGHER COSTS, 3-YEAR REVIEW tions, manufacturing employees were MIX TO REDUCE DELIVERIES, REDUCED PRODUCT VARIETY, because the technologies require a ● 2009 ● 2010 ● 2011 ● 2009 ● 2010 ● 2011 less confident about their long-term 2-Year Review REDUCED IN THE FOLLOWING AREAS, lot of training and carry a long- employment security. In many cases, 2009 2-year review: 2009 2010 term payoff, the rate of operator 74.3% 15% 2010 2010 Raised 18.2% factories that recalled workers did so ● Candy/snacks/ ● Sundries/ investment has been slow. Tech- Neither acquired 78.9% prices 18.3% at lower wages than in years past. No No Yes Yes confections 1.5% 10.5% toiletries nology providers interviewed by nor divested 75.3% 22.47% 3.0% ● Cold beverages ● Milk 12.9% 1.0% Automatic Merchandiser concurred Profit protection efforts continue 1.5% 32.7% 35.8% 2.0% ● Vended food Absorbed 15.2% ● Games with this assessment. 8.6% extra cost 14.2% 51.2% 48.8% 48.6% 51.4% With sales falling and cost pressures ● Ice cream 10.5% ● Kiddie rides Nevertheless, more operators Both acquired 8.6% 11.5% 3.1% and divested rising, vending operators continued 5.1% ● OCS ● Manual invested in new technology in 2011 4.7% Reduced 11.3% 14.9% 9.18% 22.45% foodservice service frequency 10.3% to enact profit saving measures in ● Hot beverages 14.3% than any time prior to the start of 11.4% 10.2% 2011, although the survey indicated ● Bottled water ● No answer the Great Recession. This dem- Rearranged 10.6% Acquired 8.6% routes these measures were less dramatic onstrates both an evolving under- 11.9% 14.1% than in the previous two years. 2011 2010 2011 2010 standing of the need to adopt new 9.1% Eliminated 9.0% Slightly more operators added No Yes technology and of the commitment 5.7% unprofitable No Yes accounts 8.0% staff in 2011 than in the prior two 23.07% 22.47% that a cadre of technology providers Divested 3.9% 5.9% years, while fewer reduced staff, 1.0% have made to the industry. 33.8% 32.7% 5.9% Lowered 6.8% 48.2% 51.2% 51.8% 48.8% 1.4% 2.0% commissions indicated in chart 4a. Fiscal 2011 Operators also noted that 7.0% 3.1% 8.5% saw the most stability in staffing in 5.1% introducing a new technology, be 7.0% Postponed 5.7% the last 4-year period. 9.9% 9.18% 22.45% 18.3% it a cashless reader or a bill recy- parts or 2.8% rienced the most fallout in 2011, equipment buys 7.0% Fiscal 2011 also saw fewer opera- cler, makes it easier to justify price indicated in chart 2. Medium-size 7.5% tors opt to simply absorb higher increases to customers. Rearranged job 4.9% operators do not enjoy the econo- responsibilities costs, although this remained the 2011 2011 4.1% mies of scale of large and extra large second most frequent response to progressively tapered off over the Technology products increase 4.0% operators, nor do they benefit from Reduced 4.6% higher costs after raising prices, 4-year period.No Yes Technology providers continued to company travel 23.07% lower overhead like companies with 2.8% indicated in chart 6. Rearranging job roles in order introduce more products in 2011. less than $1 million in sales. 5.0% The need to absorb higher costs to improve efficiency slipped to the 33.8% Bill recyclers increased in 2011, 48.2% 51.8% 1.4% Reduced 4.4% The report found that operators equipment 4.6% was attributed to the limited options lowest level in four years. 8.5% indicated in chart 10a. This was in accounts with less than $1 million in sales con- operators had to offset these costs. Fiscal 2011 witnessed more driven largely by price points exceed- 4.8% 9.9% 18.3% tinued to gain market share in 2011, Adjusted 3.7% In 2011, operators reported higher expansion into new services than 2.8% ing one dollar. Bill recyclers serve a compensation/ 3.4% indicated in chart 2. While aggregate benefits costs for health insurance, wages, in any in last four years, indicated purpose similar to dollar coins. industry revenue contracted, newcom- 3.9% benefits, and products. in chart 9a. Much of the expansion Operators offered mixed views Reduced 3.0% ers continued to enter the industry. product variety 3.4% The National Restaurant Asso- was in micro markets, although about the success of bill recyclers. One bright spot in 2011 was ciation (NRA) reported that whole- some also occurred in wholesale will not become mandatory until at Some said bill recyclers gave an Postponed 1.3% a slight gain in manufacturing equipment 1.7% sale food prices jumped 8 percent in delivery; delivering product to non- least one year after final regulations immediate financial benefit since repairs 3.1% customers, indicated in chart 3. 2011, the biggest 1-year gain in more vending accounts. are released. it allowed them to pull free-stand- Manufacturers have always been the Switched 1.6% than three decades. The aggregate As of spring 2012, it was not ing bill changers that hold large to more 0.8% most profitable vending accounts. cost-efficient trucks 2.1% gain in the last five years was more Regulatory issues remain known when or if the FDA will amounts of cash. Since March 2010, U.S. manufac- than 26 percent. The most significant regulatory release final rules. Some observers Many operators, however, said turers added 500,000 employees to The gain in food prices in 2011 issue in 2011 was the federal calorie suspect the status of the health care they viewed the recyclers as more of payrolls, accounting for 13 percent top customer category for vending. was the second consecutive increase disclosure law under the federal reform law is uncertain due to a a customer convenience rather than of all jobs created through early Manufacturers, which have long following a 3.8 point decrease in health care reform law signed in legal challenge. a sales builder. 2012, according to The Wall Street been the vending industry’s largest 2009, the NRA reported. 2010. The law requires a vending Some said bill recyclers increased Journal. However, the manufactur- single customer group, have lost Slightly more vending operators operator with 20 or more machines Investment in technology gains service calls. ing sector still employed 1.8 million market share to other customer seg- rearranged routes in 2011 rather than to post calorie counts at the point of As operators felt their businesses Some also said recyclers are not fewer workers at the end of 2011 ments over the last two decades. reduced service frequency, indicated sale. NAMA submitted suggestions stabilizing more since 2008, many necessary if they use cashless read- than it did in January 2008. While the manufacturing sector in chart 6. This marked a shift from to the U.S. Food and Drug Admin- invested in new technology, indi- ers. Others, however, said recyclers The manufacturing employ- recovered somewhat in 2010 and the prior three years when more istration to make the rules manage- cated in chart 10a. More operators complement cashless readers in ment gain helped that segment of 2011, vending operators were quick operators reduced service frequency. able for vending operators. recognized that new tools such as allowing the machine more versatile the vending customer base increase to point out that the workers in Elimination of unprofitable The FDA missed its 2011 dead- DEX-based management, remote payment options. market share in 2011, when the these locations were not as willing to accounts remained at essentially line for announcing final regulations machine monitoring and cashless segment once again reigned as the spend money as they were prior to the same level, although it has for vending machines. The rules transaction capability can improve Continued ▶ 10 Automatic Merchandiser VendingMarketWatch.com June/July 2012 June/July 2012 VendingMarketWatch.com Automatic Merchandiser 11
- 3. state of the vending industry state of the vending industry Cashless readers increase Chart 9A: Expanded into new Operators noticed that in many Chart 10a: technology upgrades, 3-year review of vending banks for the same The percentage of machines services, 3-year review locations, it took time — sometimes upfront cost. 2009 2010 2011 equipped with cashless readers also ● 2009 ● 2010 ● 2011 several months — before customers Operators also noted there is less Installed bill recyclers 17.5% 26% 29% increased in 2011, indicated in chart began using card readers. Invested in remote monitoring 10.0% 12% 14% customer price sensitivity to micro 10a. The percentage, while small, 25.7% markets than vending machines. % of machines equipped with cashless readers 2.28% 3.5% 3.7% Yes 20% has increased consistently over the Remote monitoring rises Added video screens 0% 0% 0.1% In addition, because the systems past three years. The increase is 28.9% The report indicated more invest- have cashless readers, they are able Added micro markets 0% 2% 5% due to: rising retail prices, which 74.3% ment in remote machine monitoring to offer more flexible pricing than support cashless acceptance; com- No 80% (RMM) hardware and software. vending machines, which require petitive pressure; and a stronger However, this investment does not Chart 10B: Cashless projections, 2-year review nickel increments. 71.1% understanding by operators of the reflect the number of machines actu- Micro markets also carry a larger 2011 2010 benefits that cashless provides. ally reporting data via telemetry. % of machines that are cashless* 3.7% 3.5% percentage of food than vending This year, the report separated Chart 9B: If yes, which services? The survey asked operators if Projected machines with cashless 199,955 189,824 banks. Operators estimated food “open” cashless installations from ● 2009 ● 2010 ● 2011 they added RMM hardware and/ Closed cashless 31,993 (16%) 32,270 (17%) accounted for between 30 and 40 “closed” installations, indicated in or software in 2011. Automatic Open cashless 167,962 157,554 percent of all products sold in micro chart 10b. The “closed” systems 6.7% Merchandiser discovered that markets. Hence, the micro markets *Includes closed cashless systems only accept prepaid cards and do not Water service 22.6% respondents answered “yes” if they allowed operators to reclaim a big Total machine base: 5,424,070 for 2010, 5,404,200 for 2011 accept credit and debit cards. 14.3% invested in hardware and/or soft- product segment they lost in the last The report found that “closed’ 26.7% ware that will eventually give them decade — food. Chart 11: Share of sales by category, 4-year review cashless systems, which have existed OCS 16.1% RMM capability. Because micro markets were so ● 2008 ● 2009 ● 2010 ● 2011 for many years and are mainly 21.4% In the meantime, many opera- new, operators using them experi- found in prisons and schools, tors believe they can utilize machine 28.5% enced a learning curve. Operators 13.3% 29.6% declined while “open” cashless Wholesale 12.9% level electronic data to pre-kit their Cold beverages 31% needed to educate customers in systems increased. distribution routes. Operators can gain efficien- 31% using the micro markets. 17.9% 30% Cashless installations increased cies from pre-kitting without RMM. 27.4% Following is a summary of the in 2011 despite a setback posed 0% However, pre-kitting in conjunction Manual foodservice 28% main vend product segments. Manual 28.4% by the Durbin amendment to the foodservice 6.5% with RMM, once this occurs, can Continued ▶ 0% 19% Dodd-Frank financial overhaul. deliver even greater efficiencies; 21% Candy/ 21% Financial institutions raised rates on Not asked it can allow operators to schedule snacks/confections 21% small ticket debit card transactions Retail store 6.5% deliveries on an as-needed basis. 4.9% in October 2011 to make up for rates 3.6% 5.2% OCS 6.3% limiting what they could charge for 6.7% 2011: Micro markets emerge 6.4% larger transactions. Catering 0% The most dramatic development 5.8% In some cases, vending opera- of all in 2011 was the surge of self 5.1% 7.1% Vend food 4.5% tors, worried about excessive trans- checkout micro markets. A handful 4.3% Chart 12: Projected sales by category, 4-year review actions costs, notified customers Drop 13.3% of vending operators have operated 4.4% shipping 0% 4.1% Percent revenue changes they were not accepting debit cards. via courier micro markets since 2006. Since Hot beverages 3.9% 0% 2008 2009 2010 2011 2008 2009 2010 2011 Eventually, Visa, the most then, more systems have been intro- 3.7% Cold beverages $6.28B $5.874B $5.967B $5.877B -5.0% -8.5% 1.58% -1.5% popular debit card used in vending, 6.7% duced and tested. In 2011, more 1.6% Manual 6.62 5.437 5.39 5.384 -4.9 -17.8 -0.08 -0.1 1.7% agreed to limit its interchange fee Bulk 0% companies offered micro markets. Milk 1.5% foodservice for small ticket transactions. 3.6% Automatic Merchandiser esti- 1.3% Candy/snacks/ 4.19 4.167 4.04 3.977 -4.9 -0.05 -3.0 -1.55 The issue created a public rela- mated slightly less than 1,000 micro 1.4% confections 26.7% 1.6% tions problem for some vending markets were in operation by the Ice cream 1.8% OCS 1.08 1.043 1.212 1.213 1.2 -3.4 16.2 0 Other 35.5% 1.6% Vend food 1.28 1.012 0.866 0.815 -6.5 -20.9 -14.4 -5.8 operators, some of which put their 32.1% end of 2011. While the number was 0.6% Hot beverages 0.97 0.813 0.75 0.7 -7.0 -16.1 -7.7 -1.3 cashless programs on hold. not significant enough to impact 0.7% Cigarettes 0.6% Milk 0.35 0.337 0.288 0.246 -5.6 -3.7 -4.9 -14.5 The setback was temporary, aggregate industry sales, the growth 0.4% Ice cream 0.31 0.317 0.346 0.303 -10.0 2.2 9.14 -12.4 however, as operators recog- reduced costs associated with of these systems was undeniable. 3.8% Cigarettes 0.13 0.14 0.115 0.076 -6.4 7.7 -17.8 -33.9 nized consumers were moving to handling cash. Micro markets provide a much 3.6% Other* 2.2% Other 0.84 0.713 0.421 0.379 -4.7 -15.1 -40.9 -10 cashless buying. Operators also Some operators addressed the larger product variety than vend- 2% noticed that cashless acceptance debit card fee by placing notices ing machines. Most operators *Includes cooperative service vending, music, games, bulk vending, bottled water, reduced customer price resistance on their machines saying that only using micro markets estimated the sundries, toiletries, condoms, kiddie rides, and other foodservice revenue. on higher ticket items, and it also credit, not debit, cards were accepted. markets at least doubled the sales 12 Automatic Merchandiser VendingMarketWatch.com June/July 2012 June/July 2012 VendingMarketWatch.com Automatic Merchandiser 13
- 4. state of the vending industry state of the vending industry Cold beverages falter Chart 13a: Cold beverage machines by type, Chart 14A: candy/snack/confection machines, 4-year review This indicates unit sales fell more In 2011, cold beverages, the largest bottlers and vendors, 4-year review than dollar sales. 2008 2009 2010 2011 product segment in vending, failed to bottler owned Projected Total 1,320,000 1,315,000 1,315,000 1,315,000 sustain the comeback posted in 2010. Type 2008 2009 2010 2011 Weaker price increases This reflected the performance of Can closed front 974,000 950,000 950,000 930,000 Fiscal 2011 marked the third cold beverages in all retail segments, Bottle closed front 1,030,000 1,000,000 1,000,000 1,000,000 Chart 14B: Totals by category and subcategory straight year vending operators according to the New York City-based Combo bottle can closed front 378,000 350,000 350,000 350,000 raised candy, snack and confection % Sales Changes Beverage Marketing Corp. (BMC), Glassfront 180,000 195,000 200,000 210,000 2011 prices, but the increases for the top which tracks beverage trends. Cup 0 0 0 0 Share selling products were progressively In 2010, the State of the Vending ToTAL 2,562,000 2,495,000 2,500,000 2,490,000 Projected % sales of change Revenue Unit less each year, indicated in chart revenue total from 2010 Change Change Industry Report noted cold drinks 14e. This demonstrates operators vendor owned Candy $1.304B 32.7% -0.12% -1.88% -5.3% posted a 1.58-point gain, revers- Chocolate candy 0.949 23.88 0.41 -1.76 -5.5 found it increasingly difficult to Type 2008 2009 2010 2011 ing declines from the previous two Gum 0.057 1.43 -0.08 -6.55 -7.8 raise prices during the recession. Can closed front 827,000 820,000 820,000 820,000 years. The gain in 2010 was driven Bottle closed front 115,000 110,000 110,000 110,000 Mint/hard roll 0.024 0.06 -0.014 -17.24 -19.7 Operators interviewed noted that by a mild resurgence cold beverages Combo bottle can closed front 42,000 42,000 42,000 42,000 Non-chocolate 0.273 6.8 -0.4 -5.8 -9.3 winning permission to raise prices experienced in all retail outlets. Glassfront 20,000 25,000 30,000 35,000 from location managers was easier The BMC reported that liquid Snacks $2.673B 67.21% 0.15% -1.32% -4.4% than ever in 2011, due to higher Cup 11,000 8,000 6,000 4,000 beverage refreshment sales slowed Total nutrition snacks 0.113 2.85 0.26 -0.1 -12.2 prices at other retail outlets. Getting ToTAL 1,015,000 1,005,000 1,008,000 1,011,000 in 2011 following the mild surge in Breakfast bars, cereal, fruit snacks, functional bars, the end users to accept the higher nutritional pretzels, granola bars, rice cakes, trail mix 2010. BMC reported beverage sales prices, however, has been a struggle. increased by 0.9 points in 2011, Chart 13B: Cold beverage sales, 4-year review Baked goods 0.799 20.09 0.22 0 -3.8 Data provided by Management Cakes/brownies, cereal snacks, crème-filled cake, Danish, compared to a 1.2-point growth in % of sales donuts/gems, honey buns, misc. (Poptarts), muffins, pies, Science Associates (MSA), which 2010. BMC attributed the slowdown Type 2008 2009 2010 2011 regular cookies, sandwich cookies, sweet rolls, unfilled cakes tracks line-item dollar and unit to higher prices in 2011 as consum- Can 27.0% 29.0% 29.0% 29.0% Crackers 0.214 5.4 0.17 1.42 -1.9 sales in this segment, indicated unit ers resisted price increases. Bottle 72.6 70.7 70.8 70.7 Regular crackers 0.135 3.4 0.1 0 -5.6 sales posted larger declines than One factor hurting beverage Cup 0.3 0.3 0.2 0.3 Sandwich crackers 0.071 1.79 0.066 0 -2.9 dollar sales for the second straight vending in particular was a decline projected totals Food snacks 0.045 1.2 0.12 4.6 8.9 year in 2011. This explains why the in machine placements in 2011, Type 2008 2009 2010 2011 Meat snacks 0.038 1.1 1.0 10.5 6.6 segment continued to lose volume indicated in chart 13a. This reversed Can $1.653B $1.69B $1.7B $1.704B Meat and cheese 0.003 0.008 -0.004 -28.5 -25.9 despite price increases and no the uptick in machine placements Bottle 4.928 4.56 4.11 4.155 Nuts and seeds 0.061 1.5 0.7 5.2 2.1 change in machine placements. reported in 2010, reverting back to Cup 0.033 0.018 0.017 0.017 Almonds, cashews, mixed nuts, peanuts, pistachio nuts, Candy once again lost market pumpkin seeds, sunflower seeds the previous 5-year declining trend. Editor’s Note: These totals only apply to the volume sold by vending operators, not bottlers. share to snacks in 2011, indicated in The majority of machines Salty snacks 1.437 36.14 -0.28 -2.24 -5.0 chart 14b, continuing a trend from Cheese curls, corn/tortilla chips, onion rings, popcorn, potato removed in 2011 were can Chart 13C: Average cold beverage prices, 4-year review chips, potato sticks, pretzels, snack mix, misc. the previous five years. However, in machines. The decline in these each of the last three years, the loss Type 2008 2009 2010 2010 machines can be tied to a growth was less on a percentage basis. This Can 69¢ 71¢ 73¢ 76¢ in glassfront machines, which Bottle $1.15 $1.25 $1.30 $1.32 Chart 14C: Average number of new candy/snack/confection products indicates the decline in candy sales carry both cans and bottles. The Cup 70¢ 70¢ 70¢ 70¢ introduced to vending, 4-year review is bottoming out. decline in can machines did not Operators began reducing candy 2008 2009 2010 2011 undermine cans’ market share of at the expense of snacks several 147 122 245 152 vending sales in 2011, however. retail outlets where consumers can Vending operators attributed the years ago when snack manufactur- Source: Management Science Associates ProVen data. Cans still accounted for 29 percent compare vend can prices to prices growth in cans at the expense of bot- ers increased snack product variety. of vend beverage sales. Given the in other retail outlets, as opposed tles to consumer preference for lower The trend accelerated in 2006 and decline in can machines, sustained to bottles, which are sold in most prices during the recession. This gained placements, they remained Candy and snacks struggle 2007 when candy manufacturers market share for this segment indi- retail outlets. finding is consistent with BMC’s con- a minority of beverage machines. Candy, snacks and confections, the increased prices. cates can sales grew at the expense Operators raised both can and tention that consumers are gravitat- Hence, vending has not been posi- largest vend product segment after Some operators noted that the of bottles. bottle prices every year for the past ing to lower price offerings. tioned to take advantage of the cold beverages, performed in accor- reduction in candy facings hurt total Chart 13c notes operators four years, indicated in chart 13c. Glassfront beverage machines growth in non-carbonated bever- dance with overall vending sales in candy/snack sales since candy items raised can prices more than bottle In 2011, the increase was greater for continued to expand at the ages that has characterized the 2011, posting a 1.5-point decline. historically sell faster than snacks. prices in 2011. Operators noted cans than for bottles, a reversal from expense of closed front machines beverage refreshment business in As with cold beverages, the candy, Larger size candy, intended to they had more leverage in pric- 2010 when bottle prices increased in 2011, indicated in chart 13a. recent years. snack and confection category lost rejuvenate candy sales, failed. ing cans since there were fewer more than can prices. But while glassfront machines sales despite retail price increases. Continued ▶ 14 Automatic Merchandiser VendingMarketWatch.com June/July 2012 June/July 2012 VendingMarketWatch.com Automatic Merchandiser 15
- 5. state of the vending industry state of the vending industry Chart 14D: Top frozen Chart 14E: Top 20 candy/snack/confections in dollar sales, Chart 15a: Hot beverage machines, 4-year review The vending industry has confections in 2011, 4-year review found itself in a “chicken and egg” 2008 2009 2010 2011 dollar sales Average selling price 338,000 320,000 315,000 309,000 scenario with hot beverage vending. # Product # Product 1-year 1-year 2008 2009 change 2010 change 2011 change 1-year Equipment manufacturers have not 1 Cloverhill Bakery 4-oz. Big innovated in this segment mainly on 1 Masterfoods USA 2-oz. 76¢ 83¢ 9.21% 88¢ 6% 91¢ 3.65% Texas Cinnamon Snickers Original Chart 15b: Hot beverage sales, 4-year review* account of perceived weak operator 2 Cloverhill Bakery 4.75-oz. 2 Masterfoods USA 1.74-oz. 77 84 9.09 89 5 91 3.1 % of Sales demand. Operators, in turn, have Honey Bun Jumbo Glazed MM’s Peanut Type 2008 2009 2010 2011 not had machines to provide higher 3 Flowers Foods Mrs. 3 Masterfoods USA 2-oz. Twix Bar 78 85 8.97 89 4.7 92 3.3 Fresh-brew regular 46% 53.16% 54.9% 58.33% quality coffee that could fetch Freshley’s 5-oz. Honey Bun Jumbo 4 Frito-Lay 1.75-oz. Doritos Nacho 80 83 3.75 86 3.6 88 1.94 Fresh-brew decaf 4.0 5.32 5.42 3.89 higher price points. Cheesier Big Grab 4 Flowers Foods Mrs. Fresh-brew specialty/flavored 10.5 8.2 7.9 5.72 One exception was the Seattle’s Freshley’s 4-oz. Chocolate 5 Frito-Lay 1.5-oz. Ruffles Cheddar 81 85 4.94 88 3.5 90 2.18 Sour Cream Freeze-dried regular 4.15 5.5 3.1 4.54 Best Coffee machine, introduced in Cupcake 6 Frito-Lay 1.5-oz. Lay’s Chips 79 81 2.53 84 3.7 87 2.91 Freeze-dried specialty 11.5 6.7 7.86 5.76 2010 by Starbucks and Crane Mer- 5 Cloverhill Bakery 4-oz. Danish Cheese Round 7 Frito-Lay 1.125-oz. Cheetos Crunchy 64 87 35.93 75 -13.7 79 4.8 Tea 3.5 2.3 1.72 2.54 chandising Systems. 6 Flowers Foods Mrs. 8 Kellogg/Keebler 3.6-oz. Poptarts 88 91 3.41 95 3.2 97 2.19 Hot chocolate 11.5 11.67 11.67 12.75 While many operators reported Freshley’s 6-oz. Grand Iced Frosted Strawberry Soup 2.0 0.6 0.53 1.37 being able to win higher price Honey Bun 9 Masterfoods USA 2.13-oz. 77 84 9.09 88 4.7 91 3.56 Other 6.75 6.45 6.75 5.06 points with the Seattle’s Best Coffee 7 Interstate Bakery Dolly Three Musketeers Original Madison 4.25-oz.3-Pack machine, machine purchases were 10 Frito-Lay 2.125-oz. Cheetos Crunchy 80 82 2.5 83 1.2 86 3.04 Zingers Devil Food 11 Kellogg/Keebler 2-oz. Famous Amos 79 87 10.12 91 4.5 92 0.59 Chart 15C: Hot beverage sales, 4-year review* stymied due to operator unwill- 8 Interstate Bakery Dolly Chocolate Chip Cookies ingness to invest in expensive Madison 3-Pack Zingers projected totals 12 Cloverhill 4-oz. Big Texas NA NA NA 1.03 ---- $1.06 2.9 equipment during a recession. The Vanilla Type 2008 2009 2010 2011 Cinnamon Roll opportunity for this machine was 9 Cloverhill Bakery 4.75-oz. Fresh-brew regular $446.2M $432.2M $411.75M $408.31M 13 Kellogg/Keebler 1.5-oz. 61 69 13.11 73 5.7 75 3.08 limited to accounts large enough to Iced Jumbo Honey Bun Fresh-brew decaf 38.8 43.25 40.5 27.23 Cheez-It Original Fresh-brew specialty/flavored 101.85 66.66 59.25 40.04 support the high investment. Source: Vend product distributors 14 Masterfoods USA 2.17-oz. 79 87 10.12 91 4.5 93 1.82 Wrigley Skittles Freeze-dried regular 40.2 44.72 23.25 31.78 15 Hershey 1.5-oz. Reese’s Peanut NA NA NA 86 ---- 94 5.07 Freeze-dried specialty 111.5 54.47 58.5 40.32 Investment grows in OCS Butter Cups Tea 33.95 18.7 12.9 17.78 Many vending operators compen- Large-size bags falter 16 Kellogg/Keebler 2-oz. Cheez-It Original 81 87 7.4 88 1.1 89 1.29 Hot chocolate 111.5 94.88 87.53 89.25 sated for the decline in hot beverage In April of 2012, Automatic 17 Masterfoods USA 1.69-oz. 76 84 10.53 88 4.7 90 2.37 Soup 19.4 4.88 3.99 9.59 vending in recent years by expand- Merchandiser published an MM’s Milk Chocolate ing into OCS, which was the vend- Other 65.46 52.44 50.63 35.42 18 Kellogg/Keebler 2.13-oz. NA NA ---- 89 --- 96 8.42 article documenting the ing industry’s only growth area in Rice Krispies Treat *Some 2009 numbers have been adjusted since last year’s report. decline in both large size 19 Nestle 2.1-oz. Butterfinger NA NA NA 89 --- 92 2.54 2011. By getting locations to pay for candy and large size snacks 20 Frito-Lay 2.25-oz. Grandma’s NA NA NA 80 -- 85 5.14 employee coffee, operators created a in vending. In compar- Vanilla Creams Chart 15D: Hot beverage prices, 4-year review new revenue stream with OCS. OCS ing sales of these items for Editor’s Note: Percentage gains have been affected by rounding. Type 2008 2009 2010 2011 sales surpassed hot beverage vending 2009, 2010 and 2011, MSA Source: Management Science Associates ProVen data. Fresh-brew regular 57.4¢ 59¢ 59¢ 59¢ sales beginning in 2007 as a percent found operators gradually Fresh-brew decaf 57 58 58 58 of total vending industry sales. removed more large size Instead of carrying large size the unit sales gained even more Fresh-brew specialty/flavored 66 64 65 65 In 2010, OCS posted the largest items every year, despite the fact candy, operators raised prices of than dollar sales. Freeze-dried regular 57 59 59 57 1-year sales gain among all product that price points on these prod- regular size candy, mostly staying at Nuts and seeds improved both Freeze-dried specialty 59 59 59 59 segments measured in the State of ucts increased each year. or below the dollar price point. dollar and unit sales following Tea 57 55 55 55 the Vending Industry Report. In Large size candy items never Chocolate candy, which com- declines in 2010. Hot chocolate 60 58 59 59 2011, OCS was automatic merchan- gained the volume that large size prises the majority of candy sales, Baked goods, crackers and nutri- Soup 58 57 57 55 dising’s only growth segment. snacks achieved. In 2011, MSA slightly increased its share of the tion snacks grew market share in Consumer research indicates found 74 percent of machines car- business in 2011 at the expense of 2011, although they lost unit sales. vending operators have an opportu- ried large size snacks while only 14 all other types of candy, indicated in Nutrition snack unit and dollar Hot drink vending struggles Fewer hot drink machines, coupled nity to improve hot beverage sales. percent carried large size candy. chart 14b. sales took a hit in 2011 after grow- Hot beverage vending remains with stagnant coffee prices indicated In 2011, NAMA announced A key reason was pricing. Large In the snack segment, food ing in both areas in 2010. Opera- unable to capitalize on a growing in chart 15d, once again undermined the results of a consumer survey size candy carried price points in snacks and nuts and seeds increased tors grew less interested in offering U.S. coffee market. The survey hot beverage sales in 2011. Yet the 1.3- that pointed to a big opportunity excess of $1.00, which most opera- market share the most in 2011. items that don’t turn well, even as reported the number of machines point decline was less severe than for for both OCS and hot beverage tors viewed as the ceiling for what Food snack sales improved for customers kept asking for them. declined in 2011, continuing a trend vending overall, indicating some prog- vending. The consumer survey, consumers would pay. the second straight year; this year that precedes the recession. ress in this long suffering segment. Continued ▶ 16 Automatic Merchandiser VendingMarketWatch.com June/July 2012 June/July 2012 VendingMarketWatch.com Automatic Merchandiser 17