Utah Cancer Update: Lower Colorectal, Breast Cancer Rates But Higher Late-Stage Diagnoses
•
1 gefällt mir•509 views

Utah Health Status Update provides data on cancer staging in Utah. Colorectal cancer rates in Utah are lower than national rates, though some local health districts have higher rates. A higher percentage of breast cancers in Utah are diagnosed at late stages, contributing to mortality rates being only slightly lower than national rates. Screening programs aim to detect cancers earlier to reduce deaths. Screened women in the Medicaid Breast and Cervical Cancer Treatment Act were more likely to be diagnosed at earlier stages.

Empfohlen
Empfohlen
Weitere ähnliche Inhalte
Was ist angesagt?
Was ist angesagt? (20)
Andere mochten auch
Ähnlich wie Utah Cancer Update: Lower Colorectal, Breast Cancer Rates But Higher Late-Stage Diagnoses
Ähnlich wie Utah Cancer Update: Lower Colorectal, Breast Cancer Rates But Higher Late-Stage Diagnoses (20)
Mehr von State of Utah, Salt Lake City
Mehr von State of Utah, Salt Lake City (20)
Kürzlich hochgeladen
Kürzlich hochgeladen (20)
Utah Cancer Update: Lower Colorectal, Breast Cancer Rates But Higher Late-Stage Diagnoses
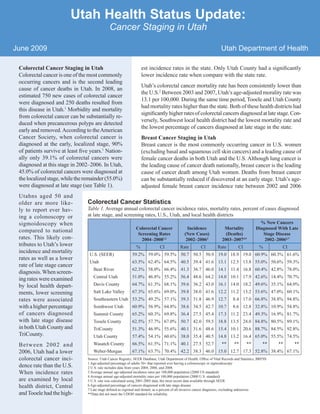
- 1. Utah Health Status Update: Cancer Staging in Utah June 2009 Utah Department of Health Colorectal Cancer Staging in Utah est incidence rates in the state. Only Utah County had a significantly Colorectal cancer is one of the most commonly lower incidence rate when compare with the state rate. occurring cancers and is the second leading Utah’s colorectal cancer mortality rate has been consistently lower than cause of cancer deaths in Utah. In 2008, an the U.S.2 Between 2003 and 2007, Utah’s age-adjusted morality rate was estimated 750 new cases of colorectal cancer 13.1 per 100,000. During the same time period, Tooele and Utah County were diagnosed and 250 deaths resulted from had mortality rates higher than the state. Both of these health districts had this disease in Utah.1 Morbidity and mortality significantly higher rates of colorectal cancers diagnosed at late stage. Con- from colorectal cancer can be substantially re- versely, Southwest local health district had the lowest mortality rate and duced when precancerous polyps are detected the lowest percentage of cancers diagnosed at late stage in the state. early and removed. According to the American Cancer Society, when colorectal cancer is Breast Cancer Staging in Utah diagnosed at the early, localized stage, 90% Breast cancer is the most commonly occurring cancer in U.S. women of patients survive at least five years.1 Nation- (excluding basal and squamous cell skin cancers) and a leading cause of ally only 39.1% of colorectal cancers were female cancer deaths in both Utah and the U.S. Although lung cancer is diagnosed at this stage in 2002–2006. In Utah, the leading cause of cancer death nationally, breast cancer is the leading 45.0% of colorectal cancers were diagnosed at cause of cancer death among Utah women. Deaths from breast cancer the localized stage, while the remainder (55.0%) can be substantially reduced if discovered at an early stage. Utah’s age- were diagnosed at late stage (see Table 1). adjusted female breast cancer incidence rate between 2002 and 2006 Utahns aged 50 and older are more like- Colorectal Cancer Statistics ly to report ever hav- Table 1. Average annual colorectal cancer incidence rates, mortality rates, percent of cases diagnosed ing a colonoscopy or at late stage, and screening rates, U.S., Utah, and local health districts sigmoidoscopy when % New Cancers Colorectal Cancer Incidence Mortality Diagnosed With Late compared to national Screening Rates (New Cases) (Deaths) Stage Disease rates. This likely con- 2004–20081,2 2002–20063 2003–20074,5 2002–20066,7 tributes to Utah’s lower % CI Rate CI Rate CI % CI incidence and mortality U.S. (SEER) 59.2% 59.0% 59.5% 50.7 50.5 50.9 19.0 18.9 19.0 60.9% 60.3% 61.6% rates as well as a lower Utah 63.5% 62.4% 64.5% 40.5 39.4 41.6 13.1 12.5 13.8 55.0% 50.6% 59.3% rate of late stage cancer Bear River 62.3% 58.0% 66.4% 41.3 36.7 46.0 14.1 11.4 16.8 60.4% 42.8% 78.0% diagnosis. When screen- Central Utah 51.0% 46.8% 55.2% 56.4 48.6 64.2 14.0 10.1 17.9 42.6% 14.4% 70.7% ing rates were examined by local health depart- Davis County 64.7% 61.3% 68.1% 39.6 36.2 43.0 16.1 14.0 18.2 49.6% 35.1% 64.0% ments, lower screening Salt Lake Valley 67.3% 65.6% 69.0% 39.8 38.0 41.6 12.2 11.2 13.2 53.6% 47.0% 60.1% rates were associated Southeastern Utah 53.2% 49.2% 57.1% 39.3 31.8 46.9 12.7 8.4 17.0 66.8% 38.8% 94.8% with a higher percentage Southwest Utah 60.9% 56.9% 64.8% 38.6 34.5 42.7 10.7 8.6 12.8 32.8% 10.9% 54.8% of cancers diagnosed Summit County 65.2% 60.3% 69.8% 36.4 27.5 45.4 17.3 11.2 23.4 49.3% 16.9% 81.7% with late stage disease Tooele County 62.5% 57.7% 67.0% 50.7 42.0 59.5 18.8 13.5 24.0 84.8% 80.5% 89.1% in both Utah County and TriCounty 51.3% 46.9% 55.6% 40.1 31.6 48.6 15.4 10.1 20.6 88.7% 84.5% 92.8% TriCounty. Utah County 57.4% 54.1% 60.6% 38.0 35.4 40.5 14.8 13.2 16.4 65.0% 55.5% 74.5% Between 2002 and Wasatch County 66.5% 61.5% 71.1% 40.1 27.5 52.7 ** ** ** ** ** ** 2006, Utah had a lower Weber-Morgan 67.1% 63.7% 70.4% 42.2 38.3 46.0 15.0 12.7 17.3 52.8% 38.4% 67.1% colorectal cancer inci- Source: Utah Cancer Registry; SEER Database; Utah Department of Health, Office of Vital Records and Statistics; BRFSS 1 Age-adjusted percentage of adults 50+ that reported ever having a colonoscopy or sigmoidoscopy dence rate than the U.S. 2 U.S. rate includes data from years 2004, 2006, and 2008. When incidence rates 3 Average annual age-adjusted incidence rates per 100,000 population (2000 US standard) 4 Average annual age-adjusted mortality rates per 100,000 population (2000 U.S. standard) are examined by local 5 U.S. rate was calculated using 2001-2005 data, the most recent data available through SEER health district, Central 6 Age-adjusted percentage of cancers diagnosed with late stage disease 7 Late stage defined as regional and distant, as a percent of all invasive cancer diagnoses, excluding unknowns and Tooele had the high- **Data did not meet the UDOH standard for reliability
- 2. (110.1 per 100,000 women) was lower than the Breast Cancer: Utah vs. U.S. U.S. rate (123.8 per 100,000). While incidence Figure 1. Average annual breast cancer incidence rates, mortality rates, and rates are significantly lower for Utah, mortality percent of cases diagnosed at late stage, U.S. and Utah, 2002–2006 rates are only slightly lower than the national rate (23.1 vs 25.0 per 100,000 women). A higher percentage of female breast cancers in Utah are diagnosed at late stage, which likely contributes to increased mortality rates (see Figure 1). In order to prevent late stage diagnosis and decrease female breast cancer deaths, the Utah Cancer Control Program (UCCP) provides free and low cost clinical breast exams and mam- mograms to women who meet age and income guidelines. Eligible women with abnormal screening exams are offered diagnostic evalu- ation by participating providers. Since July 1, 2001, the UCCP has been able to enroll quali- fying Utah women in need of treatment for breast cancer through the Medicaid Breast and Source: Utah Department of Health, Office of Vital Records and Statistics; Utah Cancer Registry; SEER Database; Cervical Cancer Treatment Act (MBCCTA), 1 Average annual age-adjusted incidence and mortality rates per 100,000 population (2000 U.S. standard). 2 U.S. mortality rate was calculated using 2001-2005 data, the most recent data available through SEER. where they receive full Medicaid benefits. 3 Utah mortality rate was calculated using 2003-2007 data. 4 Age-adjusted percentage of cancers diagnosed with late stage disease. 5 Late stage defined as regional and distant, as a percent of all invasive cancer diagnoses, excluding unknowns. In order to evaluate the effectiveness of the UCCP in detecting breast cancer at ear- lier stages, data on MBCCTA clients initially Medicaid Breast and Cervical Cancer Treatment Act Figure 2. MBCCTA breast cancers by final diagnosis, July 2001 to June 2008 screened and diagnosed by the UCCP (n=190) were compared with data on MBCCTA clients referred to the UCCP after diagnosis (n=276). Stage at diagnosis for all invasive breast cancers detected among women in these two groups was compared. Among MBCCTA breast cancer clients screened and diagnosed by the UCCP between July 2001 and June 2008, more than one-quarter of clients with invasive cancer (26.8%) were diagnosed with Stage I cancer, and only 8.9% were diagnosed at Stage IV cancer. In contrast, among MBCCTA clients referred to the UCCP after diagnosis of inva- sive breast cancer, 18.1% had been diagnosed with Stage I cancer, and 23.6% had been di- agnosed with Stage IV. Women screened and diagnosed through the UCCP were more likely Source: Utah Cancer Control Program Data to report having received a mammogram and the time since their previous mammogram was less when compared to women referred to the UCCP after diagnosis (see Figure 2). May 2009 Utah Health Status Update References: For additional information about this topic, contact Kathryn 1. American Cancer Society. Cancer Facts & Figures Rowley, Program Director for the Utah Cancer Control Program, 2008. Atlanta: American Cancer Society; 2008. Utah Department of Health, Box 142107, Salt Lake City, UT 2. Indicator Profile of Colorectal Cancer Deaths. 84114-2107, (801) 538-6233, FAX, (801) 538-9495, e-mail: Retrieved on April 30, 2009 from Utah Department krowley@utah.gov; or the Office of Public Health Assessment, of Health, Center for Health Data, Indicator-Based Utah Department of Health, Box 142101, Salt Lake City, Information System for Public Health website: UT 84114-2101, (801) 538-6108, FAX (801) 538-9346, email: http://ibis.health.utah.gov/. chdata@utah.gov
- 3. Spotlights for May 2009 Breaking News, May 2009 Preparedness Assessment In April 2009, the first human cases of Novel Influenza A (H1N1) virus infection were identified in San Diego County and Impe- rial County, California as well as in San Antonio, Texas. The Centers for Disease Control and Prevention (CDC) began working closely with state and local officials to investigate cases and provide public health guidance to those areas identified with cases. The Utah Department of Health activated the Department Operations Center and Incident Command Staff to coordinate response efforts throughout the state on April 30, 2009. Epidemiology and preparedness staffs from across the state have been engaged in community, hospital, and laboratory surveillance and reporting since that time. The first case of influenza H1N1 Influenza A (Swine Flu) Case Counts by Date, Utah, 2009 A (H1N1) in Utah was identified on May 2, 2009 in a Summit County resident. The first Utah death associated with the virus was on May 20, 2009. Utah Public Health Laboratory (UPHL) received suspected patient samples at the onset of the outbreak and initially sent samples to CDC for further sub- typing and confirmation of H1N1. UPHL has had the capacity to perform in-house testing of suspected H1N1 cases since May 6. UPHL continues to actively test patient samples for the novel virus strain. To date, infections have been identified in 9 of 12 local health districts, with most cases in Summit and Salt Lake counties. Surveillance reports are generated daily to track the spread and virulence of the disease and identify any developing trends – see www.health.utah.gov/H1N1 Community Health Indicators Spotlight, May 2009 Trends in Abortion in Utah This brief report summarizes the trends in legal in- Utah Abortion Rates, 1990–2006 duced abortion in Utah. CDC defines legal induced abortion as a procedure, performed by a licensed physician or someone acting under the supervi- sion of a licensed physician, that was intended to terminate a suspected or known intrauterine pregnancy and to produce a nonviable fetus at any gestational age.1 During 1990–2005, the abortion rate has declined. The abortion rate is defined as the number of abortions per 1,000 women aged 15–44 years. The rate dropped significantly from 10.5 in 1990 to 5.7 in 2005, representing a 46% decrease. The abortion rate remained relatively stable during 1999–2004. The 2005 rate of 5.7 was the low- est ever since 1990. However, the rate increased slightly in 2006 to 5.9. Public health agencies use abortion surveillance data to identify trends and characteristics of women who are at high risk for Source: Office of Vital Records and Statistics, Abortion 2006. Technical Report No. 259. January 2008. UDOH unintended pregnancy. This information is utilized to develop interventions to prevent unintended pregnancies and to assess the effectiveness of family planning programs.2 1. CDC. Abortion Surveillance, 1977. Atlanta, GA: U.S. Department of Health, Education, and Welfare, Public Health Service, CDC; 1979. 2. CDC. Abortion Surveillance – United States, 2004. In: Surveillance Summaries, November 23, 2007. MMWR 2007; 56 (SS09).
- 4. Monthly Health Indicators Report (Data Through April 2009) Expected/ Fiscal YTD # Expected Cases Budgeted Budgeted Variance # Expected YTD Morbidity Ratio budget҂ (under) Current Month҂ Current Month Current Month (5-yr average) (5-yr average) Month YTD Standard - over Fiscal # Cases YTD YTD҂ Medicaid Expenditures (in Millions) for (obs/exp) for the Month of April 2009 # Cases Capitated Mental Health $ 3.7 N/A $ 84.6 N/A N/A Monthly Report of Notifiable Inpatient Hospital $ 19.3 N/A $ 179.0 N/A N/A Diseases, April 2009 Outpatient Hospital $ 10.7 N/A $ 77.6 N/A N/A Campylobacteriosis (Campylobacter) 15 27 59 78 0.8 Long Term Care $ 14.8 N/A $ 148.2 N/A (N/A) Enterotoxigenic Escherichia coli (E. coli) 1 4 8 12 0.7 Pharmacy $ 10.1 N/A $ 103.1 N/A (N/A) Hepatitis A (infectious hepatitis) 0 1 3 8 0.4 Physician/Osteo Services‡ $ 6.3 N/A $ 62.8 N/A (N/A) Hepatitis B (serum hepatitis) 0 3 4 9 0.5 TOTAL HCF MEDICAID $ 153.9 N/A $ 1,256.4 N/A N/A Influenza† Weekly updates at http://health.utah.gov/epi/diseases/flu % Change§ % Change§ Population Measles (Rubeola, Hard Measles) 0 0 0 0 -- Charges in of Events Previous Previous Number Meningococcal Diseases 0 1 1 4 0.3 Millions per 100 From From Total Norovirus 1 1 6 8 0.8 Rate Year Year Pertussis (Whooping Cough) 6 39 94 145 0.6 Health Care System Measures Salmonellosis (Salmonella) 18 23 87 74 1.2 Overall Hospitalizations (2007) 278,952 9.7% -0.7% $ 4,265.9 +10.1% Shigellosis (Shigella) 3 2 10 11 0.9 Non-maternity Hospitalizations (2007) 164,659 5.6% -0.9% $ 3,554.6 +9.9% Varicella (Chickenpox) 45 72 236 352 0.7 Emergency Department Encounters (2007) 682,122 24.0% -1.3% $ 781.0 +17.1% Viral Meningitis 0 5 11 18 0.6 Outpatient Surgery (2006) 304,511 11.3% -3.1% $ 1,020.9 +7.7% % Change§ Population # Expected YTD Current Quarter Current Quarter Morbidity Ratio Data Year (5-yr average) (5-yr average) Percent/ Previous Affected YTD Standard Number Current # Cases YTD at Risk # Expected From (obs/exp) Rate Year Annual Community Health # Cases Measures Cases Notifiable Diseases Reported Overweight and Obesity (Adults 18+) 2008 1,924,274 1,119,500 58.2% +0.5% Quarterly, 1st Qtr 2009 Cigarette Smoking (Adults 18+) 2008 1,924,274 179,200 9.3% -20.4% HIV 22 21 22 21 1.1 Influenza Immunization (Adults 65+) 2008 237,275 173,900 73.3% -3.8% AIDS 13 10 13 10 1.3 Health Insurance Coverage (Uninsured) 2008 2,781,954 298,200 10.7% +0.7% Chlamydia 1,654 1,267 1,654 1,267 1.3 Motor Vehicle Crash Injury Deaths 2007 2,699,554 269 10.0 / 100,000 -12.0% Gonorrhea 82 179 82 179 0.5 Suicide Deaths 2007 2,699,554 368 13.6 / 100,000 -0.1% Tuberculosis 9 9 9 9 1.0 Diabetes Prevalence 2008 2,781,954 129,500 4.7% -1.0% Coronary Heart Disease Deaths 2007 2,699,554 1,531 56.7 / 100,000 -5.1% From Previous From 1 Year All Cancer Deaths 2007 2,699,554 2,547 94.3 / 100,000 -5.1% % Change§ % Change§ 1 Year Ago Previous Births to Adolescents (Ages 15-17) 2007 61,060 1,133 18.6 / 1,000 +13.5% Current Month Month Month Early Prenatal Care 2007 55,063 43,728 79.4% +0.5% Program Enrollment for the Ago Month of April 2009 Infant Mortality 2007 55,063 284 5.2 / 1,000 +2.5% Medicaid 189,015 184,341 +2.5% 163,459 +15.6% Childhood Immunization (4:3:1:3:3:1) 2007 51,449 40,200 78.1% +14.7% PCN (Primary Care Network) 18,520 14,702 +26.0% 19,013 -2.6% † Influenza activity is local in Utah. Influenza-like illness activity is below baseline statewide. As of May 20, 2009, 241 seasonal influenza-associated hospitalizations and 122 cases of novel influenza have been reported to the UDOH. More CHIP (Children’s Health Ins. Plan) 37,926 37,841 +0.2% 33,633 +12.8% information can be found at http://health.utah.gov/epi/diseases/flu. § % Change could be due to random variation. ҂The April budget amounts and budgeted fiscal YTD numbers are still under review due to changes involved with the 2nd Special Session budget changes and the FY 2009 incentive unemployment assumptions. ‡ Medicaid payments reported under Physician/Osteo Services do not include enhanced physician payments. Notes: Data for notifiable diseases are preliminary and subject to change upon the completion of ongoing disease investigations. Active surveillance for West Nile virus has ended until the 2009 season.