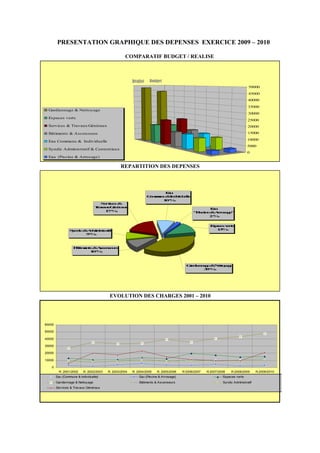
1. PRESENTATION GRAPHIQUE DES DEPENSES EXERCICE 2009 – 2010
COMPARATIF BUDGET / REALISE
50000
45000
40000
35000
Gardiennage & Nettoyage
30000
Espaces verts
25000
Services & Travaux Généraux 20000
Bâtiments & Ascenseurs 15000
Eau Commune & Individuelle 10000
5000
Syndic Administratif & Contentieux
0
Eau {Piscine & Arros age}
REPARTITION DES DEPENSES
Eau
C m e&ni i ul e
omun I d del
v
1 %
0
S ri e &
ev s
c
Taa x é é a x
r vu G r u
n
Eau
1 %
7 " i cn & r o a e
P i e A s g"
s r
2%
E a e vrs
s cs et
p
S ni & d i i t ai
yd c A n r tf
m s 1%
3
9%
Btm t & s e s us
âi e s
n A ne r
c
1 %
0
G d n a e& et y g
a i ng
r e N oa e
t
3 %
9
EVOLUTION DES CHARGES 2001 – 2010
60000
50000
40000
30000
20000
10000
0
R. 2001/2002 R. 2002/2003 R. 2003/2004 R. 2004/2005 R. 2005/2006 R 2006/2007 R.2007/2008 R.2008/2009 R.2009/2010
Eau {Commune & Individuelle} Eau {Piscine & Arrosage} Espaces verts
Gardiennage & Nettoyage Bâtiments & Ascenseurs Syndic Administratif
Services & Travaux Généraux