Finance Dashboard Template in Excel
•Als PPTX, PDF herunterladen•
1 gefällt mir•940 views

'Financial Dashboard'. Dynamic and flexible dashboard for the finance team to monitor the progress of financial indicators. Ready dashboard, just plug your data. More:https://www.bizinfograph.com/dashboard-templates/52

Empfohlen
Empfohlen
Weitere ähnliche Inhalte
Was ist angesagt?
Was ist angesagt? (20)
Ähnlich wie Finance Dashboard Template in Excel
Ähnlich wie Finance Dashboard Template in Excel (20)
Kürzlich hochgeladen
Kürzlich hochgeladen (20)
Finance Dashboard Template in Excel
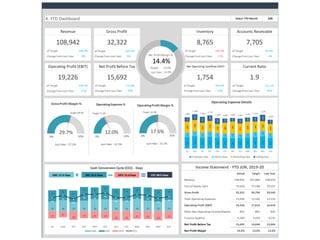
- 1. 4. YTD Dashboard JUN Actual Target Last Year Revenue 108,942 107,984 108,676 Cost of Goods Sold 76,620 77,188 79,107 Gross Profit 32,322 30,796 29,569 Total Operating Expenses 13,096 13,182 13,159 Operating Profit (EBIT) 19,226 17,614 16,410 Other Non-Operating Income/(Expense) 855 885 825 Finance Expense 4,389 4,459 4,191 Net Profit Before Tax 15,692 14,040 13,044 Net Profit Margin 14.4% 13.0% 12.0% Income Statement - YTD JUN, 2019-20 19,226 15,692 1,754 1.9 Operating Profit (EBIT) Net Profit Before Tax Net Operating Cashflow (OCF) Current Ratio 108,942 32,322 8,765 7,705 Select YTD Month Revenue Gross Profit Inventory Accounts Receivable 100.9% 105.0% 109.2% 111.8% 105.3% 93.9% 104.4% 111.1% Target 28.5% 29.7% 0% 50% GrossProfit Margin % Last Year : 27.2% 12.0% 0% 35% OperatingExpense % Last Year : 12.1% Target 12.2% 17.6% 0% 35% Last Year : 15.1% Target 16.3% OperatingProfit Margin % 390 425 375 410 380 375 360 355 380 396 420 362 155 170 169 179 160 140 180 145 153 178 190 173 389 400 350 375 320 380 396 375 400 360 345 320 153 193 211 188 198 145 126 167 146 171 223 145 1,087 1,188 1,105 1,152 1,058 1,040 1,062 1,042 1,079 1,105 1,178 1,000 JUL AUG SEP OCT NOV DEC JAN FEB MAR APR MAY JUN Employee Exps Admin Exps Marketing Exps Selling Exps Operating Expense Details Cash Conversion Cycle (CCC) - Days 32 36 30 35 39 39 38 34 40 35 31 37 36 36 37 44 39 45 36 41 39 43 41 36 -24 -20 -28 -23 -24 -24 -30 -30 -25 -26 -30 -25 44 52 39 56 54 60 44 45 54 52 42 48 JUL AUG SEP OCT NOV DEC JAN FEB MAR APR MAY JUN DSO DIO DPO CCC DSO 37.0 Days DIO 36.0 Days DPO 25.0 Days CCC 48.0 Days Net ProfitMargin % 14.4% Target: 13.0% Last Year: 12.0% of Target Change from Last Year of Target Change from Last Year of Target Change from Last Year of Target Change from Last Year of Target Change from Last Year of Target Change from Last Year of Target Change from Last Year of Target Change from Last Year 0% 9% 11% -4% 17% 20% 19% 23%
- 2. 1. Indicators 1. Indicators 2. Enter Data 1. Indicators 3. Monthly Dashboard Start Month: Start Month: JUL 4. YTD Dashboard Current Year: Current Year: 2019-20 Particular 2. Enter Data 3. Monthly Dashboard 4. YTD Dashboard Month JAN FEB MAR APR MAY JUN JUL AUG SEP OCT NOV DEC TOTAL
- 3. 1. Indicators 2. Enter Data Monthly Dashboard YTD Dashboard 2. Enter Data MAY JUN 3. Monthly Dashboard ID Indicator Name Actual/Target JUL AUG SEP OCT NOV DEC JAN FEB MAR APR MAY JUN Calculation Type Selected Month YTD 4. YTD Dashboard Actual 9,106 9,081 9,420 9,184 8,644 9,233 9,399 9,421 9,024 9,278 8,591 8,561 Sum 8,591 108,942 Target 8,963 9,089 9,015 8,534 8,519 9,020 9,490 8,753 9,031 9,325 9,128 9,117 Sum 9,128 107,984 Last Year 8,978 9,349 8,855 9,275 9,112 8,508 8,715 9,360 9,055 9,269 9,293 8,907 Sum 9,293 108,676 Actual 6,708 6,374 6,613 6,190 6,101 6,387 6,143 6,955 6,601 6,160 6,213 6,175 Sum 6,213 76,620 Target 6,537 6,837 6,578 6,169 6,609 6,118 6,258 6,114 6,917 6,564 6,158 6,329 Sum 6,158 77,188 Last Year 6,969 6,388 6,949 6,563 6,306 6,215 6,934 6,690 6,618 6,295 6,260 6,920 Sum 6,260 79,107 Actual 2,398 2,707 2,807 2,994 2,543 2,846 3,256 2,466 2,423 3,118 2,378 2,386 Sum 2,378 32,322 Target 2,426 2,252 2,437 2,365 1,910 2,902 3,232 2,639 2,114 2,761 2,970 2,788 Sum 2,970 30,796 Last Year 2,009 2,961 1,906 2,712 2,806 2,293 1,781 2,670 2,437 2,974 3,033 1,987 Sum 3,033 29,569 Actual 390 425 375 410 380 375 360 355 380 396 420 362 Sum 420 4,628 Target 380 385 375 405 360 380 389 365 375 400 375 410 Sum 375 4,599 Last Year 340 375 410 389 385 361 355 390 382 375 389 401 Sum 389 4,552 Actual 155 170 169 179 160 140 180 145 153 178 190 173 Sum 190 1,992 Target 156 158 150 164 165 170 162 168 160 170 185 181 Sum 185 1,989 Last Year 152 150 158 154 150 152 155 169 168 160 165 172 Sum 165 1,905 Actual 389 400 350 375 320 380 396 375 400 360 345 320 Sum 345 4,410 Target 360 375 374 362 350 359 340 320 325 356 360 350 Sum 360 4,231 Last Year 350 340 345 358 325 320 320 356 340 352 360 340 Sum 360 4,106 Actual 153 193 211 188 198 145 126 167 146 171 223 145 Sum 223 2,066 Target 178 213 125 234 143 237 195 200 193 266 139 240 Sum 139 2,363 Last Year 168 278 256 160 240 176 171 272 241 194 203 237 Sum 203 2,596 Actual 1,087 1,188 1,105 1,152 1,058 1,040 1,062 1,042 1,079 1,105 1,178 1,000 Sum 1,178 13,096 Target 1,074 1,131 1,024 1,165 1,018 1,146 1,086 1,053 1,053 1,192 1,059 1,181 Sum 1,059 13,182 Last Year 1,010 1,143 1,169 1,061 1,100 1,009 1,001 1,187 1,131 1,081 1,117 1,150 Sum 1,117 13,159 Actual 1,311 1,519 1,702 1,842 1,485 1,806 2,194 1,424 1,344 2,013 1,200 1,386 Sum 1,200 19,226 Target 1,352 1,121 1,413 1,200 892 1,756 2,146 1,586 1,061 1,569 1,911 1,607 Sum 1,911 17,614 Last Year 999 1,818 737 1,651 1,706 1,284 780 1,483 1,306 1,893 1,916 837 Sum 1,916 16,410 Actual 74 55 57 82 55 74 84 87 53 79 84 71 Sum 84 855 Target 85 64 70 72 82 50 79 88 79 80 61 75 Sum 61 885 Last Year 58 58 59 61 62 82 85 52 87 90 57 74 Sum 57 825 Actual 536 294 348 416 337 345 487 313 221 297 427 370 Sum 427 4,389 Target 160 524 232 471 281 226 298 567 359 410 403 529 Sum 403 4,459 Last Year 367 432 90 509 376 338 376 399 234 252 400 419 Sum 400 4,191 7 Selling Expense 4 Employee Expense 5 Admin Expense 6 Marketing Expense 1 Revenue 2 Cost of Goods Sold 3 Gross Profit 11 Finance Expense 8 Total Operating Expenses 9 Operating Profit (EBIT) 10 Other Non-Operating Income/(Expense)
- 4. 1. Indicators 2. Enter Data Monthly Dashboard YTD Dashboard 2. Enter Data MAY JUN 3. Monthly Dashboard ID Indicator Name Actual/Target JUL AUG SEP OCT NOV DEC JAN FEB MAR APR MAY JUN Calculation Type Selected Month YTD 4. YTD Dashboard Actual 9,106 9,081 9,420 9,184 8,644 9,233 9,399 9,421 9,024 9,278 8,591 8,561 Sum 8,591 108,942 Actual 850 1,280 1,411 1,508 1,203 1,535 1,791 1,199 1,176 1,795 857 1,088 Sum 857 15,692 Target 1,277 661 1,251 802 694 1,580 1,927 1,108 781 1,239 1,569 1,153 Sum 1,569 14,040 Last Year 691 1,444 707 1,203 1,392 1,029 489 1,137 1,159 1,731 1,573 492 Sum 1,573 13,044 Actual 9.3% 14.1% 15.0% 16.4% 13.9% 16.6% 19.1% 12.7% 13.0% 19.3% 10.0% 12.7% 10.0% 14.4% Target 14.2% 7.3% 13.9% 9.4% 8.1% 17.5% 20.3% 12.7% 8.6% 13.3% 17.2% 12.6% 17.2% 13.0% Last Year 7.7% 15.4% 8.0% 13.0% 15.3% 12.1% 5.6% 12.1% 12.8% 18.7% 16.9% 5.5% 16.9% 12.0% Actual 107 236 -106 179 235 205 239 -254 281 221 279 132 Sum 279 1,754 Target 85 180 50 180 210 200 210 -150 150 195 220 150 Sum 220 1,680 Last Year 75 140 60 170 190 185 186 -140 130 160 145 178 Sum 145 1,479 Actual 6,767 5,678 6,789 9,876 9,090 8,765 9,087 6,543 7,865 8,976 9,876 8,765 Last Value 9,876 8,765 Target 6,429 5,394 6,450 9,382 8,636 8,327 8,633 6,216 7,472 8,527 9,382 8,327 Last Value 9,382 8,327 Last Year 6,107 5,124 6,127 8,913 8,204 7,910 8,201 5,905 7,098 8,101 8,913 7,910 Last Value 8,913 7,910 Actual 8,195 8,173 8,478 8,266 7,780 8,310 8,459 8,479 8,122 8,350 7,732 7,705 Last Value 7,732 7,705 Target 8,067 8,180 8,114 7,681 7,667 8,118 8,541 7,878 8,128 8,393 8,215 8,205 Last Value 8,215 8,205 Last Year 8,080 8,414 7,970 8,348 8,201 7,657 7,844 8,424 8,150 8,342 8,364 8,016 Last Value 8,364 8,016 Actual 1.5 1.8 1.6 1.4 1.3 1.5 1.7 1.8 1.9 2.0 1.8 1.9 Last Value 1.8 1.9 Target 1.4 1.6 1.4 1.3 1.2 1.4 1.5 1.6 2.0 1.8 1.6 1.7 Last Value 1.6 1.7 Last Year 1.2 1.3 1.3 1.1 1.1 1.2 1.4 1.5 1.3 1.6 1.5 1.5 Last Value 1.5 1.5 Actual 32.0 36.0 30.0 35.0 39.0 39.0 38.0 34.0 40.0 35.0 31.0 37.0 Last Value 31.0 37.0 Target 30.4 34.2 28.5 33.3 37.1 37.1 36.1 32.3 38.0 33.3 29.5 35.2 Last Value 29.5 35.2 Last Year 28.9 32.5 27.1 31.6 35.2 35.2 34.3 30.7 36.1 31.6 28.0 33.4 Last Value 28.0 33.4 Actual 36.0 36.0 37.0 44.0 39.0 45.0 36.0 41.0 39.0 43.0 41.0 36.0 Last Value 41.0 36.0 Target 34.2 34.2 35.2 41.8 37.1 42.8 34.2 39.0 37.1 40.9 39.0 34.2 Last Value 39.0 34.2 Last Year 32.5 32.5 33.4 39.7 35.2 40.6 32.5 37.0 35.2 38.8 37.0 32.5 Last Value 37.0 32.5 Actual 24.0 20.0 28.0 23.0 24.0 24.0 30.0 30.0 25.0 26.0 30.0 25.0 Last Value 30.0 25.0 Target 22.8 19.0 26.6 21.9 22.8 22.8 28.5 28.5 23.8 24.7 28.5 23.8 Last Value 28.5 23.8 Last Year 21.7 18.1 25.3 20.8 21.7 21.7 27.1 27.1 22.6 23.5 27.1 22.6 Last Value 27.1 22.6 Actual 44.0 52.0 39.0 56.0 54.0 60.0 44.0 45.0 54.0 52.0 42.0 48.0 Last Value 42.0 48.0 Target 41.8 49.4 37.1 53.2 51.3 57.0 41.8 42.8 51.3 49.4 39.9 45.6 Last Value 39.9 45.6 Last Year 39.7 46.9 35.2 50.5 48.7 54.2 39.7 40.6 48.7 46.9 37.9 43.3 Last Value 37.9 43.3 1 Revenue 13 Net Operating Cashflow (OCF) 14 Inventory 13 Net Profit Margin (%) 12 Net Profit Before Tax 15 Accounts Receivable 16 Current Ratio 17 Days Sales Outstanding (DSO) 18 Days Inventory Outstanding (DIO) 19 Days Payable Outstanding (DPO) 20 Cash Conversion Cycle (CCO)
- 5. 1. Indicators 3. Monthly Dashboard MAY 2. Enter Data 3. Monthly Dashboard 4. YTD Dashboard Actual Target Last Year Revenue 8,591 9,128 9,293 Cost of Goods Sold 6,213 6,158 6,260 Gross Profit 2,378 2,970 3,033 Total Operating Expenses 1,178 1,059 1,117 Operating Profit (EBIT) 1,200 1,911 1,916 Other Non-Operating Income/(Expense) 84 61 57 Finance Expense 427 403 400 Net Profit Before Tax 857 1,569 1,573 Net Profit Margin 10.0% 17.2% 16.9% 1.8 Income Statement - MAY, 2019-20 8571,200 279 Select Month 8,591 2,378 Revenue Gross Profit 9,876 7,732 Operating Profit (EBIT) Net Profit Before Tax Inventory Accounts Receivable Net Operating Cashflow (OCF) Current Ratio 94.1% 80.1% 62.8% 54.6% 105.3% 94.1% 126.8% 111.1% Target 32.5% 27.7% 0% 50% GrossProfit Margin % Last Year : 32.6% 13.7% 0% 35% OperatingExpense % Last Year : 12.0% Target 11.6% 14.0% 0% 35% Last Year : 20.6% Target 20.9% OperatingProfit Margin % 390 425 375 410 380 375 360 355 380 396 420 155 170 169 179 160 140 180 145 153 178 190 389 400 350 375 320 380 396 375 400 360 345 153 193 211 188 198 145 126 167 146 171 223 1,087 1,188 1,105 1,152 1,058 1,040 1,062 1,042 1,079 1,105 1,178 JUL AUG SEP OCT NOV DEC JAN FEB MAR APR MAY Employee Exps Admin Exps Marketing Exps Selling Exps Operating Expense Details Cash Conversion Cycle (CCC) - Days 32 36 30 35 39 39 38 34 40 35 31 36 36 37 44 39 45 36 41 39 43 41 -24 -20 -28 -23 -24 -24 -30 -30 -25 -26 -30 44 52 39 56 54 60 44 45 54 52 42 JUL AUG SEP OCT NOV DEC JAN FEB MAR APR MAY DSO DIO DPO CCC DSO 31.0 Days DIO 41.0 Days DPO 30.0 Days CCC 42.0 Days of Target Change from Last Year -8% of Target Change from Last Year -22% of Target Change from Last Year 11% of Target Change from Last Year -8% of Target Change from Last Year -37% of Target Change from Last Year -46% of Target Change from Last Year 92% of Target Change from Last Year 23% Net ProfitMargin % 10.0% Target: 17.2% Last Year: 16.9%
- 6. 1. Indicators 4. YTD Dashboard JUN 2. Enter Data 3. Monthly Dashboard 4. YTD Dashboard Actual Target Last Year Revenue 108,942 107,984 108,676 Cost of Goods Sold 76,620 77,188 79,107 Gross Profit 32,322 30,796 29,569 Total Operating Expenses 13,096 13,182 13,159 Operating Profit (EBIT) 19,226 17,614 16,410 Other Non-Operating Income/(Expense) 855 885 825 Finance Expense 4,389 4,459 4,191 Net Profit Before Tax 15,692 14,040 13,044 Net Profit Margin 14.4% 13.0% 12.0% Select YTD Month Revenue Gross Profit Inventory Accounts Receivable Operating Profit (EBIT) Net Profit Before Tax Net Operating Cashflow (OCF) Current Ratio 108,942 32,322 8,765 7,705 Income Statement - YTD JUN, 2019-20 19,226 15,692 1,754 1.9 100.9% 105.0% 109.2% 111.8% 105.3% 93.9% 104.4% 111.1% Target 28.5% 29.7% 0% 50% GrossProfit Margin % Last Year : 27.2% 12.0% 0% 35% OperatingExpense % Last Year : 12.1% Target 12.2% 17.6% 0% 35% Last Year : 15.1% Target 16.3% OperatingProfit Margin % 390 425 375 410 380 375 360 355 380 396 420 362 155 170 169 179 160 140 180 145 153 178 190 173 389 400 350 375 320 380 396 375 400 360 345 320 153 193 211 188 198 145 126 167 146 171 223 145 1,087 1,188 1,105 1,152 1,058 1,040 1,062 1,042 1,079 1,105 1,178 1,000 JUL AUG SEP OCT NOV DEC JAN FEB MAR APR MAY JUN Employee Exps Admin Exps Marketing Exps Selling Exps Operating Expense Details Cash Conversion Cycle (CCC) - Days 32 36 30 35 39 39 38 34 40 35 31 37 36 36 37 44 39 45 36 41 39 43 41 36 -24 -20 -28 -23 -24 -24 -30 -30 -25 -26 -30 -25 44 52 39 56 54 60 44 45 54 52 42 48 JUL AUG SEP OCT NOV DEC JAN FEB MAR APR MAY JUN DSO DIO DPO CCC DSO 37.0 Days DIO 36.0 Days DPO 25.0 Days CCC 48.0 Days Net ProfitMargin % 14.4% Target: 13.0% Last Year: 12.0% of Target Change from Last Year of Target Change from Last Year of Target Change from Last Year of Target Change from Last Year of Target Change from Last Year of Target Change from Last Year of Target Change from Last Year of Target Change from Last Year 0% 9% 11% -4% 17% 20% 19% 23%