SlideShare ist ein Scribd-Unternehmen logo
1 von 6
4. YTD Dashboard JUN
101% 105%
0% 9%
109% 112%
17% 20%
Fixed Assets
3,262
Current Assets 11,115
Other Assets 561
Total Assets 14,938
Current Liabilities 5,850
Long Term Liabilities 571
Equity 8,517
Total Liabilities & Equity 14,938
Target Achievement Target Achievement
Select YTD Month
108,942 32,322
Revenue Gross Profit
Change from Last Year Change from Last Year
Operating Profit Net Profit
19,226 15,692
Target Achievement Target Achievement
Change from Last Year Change from Last Year
Balance Sheet
Target 28.5%
Target 16.3%
Gross Profit Margin (%)
Operating Profit Margin (%)
Net Profit Margin (%)
29.7%
17.6%
14.4%
Net Operating Cash Flow
1,754
Net Financing Cash Flow
1,952
Net Investing Cash Flow
2,153
Cash at End of Month
100
Days Receivable Outstanding Days Inventory Outstanding Days Payable Outstanding
Receivable Aging
Total Receivable
Overdue Receivable
% of Overdue Receivable
1,350
605
45%
93 64
Inventory Trend
102
Payable Aging
Total Payable 600
Current Ratio
1.9
Quick Ratio
1.3
Debt : Equity Ratio
48%
108,942
15,692
855
76,620
13,096
4,389
Total
Revenue
Cost of
Goods Sold
Total
Operating
Expenses
Other Non-
Operating
Income
Finance
Expense
Net Profit
Before Tax
540
405
270
135
<30 Days <60 Days <90 Days >90 Days
-
4,000
8,000
12,000
J A S O N D J F M A M J
240
180
120
60
<30 Days <60 Days <90 Days >90 Days
1.5
1.8
1.6
1.4
1.3
1.5
1.7
1.8
1.9 2.0
1.8
1.9
J A S O N D J F M A M J
Current Ratio
0.8
0.9
1.0
1.1
1.3
1.2
1.1
1.0
1.1 1.2 1.2 1.3
J A S O N D J F M A M J
Quick Ratio
45%
40%
35%33%
38%
42%44%
49%50%
45%46%48%
J A S O N D J F M A M J
Debt : Equity Ratio
Income Statement
Last Year 27.2%
Last Year 15.1%
Target 13.0%
Last Year 12.0%
0 180 0 180 0 180
Total Inventory 8,765
1. Indicators
1. Indicators
2. Enter Data 1. Indicators
3. Monthly Dashboard Start Month: Start Month: JUL
4. YTD Dashboard Current Year: Current Year: 2019-20
Particular
2. Enter Data
3. Monthly Dashboard
4. YTD Dashboard
Month
JAN
FEB
MAR
APR
MAY
JUN
JUL
AUG
SEP
OCT
NOV
DEC
TOTAL
1. Indicators 2. Enter Data Monthly Dashboard YTD Dashboard
2. Enter Data MAY JUN
3. Monthly Dashboard ID Indicator Name Actual/Target JUL AUG SEP OCT NOV DEC JAN FEB MAR APR MAY JUN Calculation Type Selected Month YTD
4. YTD Dashboard Actual 9,106 9,081 9,420 9,184 8,644 9,233 9,399 9,421 9,024 9,278 8,591 8,561 Sum 8,591 108,942
Target 8,963 9,089 9,015 8,534 8,519 9,020 9,490 8,753 9,031 9,325 9,128 9,117 Sum 9,128 107,984
Last Year 8,978 9,349 8,855 9,275 9,112 8,508 8,715 9,360 9,055 9,269 9,293 8,907 Sum 9,293 108,676
Actual 6,708 6,374 6,613 6,190 6,101 6,387 6,143 6,955 6,601 6,160 6,213 6,175 Sum 6,213 76,620
Target 6,537 6,837 6,578 6,169 6,609 6,118 6,258 6,114 6,917 6,564 6,158 6,329 Sum 6,158 77,188
Last Year 6,969 6,388 6,949 6,563 6,306 6,215 6,934 6,690 6,618 6,295 6,260 6,920 Sum 6,260 79,107
Actual 2,398 2,707 2,807 2,994 2,543 2,846 3,256 2,466 2,423 3,118 2,378 2,386 Sum 2,378 32,322
Target 2,426 2,252 2,437 2,365 1,910 2,902 3,232 2,639 2,114 2,761 2,970 2,788 Sum 2,970 30,796
Last Year 2,009 2,961 1,906 2,712 2,806 2,293 1,781 2,670 2,437 2,974 3,033 1,987 Sum 3,033 29,569
Actual 1,087 1,188 1,105 1,152 1,058 1,040 1,062 1,042 1,079 1,105 1,178 1,000 Sum 1,178 13,096
Target 1,074 1,131 1,024 1,165 1,018 1,146 1,086 1,053 1,053 1,192 1,059 1,181 Sum 1,059 13,182
Last Year 1,010 1,143 1,169 1,061 1,100 1,009 1,001 1,187 1,131 1,081 1,117 1,150 Sum 1,117 13,159
Actual 1,311 1,519 1,702 1,842 1,485 1,806 2,194 1,424 1,344 2,013 1,200 1,386 Sum 1,200 19,226
Target 1,352 1,121 1,413 1,200 892 1,756 2,146 1,586 1,061 1,569 1,911 1,607 Sum 1,911 17,614
Last Year 999 1,818 737 1,651 1,706 1,284 780 1,483 1,306 1,893 1,916 837 Sum 1,916 16,410
Actual 74 55 57 82 55 74 84 87 53 79 84 71 Sum 84 855
Target 85 64 70 72 82 50 79 88 79 80 61 75 Sum 61 885
Last Year 58 58 59 61 62 82 85 52 87 90 57 74 Sum 57 825
Actual 536 294 348 416 337 345 487 313 221 297 427 370 Sum 427 4,389
Target 160 524 232 471 281 226 298 567 359 410 403 529 Sum 403 4,459
Last Year 367 432 90 509 376 338 376 399 234 252 400 419 Sum 400 4,191
Actual 850 1,280 1,411 1,508 1,203 1,535 1,791 1,199 1,176 1,795 857 1,088 Sum 857 15,692
Target 1,277 661 1,251 802 694 1,580 1,927 1,108 781 1,239 1,569 1,153 Sum 1,569 14,040
Last Year 691 1,444 707 1,203 1,392 1,029 489 1,137 1,159 1,731 1,573 492 Sum 1,573 13,044
Actual 9.3% 14.1% 15.0% 16.4% 13.9% 16.6% 19.1% 12.7% 13.0% 19.3% 10.0% 12.7% 10.0% 14.4%
Target 14.2% 7.3% 13.9% 9.4% 8.1% 17.5% 20.3% 12.7% 8.6% 13.3% 17.2% 12.6% 17.2% 13.0%
Last Year 7.7% 15.4% 8.0% 13.0% 15.3% 12.1% 5.6% 12.1% 12.8% 18.7% 16.9% 5.5% 16.9% 12.0%
Revenue1
2 Cost of Goods Sold
3 Gross Profit
8 Net Profit Before Tax
9 Net Profit Margin %
4 Total Operating Expenses
5 Operating Profit (EBIT)
7 Finance Expense
6
Other Non-Operating
Income/(Expense)
1. Indicators 2. Enter Data Monthly Dashboard YTD Dashboard
2. Enter Data MAY JUN
3. Monthly Dashboard ID Indicator Name Actual/Target JUL AUG SEP OCT NOV DEC JAN FEB MAR APR MAY JUN Calculation Type Selected Month YTD
4. YTD Dashboard Actual 9,106 9,081 9,420 9,184 8,644 9,233 9,399 9,421 9,024 9,278 8,591 8,561 Sum 8,591 108,942
10 Net Operating Cash Flow Actual 107 236 -106 179 235 205 239 -254 281 221 279 132 Sum 279 1,754
11 Net Financing Cash Flow Actual 177 135 231 217 124 191 218 155 135 121 131 117 Sum 131 1,952
12 Net Investing Cash Flow Actual 149 101 295 257 188 146 182 141 127 117 208 242 Sum 208 2,153
13 Cash at End of Month Actual 105 100 113 110 107 114 111 103 117 119 121 100 Last Value 121 100
14 Accounts Receivable Actual 1,275 1,305 1,350 1,275 1,350 1,275 1,290 1,350 1,275 1,350 1,275 1,350 Last Value 1,275 1,350
15 Days Receivable Outstanding Actual 81 39 94 53 99 29 58 87 40 110 89 93 Last Value 89 93
16 Overdue Accounts Receivable Actual 511 435 465 586 570 553 622 572 430 642 409 605 Last Value 409 605
17 % of Overdue Receivable Actual 40% 33% 34% 46% 42% 43% 48% 42% 34% 48% 32% 45% 32% 45%
18 Accounts Receivable Aging Actual
19 <30 Days Actual 510 522 540 510 540 510 516 540 510 540 510 540 Last Value 510 540
20 <60 Days Actual 383 392 405 383 405 383 387 405 383 405 383 405 Last Value 383 405
21 <90 Days Actual 255 261 270 255 270 255 258 270 255 270 255 270 Last Value 255 270
22 >90 Days Actual 128 131 135 128 135 128 129 135 128 135 128 135 Last Value 128 135
23 Total Accounts Receivable Actual 1,275 1,305 1,350 1,275 1,350 1,275 1,290 1,350 1,275 1,350 1,275 1,350 Last Value 1,275 1,350
- - - - - - - - - - - -
24 Accounts Payable Actual 800 900 750 1,000 1,200 1,500 900 800 700 600 700 600 Last Value 700 600
25 Days Payable Outstanding Actual 162 57 56 94 92 39 51 60 127 158 145 102 Last Value 145 102
26 Accounts Payable Aging Actual
27 <30 Days Actual 320 360 300 400 480 600 360 320 280 240 280 240 Last Value 280 240
28 <60 Days Actual 240 270 225 300 360 450 270 240 210 180 210 180 Last Value 210 180
29 <90 Days Actual 160 180 150 200 240 300 180 160 140 120 140 120 Last Value 140 120
30 >90 Days Actual 80 90 75 100 120 150 90 80 70 60 70 60 Last Value 70 60
31 Total Accounts Payable Actual 800 900 750 1,000 1,200 1,500 900 800 700 600 700 600 Last Value 700 600
- - - - - - - - - - - -
32 Inventory Actual 6,767 5,678 6,789 9,876 9,090 8,765 9,087 6,543 7,865 8,976 9,876 8,765 Last Value 9,876 8,765
33 Days Inventory Outstanding Actual 30 86 33 79 33 43 68 84 74 61 37 64 Last Value 37 64
34 Current Ratio Actual 1.5 1.8 1.6 1.4 1.3 1.5 1.7 1.8 1.9 2.0 1.8 1.9 Last Value 1.8 1.9
35 Quick Ratio Actual 0.8 0.9 1.0 1.1 1.3 1.2 1.1 1.0 1.1 1.2 1.2 1.3 Last Value 1.2 1.3
36 Debt : Equity Ratio Actual 45% 40% 35% 33% 38% 42% 44% 49% 50% 45% 46% 48% Last Value 46% 48%
37 Fixed Assets Actual 3,251 3,252 3,253 3,254 3,255 3,256 3,257 3,258 3,259 3,260 3,261 3,262 Last Value 3,261 3,262
38 Current Assets Actual 9,042 7,983 9,139 12,151 11,440 11,040 11,377 8,893 10,140 11,326 12,151 11,115 Last Value 12,151 11,115
39 Other Assets Actual 550 551 552 553 554 555 556 557 558 559 560 561 Last Value 560 561
40 Total Assets Actual 12,843 11,786 12,944 15,958 15,249 14,851 15,190 12,708 13,957 15,145 15,972 14,938 Last Value 15,972 14,938
41 Current Liabilities Actual 6,028 4,562 5,712 8,679 8,800 7,360 6,692 4,941 5,337 5,808 6,751 5,850 Last Value 6,751 5,850
42 Long Term Liabilities Actual 503 691 531 573 663 751 832 589 550 706 772 571 Last Value 772 571
43 Equity Actual 6,312 6,533 6,701 6,706 5,786 6,740 7,666 7,178 8,070 8,631 8,449 8,517 Last Value 8,449 8,517
44 Total Liabilities & Equity Actual 12,843 11,786 12,944 15,958 15,249 14,851 15,190 12,708 13,957 15,145 15,972 14,938 Last Value 15,972 14,938
(Accounts Receivable and Total of Receivable Aging
must be equal)
(Accounts Payable and Total of Payable Aging must be
equal)
Revenue1
1. Indicators 3. Monthly Dashboard MAY
2. Enter Data
3. Monthly Dashboard
4. YTD Dashboard
94% 80%
-8% -22%
63% 55%
-37% -46%
Fixed Assets
3,261
Current Assets 12,151
Other Assets 560
Total Assets 15,972
Current Liabilities 6,751
Long Term Liabilities 772
Equity 8,449
Total Liabilities & Equity 15,972
Balance Sheet
8,591 2,378
Operating Profit
1,200
Net Profit
857
Target Achievement
Change from Last Year
Target Achievement Target Achievement
Change from Last Year Change from Last Year
Select Month
Target Achievement
Change from Last Year
Gross ProfitRevenue
Target 17.2%
Target 20.9%
Target 32.5%
8,591
857
6,213
1,178
427
Total
Revenue
Cost of
Goods Sold
Total
Operating
Expenses
Other Non-
Operating
Income
Finance
Expense
Net Profit
Before Tax
Gross Profit Margin (%)
Operating Profit Margin (%)
Net Profit Margin (%)
27.7%
14.0%
10.0%
Net Operating Cash Flow
279
Net Financing Cash Flow
131
Net Investing Cash Flow
208
Cash at End of Month
121
Days Receivable Outstanding Days Inventory Outstanding Days Payable Outstanding
510
383
255
128
<30 Days <60 Days <90 Days >90 Days
Receivable Aging
Total Receivable
Overdue Receivable
% of Overdue Receivable
1,275
409
32%
89 37
-
4,000
8,000
12,000
J A S O N D J F M A M
Inventory Trend
145
280
210
140
70
<30 Days <60 Days <90 Days >90 Days
Payable Aging
Total Payable 700
Current Ratio
1.8
Quick Ratio
1.2
Debt : Equity Ratio
46%
1.5
1.8
1.6
1.4
1.3
1.5
1.7
1.8
1.9 2.0
1.8
J A S O N D J F M A M
Current Ratio
0.8
0.9
1.0
1.1
1.3
1.2
1.1
1.0
1.1 1.2 1.2
J A S O N D J F M A M
Quick Ratio
45%
40%
35% 33%
38%
42% 44%
49% 50%
45% 46%
J A S O N D J F M A M
Debt : Equity Ratio
Income Statement
Last Year 32.6%
Last Year20.6%
Last Year 16.9%
0 180 0 180 0 180
Total Inventory 9,876
84
1. Indicators 4. YTD Dashboard JUN
2. Enter Data
3. Monthly Dashboard
4. YTD Dashboard
101% 105%
0% 9%
109% 112%
17% 20%
Fixed Assets
3,262
Current Assets 11,115
Other Assets 561
Total Assets 14,938
Current Liabilities 5,850
Long Term Liabilities 571
Equity 8,517
Total Liabilities & Equity 14,938
Target Achievement Target Achievement
Select YTD Month
108,942 32,322
Revenue Gross Profit
Change from Last Year Change from Last Year
Operating Profit Net Profit
19,226 15,692
Target Achievement Target Achievement
Change from Last Year Change from Last Year
Balance Sheet
Target 28.5%
Target 16.3%
Gross Profit Margin (%)
Operating Profit Margin (%)
Net Profit Margin (%)
29.7%
17.6%
14.4%
Net Operating Cash Flow
1,754
Net Financing Cash Flow
1,952
Net Investing Cash Flow
2,153
Cash at End of Month
100
Days Receivable Outstanding Days Inventory Outstanding Days Payable Outstanding
Receivable Aging
Total Receivable
Overdue Receivable
% of Overdue Receivable
1,350
605
45%
93 64
Inventory Trend
102
Payable Aging
Total Payable 600
Current Ratio
1.9
Quick Ratio
1.3
Debt : Equity Ratio
48%
108,942
15,692
76,620
13,096
4,389
Total
Revenue
Cost of
Goods Sold
Total
Operating
Expenses
Other Non-
Operating
Income
Finance
Expense
Net Profit
Before Tax
540
405
270
135
<30 Days <60 Days <90 Days >90 Days
-
4,000
8,000
12,000
J A S O N D J F M A M J
240
180
120
60
<30 Days <60 Days <90 Days >90 Days
1.5
1.8
1.6
1.4
1.3
1.5
1.7
1.8
1.9 2.0
1.8
1.9
J A S O N D J F M A M J
Current Ratio
0.8
0.9
1.0
1.1
1.3
1.2
1.1
1.0
1.1 1.2 1.2 1.3
J A S O N D J F M A M J
Quick Ratio
45%
40%
35%33%
38%
42%44%
49%50%
45%46%48%
J A S O N D J F M A M J
Debt : Equity Ratio
Income Statement
Last Year 27.2%
Last Year15.1%
Target 13.0%
Last Year 12.0%
0 180 0 180 0 180
Total Inventory 8,765
855

Weitere ähnliche Inhalte

Was ist angesagt?

Digital Transformation Toolkit - Framework, Best Practices and Templates
Digital Transformation Toolkit - Framework, Best Practices and TemplatesDigital Transformation Toolkit - Framework, Best Practices and Templates
Digital Transformation Toolkit - Framework, Best Practices and TemplatesAurelien Domont, MBA
 
How fit is your capital allocation strategy?
How fit is your capital allocation strategy? How fit is your capital allocation strategy?
How fit is your capital allocation strategy? EY
 
Business Strategy Presentation Template 2023 - By ex-Mckinsey and BCG consult...
Business Strategy Presentation Template 2023 - By ex-Mckinsey and BCG consult...Business Strategy Presentation Template 2023 - By ex-Mckinsey and BCG consult...
Business Strategy Presentation Template 2023 - By ex-Mckinsey and BCG consult...Slideworks
 
Management Consulting Toolkit with Great Powerpoint Presentations
Management Consulting Toolkit with Great Powerpoint PresentationsManagement Consulting Toolkit with Great Powerpoint Presentations
Management Consulting Toolkit with Great Powerpoint PresentationsAurelien Domont, MBA
 
Private Sector Opportunity to Improve Well-Being
Private Sector Opportunity to Improve Well-Being Private Sector Opportunity to Improve Well-Being
Private Sector Opportunity to Improve Well-Being Boston Consulting Group
 
Financial Statement Analysis PowerPoint Presentation Slides
Financial Statement Analysis PowerPoint Presentation SlidesFinancial Statement Analysis PowerPoint Presentation Slides
Financial Statement Analysis PowerPoint Presentation SlidesSlideTeam
 
Digital Transformation Strategy and Plan Template
Digital Transformation Strategy and Plan TemplateDigital Transformation Strategy and Plan Template
Digital Transformation Strategy and Plan TemplateAurelien Domont, MBA
 
Top Trends in Wealth Management 2022
Top Trends in Wealth Management 2022Top Trends in Wealth Management 2022
Top Trends in Wealth Management 2022Capgemini
 
Corporate ventures in sweden
Corporate ventures in swedenCorporate ventures in sweden
Corporate ventures in swedenFelipe Sotelo A.
 
Business toolkit in Powerpoint and Excel
Business toolkit in Powerpoint and ExcelBusiness toolkit in Powerpoint and Excel
Business toolkit in Powerpoint and ExcelAurelien Domont, MBA
 
Booz Allen Hamilton and Market Connections: C4ISR Survey Report
Booz Allen Hamilton and Market Connections: C4ISR Survey ReportBooz Allen Hamilton and Market Connections: C4ISR Survey Report
Booz Allen Hamilton and Market Connections: C4ISR Survey ReportBooz Allen Hamilton
 
Digital Transformation Strategy & Framework | By ex-McKinsey
Digital Transformation Strategy & Framework | By ex-McKinseyDigital Transformation Strategy & Framework | By ex-McKinsey
Digital Transformation Strategy & Framework | By ex-McKinseyAurelien Domont, MBA
 
IBOR transition: Opportunities and challenges for the asset management industry
IBOR transition: Opportunities and challenges for the asset management industryIBOR transition: Opportunities and challenges for the asset management industry
IBOR transition: Opportunities and challenges for the asset management industryEY
 
Market & Competitive Analysis Template.pdf
Market & Competitive Analysis Template.pdfMarket & Competitive Analysis Template.pdf
Market & Competitive Analysis Template.pdfStratechi.com
 
Power transactions and trends Q2 2019
Power transactions and trends Q2 2019Power transactions and trends Q2 2019
Power transactions and trends Q2 2019EY
 
Pwc data analytics
Pwc data analyticsPwc data analytics
Pwc data analyticsPip Barton
 
Mergers and Acquisitions Toolkit - Framework, Best Practices and Templates
Mergers and Acquisitions Toolkit - Framework, Best Practices and TemplatesMergers and Acquisitions Toolkit - Framework, Best Practices and Templates
Mergers and Acquisitions Toolkit - Framework, Best Practices and TemplatesAurelien Domont, MBA
 
Financial Modelling Course including an Excel Financial Model Template
Financial Modelling Course including an Excel Financial Model TemplateFinancial Modelling Course including an Excel Financial Model Template
Financial Modelling Course including an Excel Financial Model TemplateAurelien Domont, MBA
 

Was ist angesagt? (20)

How to accelerate digital solutions
How to accelerate digital solutionsHow to accelerate digital solutions
How to accelerate digital solutions
 
Digital Transformation Toolkit - Framework, Best Practices and Templates
Digital Transformation Toolkit - Framework, Best Practices and TemplatesDigital Transformation Toolkit - Framework, Best Practices and Templates
Digital Transformation Toolkit - Framework, Best Practices and Templates
 
How fit is your capital allocation strategy?
How fit is your capital allocation strategy? How fit is your capital allocation strategy?
How fit is your capital allocation strategy?
 
Business Strategy Presentation Template 2023 - By ex-Mckinsey and BCG consult...
Business Strategy Presentation Template 2023 - By ex-Mckinsey and BCG consult...Business Strategy Presentation Template 2023 - By ex-Mckinsey and BCG consult...
Business Strategy Presentation Template 2023 - By ex-Mckinsey and BCG consult...
 
Management Consulting Toolkit with Great Powerpoint Presentations
Management Consulting Toolkit with Great Powerpoint PresentationsManagement Consulting Toolkit with Great Powerpoint Presentations
Management Consulting Toolkit with Great Powerpoint Presentations
 
Private Sector Opportunity to Improve Well-Being
Private Sector Opportunity to Improve Well-Being Private Sector Opportunity to Improve Well-Being
Private Sector Opportunity to Improve Well-Being
 
Financial Statement Analysis PowerPoint Presentation Slides
Financial Statement Analysis PowerPoint Presentation SlidesFinancial Statement Analysis PowerPoint Presentation Slides
Financial Statement Analysis PowerPoint Presentation Slides
 
Digital Transformation Strategy and Plan Template
Digital Transformation Strategy and Plan TemplateDigital Transformation Strategy and Plan Template
Digital Transformation Strategy and Plan Template
 
Top Trends in Wealth Management 2022
Top Trends in Wealth Management 2022Top Trends in Wealth Management 2022
Top Trends in Wealth Management 2022
 
Corporate ventures in sweden
Corporate ventures in swedenCorporate ventures in sweden
Corporate ventures in sweden
 
Business toolkit in Powerpoint and Excel
Business toolkit in Powerpoint and ExcelBusiness toolkit in Powerpoint and Excel
Business toolkit in Powerpoint and Excel
 
Booz Allen Hamilton and Market Connections: C4ISR Survey Report
Booz Allen Hamilton and Market Connections: C4ISR Survey ReportBooz Allen Hamilton and Market Connections: C4ISR Survey Report
Booz Allen Hamilton and Market Connections: C4ISR Survey Report
 
KPI Course slides
KPI Course slidesKPI Course slides
KPI Course slides
 
Digital Transformation Strategy & Framework | By ex-McKinsey
Digital Transformation Strategy & Framework | By ex-McKinseyDigital Transformation Strategy & Framework | By ex-McKinsey
Digital Transformation Strategy & Framework | By ex-McKinsey
 
IBOR transition: Opportunities and challenges for the asset management industry
IBOR transition: Opportunities and challenges for the asset management industryIBOR transition: Opportunities and challenges for the asset management industry
IBOR transition: Opportunities and challenges for the asset management industry
 
Market & Competitive Analysis Template.pdf
Market & Competitive Analysis Template.pdfMarket & Competitive Analysis Template.pdf
Market & Competitive Analysis Template.pdf
 
Power transactions and trends Q2 2019
Power transactions and trends Q2 2019Power transactions and trends Q2 2019
Power transactions and trends Q2 2019
 
Pwc data analytics
Pwc data analyticsPwc data analytics
Pwc data analytics
 
Mergers and Acquisitions Toolkit - Framework, Best Practices and Templates
Mergers and Acquisitions Toolkit - Framework, Best Practices and TemplatesMergers and Acquisitions Toolkit - Framework, Best Practices and Templates
Mergers and Acquisitions Toolkit - Framework, Best Practices and Templates
 
Financial Modelling Course including an Excel Financial Model Template
Financial Modelling Course including an Excel Financial Model TemplateFinancial Modelling Course including an Excel Financial Model Template
Financial Modelling Course including an Excel Financial Model Template
 

Ähnlich wie CFO Dashboard Template in Excel

Horniman Horticulture, FIL 349 ( Advanced Financial Theory and Problems)
Horniman Horticulture, FIL 349 ( Advanced Financial Theory and Problems)Horniman Horticulture, FIL 349 ( Advanced Financial Theory and Problems)
Horniman Horticulture, FIL 349 ( Advanced Financial Theory and Problems)CameronMcintosh8
 
GuessBox Financial Model 2017
GuessBox Financial Model 2017GuessBox Financial Model 2017
GuessBox Financial Model 2017GuessBox
 
Muthengi mike bamburi financial model - enhancement
Muthengi mike   bamburi financial model - enhancementMuthengi mike   bamburi financial model - enhancement
Muthengi mike bamburi financial model - enhancementMike Muthengi
 
Valuation of Indian hospitality industry
Valuation of Indian hospitality industryValuation of Indian hospitality industry
Valuation of Indian hospitality industryShivani Chaluvadi
 
Neslte India Ltd_Financial Model Working.pdf
Neslte India Ltd_Financial Model Working.pdfNeslte India Ltd_Financial Model Working.pdf
Neslte India Ltd_Financial Model Working.pdfDeepakKumar234566
 
Current Years Estimation PowerPoint Presentation Slides
Current Years Estimation PowerPoint Presentation SlidesCurrent Years Estimation PowerPoint Presentation Slides
Current Years Estimation PowerPoint Presentation SlidesSlideTeam
 
Investment In Business Assets PowerPoint Presentation Slides
Investment In Business Assets PowerPoint Presentation SlidesInvestment In Business Assets PowerPoint Presentation Slides
Investment In Business Assets PowerPoint Presentation SlidesSlideTeam
 
FIN 667 Hershey Valuation PPT- Final
FIN 667 Hershey Valuation PPT- FinalFIN 667 Hershey Valuation PPT- Final
FIN 667 Hershey Valuation PPT- FinalLisa Lee
 
Financial Ratio Analysis PowerPoint Presentation Slides
Financial Ratio Analysis PowerPoint Presentation SlidesFinancial Ratio Analysis PowerPoint Presentation Slides
Financial Ratio Analysis PowerPoint Presentation SlidesSlideTeam
 
Budgeting And Forecasting In Accounting PowerPoint Presentation Slides
Budgeting And Forecasting In Accounting PowerPoint Presentation SlidesBudgeting And Forecasting In Accounting PowerPoint Presentation Slides
Budgeting And Forecasting In Accounting PowerPoint Presentation SlidesSlideTeam
 
Commercial Due Diligence Process PowerPoint Presentation Slides
Commercial Due Diligence Process PowerPoint Presentation SlidesCommercial Due Diligence Process PowerPoint Presentation Slides
Commercial Due Diligence Process PowerPoint Presentation SlidesSlideTeam
 
International Contractor Overviews Q2 2017
International Contractor Overviews Q2 2017International Contractor Overviews Q2 2017
International Contractor Overviews Q2 2017Jonathan Hunt
 

Ähnlich wie CFO Dashboard Template in Excel (20)

CEO Dashboard Template in Excel
CEO Dashboard Template in ExcelCEO Dashboard Template in Excel
CEO Dashboard Template in Excel
 
MF
MFMF
MF
 
Horniman Horticulture, FIL 349 ( Advanced Financial Theory and Problems)
Horniman Horticulture, FIL 349 ( Advanced Financial Theory and Problems)Horniman Horticulture, FIL 349 ( Advanced Financial Theory and Problems)
Horniman Horticulture, FIL 349 ( Advanced Financial Theory and Problems)
 
GuessBox Financial Model 2017
GuessBox Financial Model 2017GuessBox Financial Model 2017
GuessBox Financial Model 2017
 
120981064 new-doll
120981064 new-doll120981064 new-doll
120981064 new-doll
 
Muthengi mike bamburi financial model - enhancement
Muthengi mike   bamburi financial model - enhancementMuthengi mike   bamburi financial model - enhancement
Muthengi mike bamburi financial model - enhancement
 
Valuation of Indian hospitality industry
Valuation of Indian hospitality industryValuation of Indian hospitality industry
Valuation of Indian hospitality industry
 
Neslte India Ltd_Financial Model Working.pdf
Neslte India Ltd_Financial Model Working.pdfNeslte India Ltd_Financial Model Working.pdf
Neslte India Ltd_Financial Model Working.pdf
 
Current Years Estimation PowerPoint Presentation Slides
Current Years Estimation PowerPoint Presentation SlidesCurrent Years Estimation PowerPoint Presentation Slides
Current Years Estimation PowerPoint Presentation Slides
 
Investment In Business Assets PowerPoint Presentation Slides
Investment In Business Assets PowerPoint Presentation SlidesInvestment In Business Assets PowerPoint Presentation Slides
Investment In Business Assets PowerPoint Presentation Slides
 
FIN 667 Hershey Valuation PPT- Final
FIN 667 Hershey Valuation PPT- FinalFIN 667 Hershey Valuation PPT- Final
FIN 667 Hershey Valuation PPT- Final
 
Financial Ratio Analysis PowerPoint Presentation Slides
Financial Ratio Analysis PowerPoint Presentation SlidesFinancial Ratio Analysis PowerPoint Presentation Slides
Financial Ratio Analysis PowerPoint Presentation Slides
 
Financial model
Financial modelFinancial model
Financial model
 
Work sample
Work sampleWork sample
Work sample
 
Forcast Model
Forcast ModelForcast Model
Forcast Model
 
Budgeting And Forecasting In Accounting PowerPoint Presentation Slides
Budgeting And Forecasting In Accounting PowerPoint Presentation SlidesBudgeting And Forecasting In Accounting PowerPoint Presentation Slides
Budgeting And Forecasting In Accounting PowerPoint Presentation Slides
 
bKash equity valuation 2018
bKash equity valuation 2018bKash equity valuation 2018
bKash equity valuation 2018
 
INVESTAURA_Business-Planning-Template.pdf
INVESTAURA_Business-Planning-Template.pdfINVESTAURA_Business-Planning-Template.pdf
INVESTAURA_Business-Planning-Template.pdf
 
Commercial Due Diligence Process PowerPoint Presentation Slides
Commercial Due Diligence Process PowerPoint Presentation SlidesCommercial Due Diligence Process PowerPoint Presentation Slides
Commercial Due Diligence Process PowerPoint Presentation Slides
 
International Contractor Overviews Q2 2017
International Contractor Overviews Q2 2017International Contractor Overviews Q2 2017
International Contractor Overviews Q2 2017
 

Kürzlich hochgeladen

Proofreading- Basics to Artificial Intelligence Integration - Presentation:Sl...
Proofreading- Basics to Artificial Intelligence Integration - Presentation:Sl...Proofreading- Basics to Artificial Intelligence Integration - Presentation:Sl...
Proofreading- Basics to Artificial Intelligence Integration - Presentation:Sl...David Celestin
 
Uncommon Grace The Autobiography of Isaac Folorunso
Uncommon Grace The Autobiography of Isaac FolorunsoUncommon Grace The Autobiography of Isaac Folorunso
Uncommon Grace The Autobiography of Isaac FolorunsoKayode Fayemi
 
Introduction to Artificial intelligence.
Introduction to Artificial intelligence.Introduction to Artificial intelligence.
Introduction to Artificial intelligence.thamaeteboho94
 
Digital collaboration with Microsoft 365 as extension of Drupal
Digital collaboration with Microsoft 365 as extension of DrupalDigital collaboration with Microsoft 365 as extension of Drupal
Digital collaboration with Microsoft 365 as extension of DrupalFabian de Rijk
 
Dreaming Music Video Treatment _ Project & Portfolio III
Dreaming Music Video Treatment _ Project & Portfolio IIIDreaming Music Video Treatment _ Project & Portfolio III
Dreaming Music Video Treatment _ Project & Portfolio IIINhPhngng3
 
lONG QUESTION ANSWER PAKISTAN STUDIES10.
lONG QUESTION ANSWER PAKISTAN STUDIES10.lONG QUESTION ANSWER PAKISTAN STUDIES10.
lONG QUESTION ANSWER PAKISTAN STUDIES10.lodhisaajjda
 
Zone Chairperson Role and Responsibilities New updated.pptx
Zone Chairperson Role and Responsibilities New updated.pptxZone Chairperson Role and Responsibilities New updated.pptx
Zone Chairperson Role and Responsibilities New updated.pptxlionnarsimharajumjf
 
Unlocking Exploration: Self-Motivated Agents Thrive on Memory-Driven Curiosity
Unlocking Exploration: Self-Motivated Agents Thrive on Memory-Driven CuriosityUnlocking Exploration: Self-Motivated Agents Thrive on Memory-Driven Curiosity
Unlocking Exploration: Self-Motivated Agents Thrive on Memory-Driven CuriosityHung Le
 
Jual obat aborsi Jakarta 085657271886 Cytote pil telat bulan penggugur kandun...
Jual obat aborsi Jakarta 085657271886 Cytote pil telat bulan penggugur kandun...Jual obat aborsi Jakarta 085657271886 Cytote pil telat bulan penggugur kandun...
Jual obat aborsi Jakarta 085657271886 Cytote pil telat bulan penggugur kandun...ZurliaSoop
 
Bring back lost lover in USA, Canada ,Uk ,Australia ,London Lost Love Spell C...
Bring back lost lover in USA, Canada ,Uk ,Australia ,London Lost Love Spell C...Bring back lost lover in USA, Canada ,Uk ,Australia ,London Lost Love Spell C...
Bring back lost lover in USA, Canada ,Uk ,Australia ,London Lost Love Spell C...amilabibi1
 
AWS Data Engineer Associate (DEA-C01) Exam Dumps 2024.pdf
AWS Data Engineer Associate (DEA-C01) Exam Dumps 2024.pdfAWS Data Engineer Associate (DEA-C01) Exam Dumps 2024.pdf
AWS Data Engineer Associate (DEA-C01) Exam Dumps 2024.pdfSkillCertProExams
 
My Presentation "In Your Hands" by Halle Bailey
My Presentation "In Your Hands" by Halle BaileyMy Presentation "In Your Hands" by Halle Bailey
My Presentation "In Your Hands" by Halle Baileyhlharris
 
SOLID WASTE MANAGEMENT SYSTEM OF FENI PAURASHAVA, BANGLADESH.pdf
SOLID WASTE MANAGEMENT SYSTEM OF FENI PAURASHAVA, BANGLADESH.pdfSOLID WASTE MANAGEMENT SYSTEM OF FENI PAURASHAVA, BANGLADESH.pdf
SOLID WASTE MANAGEMENT SYSTEM OF FENI PAURASHAVA, BANGLADESH.pdfMahamudul Hasan
 
Report Writing Webinar Training
Report Writing Webinar TrainingReport Writing Webinar Training
Report Writing Webinar TrainingKylaCullinane
 
Dreaming Marissa Sánchez Music Video Treatment
Dreaming Marissa Sánchez Music Video TreatmentDreaming Marissa Sánchez Music Video Treatment
Dreaming Marissa Sánchez Music Video Treatmentnswingard
 

Kürzlich hochgeladen (17)

Proofreading- Basics to Artificial Intelligence Integration - Presentation:Sl...
Proofreading- Basics to Artificial Intelligence Integration - Presentation:Sl...Proofreading- Basics to Artificial Intelligence Integration - Presentation:Sl...
Proofreading- Basics to Artificial Intelligence Integration - Presentation:Sl...
 
Uncommon Grace The Autobiography of Isaac Folorunso
Uncommon Grace The Autobiography of Isaac FolorunsoUncommon Grace The Autobiography of Isaac Folorunso
Uncommon Grace The Autobiography of Isaac Folorunso
 
Introduction to Artificial intelligence.
Introduction to Artificial intelligence.Introduction to Artificial intelligence.
Introduction to Artificial intelligence.
 
Digital collaboration with Microsoft 365 as extension of Drupal
Digital collaboration with Microsoft 365 as extension of DrupalDigital collaboration with Microsoft 365 as extension of Drupal
Digital collaboration with Microsoft 365 as extension of Drupal
 
Dreaming Music Video Treatment _ Project & Portfolio III
Dreaming Music Video Treatment _ Project & Portfolio IIIDreaming Music Video Treatment _ Project & Portfolio III
Dreaming Music Video Treatment _ Project & Portfolio III
 
lONG QUESTION ANSWER PAKISTAN STUDIES10.
lONG QUESTION ANSWER PAKISTAN STUDIES10.lONG QUESTION ANSWER PAKISTAN STUDIES10.
lONG QUESTION ANSWER PAKISTAN STUDIES10.
 
Zone Chairperson Role and Responsibilities New updated.pptx
Zone Chairperson Role and Responsibilities New updated.pptxZone Chairperson Role and Responsibilities New updated.pptx
Zone Chairperson Role and Responsibilities New updated.pptx
 
Unlocking Exploration: Self-Motivated Agents Thrive on Memory-Driven Curiosity
Unlocking Exploration: Self-Motivated Agents Thrive on Memory-Driven CuriosityUnlocking Exploration: Self-Motivated Agents Thrive on Memory-Driven Curiosity
Unlocking Exploration: Self-Motivated Agents Thrive on Memory-Driven Curiosity
 
Jual obat aborsi Jakarta 085657271886 Cytote pil telat bulan penggugur kandun...
Jual obat aborsi Jakarta 085657271886 Cytote pil telat bulan penggugur kandun...Jual obat aborsi Jakarta 085657271886 Cytote pil telat bulan penggugur kandun...
Jual obat aborsi Jakarta 085657271886 Cytote pil telat bulan penggugur kandun...
 
Bring back lost lover in USA, Canada ,Uk ,Australia ,London Lost Love Spell C...
Bring back lost lover in USA, Canada ,Uk ,Australia ,London Lost Love Spell C...Bring back lost lover in USA, Canada ,Uk ,Australia ,London Lost Love Spell C...
Bring back lost lover in USA, Canada ,Uk ,Australia ,London Lost Love Spell C...
 
AWS Data Engineer Associate (DEA-C01) Exam Dumps 2024.pdf
AWS Data Engineer Associate (DEA-C01) Exam Dumps 2024.pdfAWS Data Engineer Associate (DEA-C01) Exam Dumps 2024.pdf
AWS Data Engineer Associate (DEA-C01) Exam Dumps 2024.pdf
 
My Presentation "In Your Hands" by Halle Bailey
My Presentation "In Your Hands" by Halle BaileyMy Presentation "In Your Hands" by Halle Bailey
My Presentation "In Your Hands" by Halle Bailey
 
ICT role in 21st century education and it's challenges.pdf
ICT role in 21st century education and it's challenges.pdfICT role in 21st century education and it's challenges.pdf
ICT role in 21st century education and it's challenges.pdf
 
SOLID WASTE MANAGEMENT SYSTEM OF FENI PAURASHAVA, BANGLADESH.pdf
SOLID WASTE MANAGEMENT SYSTEM OF FENI PAURASHAVA, BANGLADESH.pdfSOLID WASTE MANAGEMENT SYSTEM OF FENI PAURASHAVA, BANGLADESH.pdf
SOLID WASTE MANAGEMENT SYSTEM OF FENI PAURASHAVA, BANGLADESH.pdf
 
Report Writing Webinar Training
Report Writing Webinar TrainingReport Writing Webinar Training
Report Writing Webinar Training
 
Dreaming Marissa Sánchez Music Video Treatment
Dreaming Marissa Sánchez Music Video TreatmentDreaming Marissa Sánchez Music Video Treatment
Dreaming Marissa Sánchez Music Video Treatment
 
in kuwait௹+918133066128....) @abortion pills for sale in Kuwait City
in kuwait௹+918133066128....) @abortion pills for sale in Kuwait Cityin kuwait௹+918133066128....) @abortion pills for sale in Kuwait City
in kuwait௹+918133066128....) @abortion pills for sale in Kuwait City
 

CFO Dashboard Template in Excel

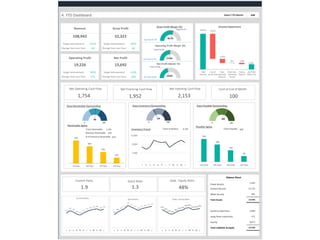
  • 1. 4. YTD Dashboard JUN 101% 105% 0% 9% 109% 112% 17% 20% Fixed Assets 3,262 Current Assets 11,115 Other Assets 561 Total Assets 14,938 Current Liabilities 5,850 Long Term Liabilities 571 Equity 8,517 Total Liabilities & Equity 14,938 Target Achievement Target Achievement Select YTD Month 108,942 32,322 Revenue Gross Profit Change from Last Year Change from Last Year Operating Profit Net Profit 19,226 15,692 Target Achievement Target Achievement Change from Last Year Change from Last Year Balance Sheet Target 28.5% Target 16.3% Gross Profit Margin (%) Operating Profit Margin (%) Net Profit Margin (%) 29.7% 17.6% 14.4% Net Operating Cash Flow 1,754 Net Financing Cash Flow 1,952 Net Investing Cash Flow 2,153 Cash at End of Month 100 Days Receivable Outstanding Days Inventory Outstanding Days Payable Outstanding Receivable Aging Total Receivable Overdue Receivable % of Overdue Receivable 1,350 605 45% 93 64 Inventory Trend 102 Payable Aging Total Payable 600 Current Ratio 1.9 Quick Ratio 1.3 Debt : Equity Ratio 48% 108,942 15,692 855 76,620 13,096 4,389 Total Revenue Cost of Goods Sold Total Operating Expenses Other Non- Operating Income Finance Expense Net Profit Before Tax 540 405 270 135 <30 Days <60 Days <90 Days >90 Days - 4,000 8,000 12,000 J A S O N D J F M A M J 240 180 120 60 <30 Days <60 Days <90 Days >90 Days 1.5 1.8 1.6 1.4 1.3 1.5 1.7 1.8 1.9 2.0 1.8 1.9 J A S O N D J F M A M J Current Ratio 0.8 0.9 1.0 1.1 1.3 1.2 1.1 1.0 1.1 1.2 1.2 1.3 J A S O N D J F M A M J Quick Ratio 45% 40% 35%33% 38% 42%44% 49%50% 45%46%48% J A S O N D J F M A M J Debt : Equity Ratio Income Statement Last Year 27.2% Last Year 15.1% Target 13.0% Last Year 12.0% 0 180 0 180 0 180 Total Inventory 8,765
  • 2. 1. Indicators 1. Indicators 2. Enter Data 1. Indicators 3. Monthly Dashboard Start Month: Start Month: JUL 4. YTD Dashboard Current Year: Current Year: 2019-20 Particular 2. Enter Data 3. Monthly Dashboard 4. YTD Dashboard Month JAN FEB MAR APR MAY JUN JUL AUG SEP OCT NOV DEC TOTAL
  • 3. 1. Indicators 2. Enter Data Monthly Dashboard YTD Dashboard 2. Enter Data MAY JUN 3. Monthly Dashboard ID Indicator Name Actual/Target JUL AUG SEP OCT NOV DEC JAN FEB MAR APR MAY JUN Calculation Type Selected Month YTD 4. YTD Dashboard Actual 9,106 9,081 9,420 9,184 8,644 9,233 9,399 9,421 9,024 9,278 8,591 8,561 Sum 8,591 108,942 Target 8,963 9,089 9,015 8,534 8,519 9,020 9,490 8,753 9,031 9,325 9,128 9,117 Sum 9,128 107,984 Last Year 8,978 9,349 8,855 9,275 9,112 8,508 8,715 9,360 9,055 9,269 9,293 8,907 Sum 9,293 108,676 Actual 6,708 6,374 6,613 6,190 6,101 6,387 6,143 6,955 6,601 6,160 6,213 6,175 Sum 6,213 76,620 Target 6,537 6,837 6,578 6,169 6,609 6,118 6,258 6,114 6,917 6,564 6,158 6,329 Sum 6,158 77,188 Last Year 6,969 6,388 6,949 6,563 6,306 6,215 6,934 6,690 6,618 6,295 6,260 6,920 Sum 6,260 79,107 Actual 2,398 2,707 2,807 2,994 2,543 2,846 3,256 2,466 2,423 3,118 2,378 2,386 Sum 2,378 32,322 Target 2,426 2,252 2,437 2,365 1,910 2,902 3,232 2,639 2,114 2,761 2,970 2,788 Sum 2,970 30,796 Last Year 2,009 2,961 1,906 2,712 2,806 2,293 1,781 2,670 2,437 2,974 3,033 1,987 Sum 3,033 29,569 Actual 1,087 1,188 1,105 1,152 1,058 1,040 1,062 1,042 1,079 1,105 1,178 1,000 Sum 1,178 13,096 Target 1,074 1,131 1,024 1,165 1,018 1,146 1,086 1,053 1,053 1,192 1,059 1,181 Sum 1,059 13,182 Last Year 1,010 1,143 1,169 1,061 1,100 1,009 1,001 1,187 1,131 1,081 1,117 1,150 Sum 1,117 13,159 Actual 1,311 1,519 1,702 1,842 1,485 1,806 2,194 1,424 1,344 2,013 1,200 1,386 Sum 1,200 19,226 Target 1,352 1,121 1,413 1,200 892 1,756 2,146 1,586 1,061 1,569 1,911 1,607 Sum 1,911 17,614 Last Year 999 1,818 737 1,651 1,706 1,284 780 1,483 1,306 1,893 1,916 837 Sum 1,916 16,410 Actual 74 55 57 82 55 74 84 87 53 79 84 71 Sum 84 855 Target 85 64 70 72 82 50 79 88 79 80 61 75 Sum 61 885 Last Year 58 58 59 61 62 82 85 52 87 90 57 74 Sum 57 825 Actual 536 294 348 416 337 345 487 313 221 297 427 370 Sum 427 4,389 Target 160 524 232 471 281 226 298 567 359 410 403 529 Sum 403 4,459 Last Year 367 432 90 509 376 338 376 399 234 252 400 419 Sum 400 4,191 Actual 850 1,280 1,411 1,508 1,203 1,535 1,791 1,199 1,176 1,795 857 1,088 Sum 857 15,692 Target 1,277 661 1,251 802 694 1,580 1,927 1,108 781 1,239 1,569 1,153 Sum 1,569 14,040 Last Year 691 1,444 707 1,203 1,392 1,029 489 1,137 1,159 1,731 1,573 492 Sum 1,573 13,044 Actual 9.3% 14.1% 15.0% 16.4% 13.9% 16.6% 19.1% 12.7% 13.0% 19.3% 10.0% 12.7% 10.0% 14.4% Target 14.2% 7.3% 13.9% 9.4% 8.1% 17.5% 20.3% 12.7% 8.6% 13.3% 17.2% 12.6% 17.2% 13.0% Last Year 7.7% 15.4% 8.0% 13.0% 15.3% 12.1% 5.6% 12.1% 12.8% 18.7% 16.9% 5.5% 16.9% 12.0% Revenue1 2 Cost of Goods Sold 3 Gross Profit 8 Net Profit Before Tax 9 Net Profit Margin % 4 Total Operating Expenses 5 Operating Profit (EBIT) 7 Finance Expense 6 Other Non-Operating Income/(Expense)
  • 4. 1. Indicators 2. Enter Data Monthly Dashboard YTD Dashboard 2. Enter Data MAY JUN 3. Monthly Dashboard ID Indicator Name Actual/Target JUL AUG SEP OCT NOV DEC JAN FEB MAR APR MAY JUN Calculation Type Selected Month YTD 4. YTD Dashboard Actual 9,106 9,081 9,420 9,184 8,644 9,233 9,399 9,421 9,024 9,278 8,591 8,561 Sum 8,591 108,942 10 Net Operating Cash Flow Actual 107 236 -106 179 235 205 239 -254 281 221 279 132 Sum 279 1,754 11 Net Financing Cash Flow Actual 177 135 231 217 124 191 218 155 135 121 131 117 Sum 131 1,952 12 Net Investing Cash Flow Actual 149 101 295 257 188 146 182 141 127 117 208 242 Sum 208 2,153 13 Cash at End of Month Actual 105 100 113 110 107 114 111 103 117 119 121 100 Last Value 121 100 14 Accounts Receivable Actual 1,275 1,305 1,350 1,275 1,350 1,275 1,290 1,350 1,275 1,350 1,275 1,350 Last Value 1,275 1,350 15 Days Receivable Outstanding Actual 81 39 94 53 99 29 58 87 40 110 89 93 Last Value 89 93 16 Overdue Accounts Receivable Actual 511 435 465 586 570 553 622 572 430 642 409 605 Last Value 409 605 17 % of Overdue Receivable Actual 40% 33% 34% 46% 42% 43% 48% 42% 34% 48% 32% 45% 32% 45% 18 Accounts Receivable Aging Actual 19 <30 Days Actual 510 522 540 510 540 510 516 540 510 540 510 540 Last Value 510 540 20 <60 Days Actual 383 392 405 383 405 383 387 405 383 405 383 405 Last Value 383 405 21 <90 Days Actual 255 261 270 255 270 255 258 270 255 270 255 270 Last Value 255 270 22 >90 Days Actual 128 131 135 128 135 128 129 135 128 135 128 135 Last Value 128 135 23 Total Accounts Receivable Actual 1,275 1,305 1,350 1,275 1,350 1,275 1,290 1,350 1,275 1,350 1,275 1,350 Last Value 1,275 1,350 - - - - - - - - - - - - 24 Accounts Payable Actual 800 900 750 1,000 1,200 1,500 900 800 700 600 700 600 Last Value 700 600 25 Days Payable Outstanding Actual 162 57 56 94 92 39 51 60 127 158 145 102 Last Value 145 102 26 Accounts Payable Aging Actual 27 <30 Days Actual 320 360 300 400 480 600 360 320 280 240 280 240 Last Value 280 240 28 <60 Days Actual 240 270 225 300 360 450 270 240 210 180 210 180 Last Value 210 180 29 <90 Days Actual 160 180 150 200 240 300 180 160 140 120 140 120 Last Value 140 120 30 >90 Days Actual 80 90 75 100 120 150 90 80 70 60 70 60 Last Value 70 60 31 Total Accounts Payable Actual 800 900 750 1,000 1,200 1,500 900 800 700 600 700 600 Last Value 700 600 - - - - - - - - - - - - 32 Inventory Actual 6,767 5,678 6,789 9,876 9,090 8,765 9,087 6,543 7,865 8,976 9,876 8,765 Last Value 9,876 8,765 33 Days Inventory Outstanding Actual 30 86 33 79 33 43 68 84 74 61 37 64 Last Value 37 64 34 Current Ratio Actual 1.5 1.8 1.6 1.4 1.3 1.5 1.7 1.8 1.9 2.0 1.8 1.9 Last Value 1.8 1.9 35 Quick Ratio Actual 0.8 0.9 1.0 1.1 1.3 1.2 1.1 1.0 1.1 1.2 1.2 1.3 Last Value 1.2 1.3 36 Debt : Equity Ratio Actual 45% 40% 35% 33% 38% 42% 44% 49% 50% 45% 46% 48% Last Value 46% 48% 37 Fixed Assets Actual 3,251 3,252 3,253 3,254 3,255 3,256 3,257 3,258 3,259 3,260 3,261 3,262 Last Value 3,261 3,262 38 Current Assets Actual 9,042 7,983 9,139 12,151 11,440 11,040 11,377 8,893 10,140 11,326 12,151 11,115 Last Value 12,151 11,115 39 Other Assets Actual 550 551 552 553 554 555 556 557 558 559 560 561 Last Value 560 561 40 Total Assets Actual 12,843 11,786 12,944 15,958 15,249 14,851 15,190 12,708 13,957 15,145 15,972 14,938 Last Value 15,972 14,938 41 Current Liabilities Actual 6,028 4,562 5,712 8,679 8,800 7,360 6,692 4,941 5,337 5,808 6,751 5,850 Last Value 6,751 5,850 42 Long Term Liabilities Actual 503 691 531 573 663 751 832 589 550 706 772 571 Last Value 772 571 43 Equity Actual 6,312 6,533 6,701 6,706 5,786 6,740 7,666 7,178 8,070 8,631 8,449 8,517 Last Value 8,449 8,517 44 Total Liabilities & Equity Actual 12,843 11,786 12,944 15,958 15,249 14,851 15,190 12,708 13,957 15,145 15,972 14,938 Last Value 15,972 14,938 (Accounts Receivable and Total of Receivable Aging must be equal) (Accounts Payable and Total of Payable Aging must be equal) Revenue1
  • 5. 1. Indicators 3. Monthly Dashboard MAY 2. Enter Data 3. Monthly Dashboard 4. YTD Dashboard 94% 80% -8% -22% 63% 55% -37% -46% Fixed Assets 3,261 Current Assets 12,151 Other Assets 560 Total Assets 15,972 Current Liabilities 6,751 Long Term Liabilities 772 Equity 8,449 Total Liabilities & Equity 15,972 Balance Sheet 8,591 2,378 Operating Profit 1,200 Net Profit 857 Target Achievement Change from Last Year Target Achievement Target Achievement Change from Last Year Change from Last Year Select Month Target Achievement Change from Last Year Gross ProfitRevenue Target 17.2% Target 20.9% Target 32.5% 8,591 857 6,213 1,178 427 Total Revenue Cost of Goods Sold Total Operating Expenses Other Non- Operating Income Finance Expense Net Profit Before Tax Gross Profit Margin (%) Operating Profit Margin (%) Net Profit Margin (%) 27.7% 14.0% 10.0% Net Operating Cash Flow 279 Net Financing Cash Flow 131 Net Investing Cash Flow 208 Cash at End of Month 121 Days Receivable Outstanding Days Inventory Outstanding Days Payable Outstanding 510 383 255 128 <30 Days <60 Days <90 Days >90 Days Receivable Aging Total Receivable Overdue Receivable % of Overdue Receivable 1,275 409 32% 89 37 - 4,000 8,000 12,000 J A S O N D J F M A M Inventory Trend 145 280 210 140 70 <30 Days <60 Days <90 Days >90 Days Payable Aging Total Payable 700 Current Ratio 1.8 Quick Ratio 1.2 Debt : Equity Ratio 46% 1.5 1.8 1.6 1.4 1.3 1.5 1.7 1.8 1.9 2.0 1.8 J A S O N D J F M A M Current Ratio 0.8 0.9 1.0 1.1 1.3 1.2 1.1 1.0 1.1 1.2 1.2 J A S O N D J F M A M Quick Ratio 45% 40% 35% 33% 38% 42% 44% 49% 50% 45% 46% J A S O N D J F M A M Debt : Equity Ratio Income Statement Last Year 32.6% Last Year20.6% Last Year 16.9% 0 180 0 180 0 180 Total Inventory 9,876 84
  • 6. 1. Indicators 4. YTD Dashboard JUN 2. Enter Data 3. Monthly Dashboard 4. YTD Dashboard 101% 105% 0% 9% 109% 112% 17% 20% Fixed Assets 3,262 Current Assets 11,115 Other Assets 561 Total Assets 14,938 Current Liabilities 5,850 Long Term Liabilities 571 Equity 8,517 Total Liabilities & Equity 14,938 Target Achievement Target Achievement Select YTD Month 108,942 32,322 Revenue Gross Profit Change from Last Year Change from Last Year Operating Profit Net Profit 19,226 15,692 Target Achievement Target Achievement Change from Last Year Change from Last Year Balance Sheet Target 28.5% Target 16.3% Gross Profit Margin (%) Operating Profit Margin (%) Net Profit Margin (%) 29.7% 17.6% 14.4% Net Operating Cash Flow 1,754 Net Financing Cash Flow 1,952 Net Investing Cash Flow 2,153 Cash at End of Month 100 Days Receivable Outstanding Days Inventory Outstanding Days Payable Outstanding Receivable Aging Total Receivable Overdue Receivable % of Overdue Receivable 1,350 605 45% 93 64 Inventory Trend 102 Payable Aging Total Payable 600 Current Ratio 1.9 Quick Ratio 1.3 Debt : Equity Ratio 48% 108,942 15,692 76,620 13,096 4,389 Total Revenue Cost of Goods Sold Total Operating Expenses Other Non- Operating Income Finance Expense Net Profit Before Tax 540 405 270 135 <30 Days <60 Days <90 Days >90 Days - 4,000 8,000 12,000 J A S O N D J F M A M J 240 180 120 60 <30 Days <60 Days <90 Days >90 Days 1.5 1.8 1.6 1.4 1.3 1.5 1.7 1.8 1.9 2.0 1.8 1.9 J A S O N D J F M A M J Current Ratio 0.8 0.9 1.0 1.1 1.3 1.2 1.1 1.0 1.1 1.2 1.2 1.3 J A S O N D J F M A M J Quick Ratio 45% 40% 35%33% 38% 42%44% 49%50% 45%46%48% J A S O N D J F M A M J Debt : Equity Ratio Income Statement Last Year 27.2% Last Year15.1% Target 13.0% Last Year 12.0% 0 180 0 180 0 180 Total Inventory 8,765 855