SlideShare ist ein Scribd-Unternehmen logo
1 von 5
4. YTD Dashboard JUN
101%
1%
108%
6%
110%
8%
114%
9%Change Over Last Year
Gross Profit
31,020
Target Achievement
Change Over Last Year
Operating Profit
17,513
Target Achievement
Change Over Last Year
Net Profit
13,968
Target Achievement
Change Over Last Year
Select YTD Month
Sales Sales (Amount) by Product/Category
108,325
Target Achievement
56
70
Male Female
Monthly Sales Growth
Actual Sales vs Target
Income Statement Net Operating Cash Flow
Employee Cost vs Sales Headcount
126
Change vsLast Year 1%
Days Receivable Outstanding
93
Receivable Aging
Total Receivable
1,350
Days Inventory Outstanding
64
Inventory Trend
9,297
8,600
9,429
8,200
9,047
8,968
9,178
8,681
9,211
9,409
8,916
9,389
-
2,000
4,000
6,000
8,000
10,000
12,000
JUL AUG SEP OCT NOV DEC JAN FEB MAR APR MAY JUN
Actual >=100% of Target Actual <100% and >=90% of Target Actual <90% ofTarget Target
37,914
27,081
21,665
16,249
5,416
0
5,000
10,000
15,000
20,000
25,000
30,000
35,000
40,000
45,000
Product 1 Product 2 Product 3 Product 4 Product 5
Above Target Below Target Target
108,325
13,968
844
77,305
13,507
4,389
Total
Revenue
Cost of
Goods Sold
Total
Operating
Expenses
Other Non-
Operating
Income
Finance
Expense
Net Profit
Before Tax
107
236
-106
179
235
205
239
-254
281
221
279
132
JUL
AUG
SEP
OCT
NOV
DEC
JAN
FEB
MAR
APR
MAY
JUN
5.0%
-7.5%
9.6%
-13.0%
10.3%
-0.9%
2.3%
-5.4%
6.1%
2.1%
-5.2%
5.3%
JUL
AUG
SEP
OCT
NOV
DEC
JAN
FEB
MAR
APR
MAY
JUN
5.5%
6.2% 6.2%
7.2%
6.4%
6.0%
6.5% 6.3%
5.9%
6.4%
6.1% 6.3%
0.0%
1.0%
2.0%
3.0%
4.0%
5.0%
6.0%
7.0%
8.0%
0
2,000
4,000
6,000
8,000
10,000
JUL AUG SEP OCT NOV DEC JAN FEB MAR APR MAY JUN
Sales EmployeeCost EmployeeCost %
540
405
270
135
<30 Days <60 Days <90 Days >90 Days
-
5,000
10,000
15,000
J A S O N D J F M A M J
0 1800 180
1. Indicators
1. Indicators
2. Enter Data Indicators Fiscal Year Start Month JUL
3. Monthly Dashboard 1. Fiscal Year Start Month: Fiscal Year 2019-20
4. YTD Dashboard JAN
FEB
MAR Value is >= 100% 100%
APR value is < 100% and >= 90% 90%
MAY Value is < 90% 90%
JUN
JUL
AUG
SEP
OCT
NOV
DEC
Sales
Total
Target
% of Target
Difference
2. Enter Data
Particular
3. Monthly Dashboard
4. YTD Dashboard
Choose the target rules
1. Indicators 2. Enter Data Monthly Dashboard YTD Dashboard
2. Enter Data MAY JUN
3. Monthly Dashboard Indicator Name Actual/Target JUL AUG SEP OCT NOV DEC JAN FEB MAR APR MAY JUN Calculation Type Selected Month YTD
4. YTD Dashboard Actual 9,297 8,600 9,429 8,200 9,047 8,968 9,178 8,681 9,211 9,409 8,916 9,389 Sum 8,916 108,325
Sales Growth 5% -7% 10% -13% 10% -1% 2% -5% 6% 2% -5% 5%
Target 8,968 8,894 9,382 9,163 8,811 8,662 8,705 9,171 8,617 9,355 9,444 8,506 Sum 9,444 107,678
Last Year 8,832 9,068 8,712 8,910 9,404 8,587 8,637 8,671 9,102 8,769 9,007 9,071 Sum 9,007 106,770
Sales by Product:
Actual 3,254 3,010 3,300 2,870 3,166 3,139 3,212 3,038 3,224 3,293 3,121 3,286 Sum 3,121 37,914
Target 3,139 3,113 3,284 3,207 3,084 3,032 3,047 3,210 3,016 3,274 3,305 2,977 Sum 3,305 37,687
Actual 2,324 2,150 2,357 2,050 2,262 2,242 2,295 2,170 2,303 2,352 2,229 2,347 Sum 2,229 27,081
Target 2,063 2,046 2,158 2,107 2,027 1,992 2,002 2,109 1,982 2,152 2,172 1,956 Sum 2,172 24,766
Actual 1,859 1,720 1,886 1,640 1,809 1,794 1,836 1,736 1,842 1,882 1,783 1,878 Sum 1,783 21,665
Target 1,525 1,512 1,595 1,558 1,498 1,473 1,480 1,559 1,465 1,590 1,605 1,446 Sum 1,605 18,305
Actual 1,395 1,290 1,414 1,230 1,357 1,345 1,377 1,302 1,382 1,411 1,337 1,408 Sum 1,337 16,249
Target 1,614 1,601 1,689 1,649 1,586 1,559 1,567 1,651 1,551 1,684 1,700 1,531 Sum 1,700 19,382
Actual 465 430 471 410 452 448 459 434 461 470 446 469 Sum 446 5,416
Target 628 623 657 641 617 606 609 642 603 655 661 595 Sum 661 7,537
Actual 9,297 8,600 9,429 8,200 9,047 8,968 9,178 8,681 9,211 9,409 8,916 9,389 Sum 8,916 108,325
Target 8,968 8,894 9,382 9,163 8,811 8,662 8,705 9,171 8,617 9,355 9,444 8,506 Sum 9,444 107,678
Actual - - - - - - - - - - - -
Target - - - - - - - - - - - -
Actual 6,452 6,898 6,106 6,378 6,747 6,121 6,602 6,033 6,448 6,273 6,419 6,828 Sum 6,419 77,305
Target 6,780 6,149 6,158 6,512 6,896 6,683 6,513 6,369 6,792 6,436 6,738 6,808 Sum 6,738 78,834
Last Year 6,654 6,340 6,325 6,680 6,065 6,265 6,082 6,777 6,938 6,575 6,463 6,352 Sum 6,463 77,516
Actual 2,845 1,702 3,323 1,822 2,300 2,847 2,576 2,648 2,763 3,136 2,497 2,561 Sum 2,497 31,020
Target 2,188 2,745 3,224 2,651 1,915 1,979 2,192 2,802 1,825 2,919 2,706 1,698 Sum 2,706 28,844
Last Year 2,178 2,728 2,387 2,230 3,339 2,322 2,555 1,894 2,164 2,194 2,544 2,719 Sum 2,544 29,254
Actual 1,023 1,061 1,170 1,181 1,166 1,078 1,188 1,100 1,078 1,199 1,085 1,178 Sum 1,085 13,507
Target 1,039 1,158 1,052 1,157 1,023 1,006 1,106 1,002 1,130 1,174 1,050 1,065 Sum 1,050 12,962
Last Year 1,118 1,120 1,003 1,048 1,023 1,014 1,107 1,061 1,176 1,196 1,004 1,183 Sum 1,004 13,053
Actual 1,822 641 2,153 641 1,134 1,769 1,388 1,548 1,685 1,937 1,412 1,383 Sum 1,412 17,513
Target 1,149 1,587 2,172 1,494 892 973 1,086 1,800 695 1,745 1,656 633 Sum 1,656 15,882
Last Year 1,060 1,608 1,384 1,182 2,316 1,308 1,448 833 988 998 1,540 1,536 Sum 1,540 16,201
Actual 71 89 50 61 66 88 76 74 76 74 54 65 Sum 54 844
Target 70 69 73 76 88 53 59 50 59 57 90 87 Sum 90 831
Last Year 89 79 61 55 55 80 85 69 58 84 62 52 Sum 62 829
Actual 536 294 348 416 337 345 487 313 221 297 427 370 Sum 427 4,389
Target 160 524 232 471 281 226 298 567 359 410 403 529 Sum 403 4,459
Last Year 367 432 90 509 376 338 376 399 234 252 400 419 Sum 400 4,191
Actual 1,358 436 1,855 286 863 1,512 977 1,310 1,540 1,714 1,039 1,079 Sum 1,039 13,968
Target 1,059 1,132 2,013 1,100 700 800 847 1,284 395 1,392 1,343 191 Sum 1,343 12,254
Last Year 783 1,255 1,356 728 1,995 1,051 1,157 504 812 830 1,202 1,169 Sum 1,202 12,839
Actual 14.6% 5.1% 19.7% 3.5% 9.5% 16.9% 10.6% 15.1% 16.7% 18.2% 11.7% 11.5% 11.7% 12.9%
Target 11.8% 12.7% 21.5% 12.0% 7.9% 9.2% 9.7% 14.0% 4.6% 14.9% 14.2% 2.2% 14.2% 11.4%
Last Year 8.9% 13.8% 15.6% 8.2% 21.2% 12.2% 13.4% 5.8% 8.9% 9.5% 13.3% 12.9% 13.3% 12.0%
Employee Cost Actual 512 531 585 591 583 539 594 550 539 600 543 589 Sum 543 6,754
Male 56 55 54 54 54 54 57 59 58 57 57 56 Last Value 57 56
Female 75 74 76 75 78 77 75 74 73 71 70 70 Last Value 70 70
Actual Total 131 129 130 129 132 131 132 133 131 128 127 126 Last Value 127 126
Last Year Total 131 126 135 132 127 130 135 125 125 134 130 125 Last Value 130 125
17 Net Operating Cash Flow Actual 107 236 -106 179 235 205 239 -254 281 221 279 132 Sum 279 1,754
18 Net Financing Cash Flow Actual 177 135 231 217 124 191 218 155 135 121 131 117 Sum 131 1,952
19 Net Investing Cash Flow Actual 149 101 295 257 188 146 182 141 127 117 208 242 Sum 208 2,153
20 Cash at End of Month Actual 105 106 102 107 112 113 113 102 104 122 107 104 Last Value 107 104
21 Accounts Receivable Actual 1,275 1,305 1,350 1,275 1,350 1,275 1,290 1,350 1,275 1,350 1,275 1,350 Last Value 1,275 1,350
22 Days Receivable Outstanding Actual 81 39 94 53 99 29 58 87 40 110 89 93 Last Value 89 93
23 Overdue Accounts Receivable Actual 511 435 465 586 570 553 622 572 430 642 409 605 Last Value 409 605
24 % of Overdue Receivable Actual 40% 33% 34% 46% 42% 43% 48% 42% 34% 48% 32% 45% 32% 45%
25 Accounts Receivable Aging Actual
26 <30 Days Actual 510 522 540 510 540 510 516 540 510 540 510 540 Last Value 510 540
27 <60 Days Actual 383 392 405 383 405 383 387 405 383 405 383 405 Last Value 383 405
28 <90 Days Actual 255 261 270 255 270 255 258 270 255 270 255 270 Last Value 255 270
29 >90 Days Actual 128 131 135 128 135 128 129 135 128 135 128 135 Last Value 128 135
30 Total Accounts Receivable Actual 1,275 1,305 1,350 1,275 1,350 1,275 1,290 1,350 1,275 1,350 1,275 1,350 Last Value 1,275 1,350
(Total of Receivable Aging must be
equal to Total Accounts Receivable)
- - - - - - - - - - - -
31 Inventory Actual 6,767 5,678 6,789 9,876 9,090 8,765 9,087 6,543 7,865 8,976 9,876 8,765 Last Value 9,876 8,765
32 Days Inventory Outstanding Actual 30 86 33 79 33 43 68 84 74 61 37 64 Last Value 37 64
11 Operating Profit (EBIT)
12
Other Non-Operating
Income/(Expense)
Headcount
13 Finance Expense
14 Net Profit Before Tax
15 Net Profit Margin %
16
6
7
(Total Sales by Product and Total
Sales must be equal)
10 Total Operating Expenses
1 Total Revenue
8 Cost of Goods Sold
9 Gross Profit
Product 1
Product 2
Product 3
Product 4
Product 5
Total Sales by Product
2
3
4
5
1. Indicators 3. Monthly Dashboard MAY
2. Enter Data
3. Monthly Dashboard
4. YTD Dashboard
94%
-1%
92%
-2%
85%
-8%
77%
-14%
Net Profit
Change Over Last Year
Target Achievement
Change Over Last Year
Select Month
8,916
2,497
1,412
1,039
Target Achievement
Change Over Last Year
Target Achievement
Change Over Last Year
Target Achievement
Sales (Amount) by Product/CategorySales
Gross Profit
Operating Profit
5.0%
-7.5%
9.6%
-13.0%
10.3%
-0.9%
2.3%
-5.4%
6.1%
2.1%
-5.2%
JUL
AUG
SEP
OCT
NOV
DEC
JAN
FEB
MAR
APR
MAY
Monthly Sales Growth
Actual Sales vs Target
9,297
8,600
9,429
8,200
9,047
8,968
9,178
8,681
9,211
9,409
8,916
-
2,000
4,000
6,000
8,000
10,000
12,000
JUL AUG SEP OCT NOV DEC JAN FEB MAR APR MAY
Actual >=100% of Target Actual <100% and >=90% of Target Actual <90% of Target Target
3,121
2,229
1,783
1,337
446
0
1,000
2,000
3,000
4,000
Product 1 Product 2 Product 3 Product 4 Product 5
Above Target Below Target Target
8,916
1,039
6,419
1,085
427
Total
Revenue
Cost of Goods
Sold
Total
Operating
Expenses
Non-Opr.
Income
(Expense)
Finance
Expense
Net Profit
Before Tax
Income Statement Net Operating Cash Flow
107
236
-106
179
235
205
239
-254
281
221
279
Employee Cost vs Sales Headcount
57
70
Male Female
127
Change vsLast Year -2%
Days Receivable Outstanding
89
510
383
255
128
<30 Days <60 Days <90 Days >90 Days
Receivable Aging
Total Receivable
1,275
Days Inventory Outstanding
37
-
5,000
10,000
15,000
J A S O N D J F M A M
5.5%
6.2% 6.2%
7.2%
6.4%
6.0%
6.5% 6.3%
5.9%
6.4%
6.1%
0.0%
1.0%
2.0%
3.0%
4.0%
5.0%
6.0%
7.0%
8.0%
0
2,000
4,000
6,000
8,000
10,000
JUL AUG SEP OCT NOV DEC JAN FEB MAR APR MAY
Sales EmployeeCost EmployeeCost %
0 1800 180
Inventory Trend
54
1. Indicators 4. YTD Dashboard JUN
2. Enter Data
3. Monthly Dashboard
4. YTD Dashboard
101%
1%
108%
6%
110%
8%
114%
9%Change Over Last Year
Gross Profit
31,020
Target Achievement
Change Over Last Year
Operating Profit
17,513
Target Achievement
Change Over Last Year
Net Profit
13,968
Target Achievement
Change Over Last Year
Select YTD Month
Sales Sales (Amount) by Product/Category
108,325
Target Achievement
56
70
Male Female
Monthly Sales Growth
Actual Sales vs Target
Income Statement Net Operating Cash Flow
Employee Cost vs Sales Headcount
126
Change vsLast Year 1%
Days Receivable Outstanding
93
Receivable Aging
Total Receivable
1,350
Days Inventory Outstanding
64
Inventory Trend
9,297
8,600
9,429
8,200
9,047
8,968
9,178
8,681
9,211
9,409
8,916
9,389
-
2,000
4,000
6,000
8,000
10,000
12,000
JUL AUG SEP OCT NOV DEC JAN FEB MAR APR MAY JUN
Actual >=100% of Target Actual <100% and >=90% of Target Actual <90% ofTarget Target
37,914
27,081
21,665
16,249
5,416
0
5,000
10,000
15,000
20,000
25,000
30,000
35,000
40,000
45,000
Product 1 Product 2 Product 3 Product 4 Product 5
Above Target Below Target Target
108,325
13,968
77,305
13,507
4,389
Total
Revenue
Cost of Goods
Sold
Total
Operating
Expenses
Non-Opr.
Income
(Expense)
Finance
Expense
Net Profit
Before Tax
107
236
-106
179
235
205
239
-254
281
221
279
132
JUL
AUG
SEP
OCT
NOV
DEC
JAN
FEB
MAR
APR
MAY
JUN
5.0%
-7.5%
9.6%
-13.0%
10.3%
-0.9%
2.3%
-5.4%
6.1%
2.1%
-5.2%
5.3%
JUL
AUG
SEP
OCT
NOV
DEC
JAN
FEB
MAR
APR
MAY
JUN
5.5%
6.2% 6.2%
7.2%
6.4%
6.0%
6.5% 6.3%
5.9%
6.4%
6.1% 6.3%
0.0%
1.0%
2.0%
3.0%
4.0%
5.0%
6.0%
7.0%
8.0%
0
2,000
4,000
6,000
8,000
10,000
JUL AUG SEP OCT NOV DEC JAN FEB MAR APR MAY JUN
Sales EmployeeCost EmployeeCost %
540
405
270
135
<30 Days <60 Days <90 Days >90 Days
-
5,000
10,000
15,000
J A S O N D J F M A M J
0 1800 180
844

Weitere ähnliche Inhalte

Was ist angesagt?

Workplace Digital Transformation PowerPoint Presentation Slides
Workplace Digital Transformation PowerPoint Presentation Slides Workplace Digital Transformation PowerPoint Presentation Slides
Workplace Digital Transformation PowerPoint Presentation Slides SlideTeam
 
TrueView Delivering a data-driven customer experience
TrueView Delivering a data-driven customer experience TrueView Delivering a data-driven customer experience
TrueView Delivering a data-driven customer experience Deloitte United States
 
2017 holiday survey: An annual analysis of the peak shopping season
2017 holiday survey: An annual analysis of the peak shopping season2017 holiday survey: An annual analysis of the peak shopping season
2017 holiday survey: An annual analysis of the peak shopping seasonDeloitte United States
 
Pitch Deck Teardown: Scalestack's $1M AI sales tech Seed deck
Pitch Deck Teardown: Scalestack's $1M AI sales tech Seed deckPitch Deck Teardown: Scalestack's $1M AI sales tech Seed deck
Pitch Deck Teardown: Scalestack's $1M AI sales tech Seed deckHajeJanKamps
 
2017 china internet report bcg
2017 china internet report bcg2017 china internet report bcg
2017 china internet report bcgGaudefroy Ariane
 
Lifting the Barriers to Retail Innovation in ASEAN | A.T. Kearney
Lifting the Barriers to Retail Innovation in ASEAN | A.T. KearneyLifting the Barriers to Retail Innovation in ASEAN | A.T. Kearney
Lifting the Barriers to Retail Innovation in ASEAN | A.T. KearneyKearney
 
A.T. Kearney 2017 State of Logistics Report: Accelerating into Uncertainty
A.T. Kearney 2017 State of Logistics Report: Accelerating into UncertaintyA.T. Kearney 2017 State of Logistics Report: Accelerating into Uncertainty
A.T. Kearney 2017 State of Logistics Report: Accelerating into UncertaintyKearney
 
BCG-Executive-Perspectives-CEOs-Dilemma-Supply-Chain-Resilience.pdf
BCG-Executive-Perspectives-CEOs-Dilemma-Supply-Chain-Resilience.pdfBCG-Executive-Perspectives-CEOs-Dilemma-Supply-Chain-Resilience.pdf
BCG-Executive-Perspectives-CEOs-Dilemma-Supply-Chain-Resilience.pdfRobertoChiesa6
 
Monthly Review Powerpoint Presentation Slides
Monthly Review Powerpoint Presentation SlidesMonthly Review Powerpoint Presentation Slides
Monthly Review Powerpoint Presentation SlidesSlideTeam
 
CTG-Cap nhat ket qua KD quy 2.2023_EN_Final.pptx
CTG-Cap nhat ket qua KD quy 2.2023_EN_Final.pptxCTG-Cap nhat ket qua KD quy 2.2023_EN_Final.pptx
CTG-Cap nhat ket qua KD quy 2.2023_EN_Final.pptxngothithungan1
 
Putting digital technology and data to work for Tech CMO's
Putting digital technology and data to work for Tech CMO'sPutting digital technology and data to work for Tech CMO's
Putting digital technology and data to work for Tech CMO'sPwC
 
Financial Projection PowerPoint Presentation Slides
Financial Projection PowerPoint Presentation Slides Financial Projection PowerPoint Presentation Slides
Financial Projection PowerPoint Presentation Slides SlideTeam
 
Mckinsey presentation template
Mckinsey presentation templateMckinsey presentation template
Mckinsey presentation templatetriphos
 
Australia: Taking Bigger Steps | A.T. Kearney
Australia: Taking Bigger Steps | A.T. KearneyAustralia: Taking Bigger Steps | A.T. Kearney
Australia: Taking Bigger Steps | A.T. KearneyKearney
 
PwC Trends in the workforce
PwC Trends in the workforcePwC Trends in the workforce
PwC Trends in the workforcePwC
 
Federal Technology Vision 2021: Full U.S. Federal Survey Findings | Accenture
Federal Technology Vision 2021: Full U.S. Federal Survey Findings | AccentureFederal Technology Vision 2021: Full U.S. Federal Survey Findings | Accenture
Federal Technology Vision 2021: Full U.S. Federal Survey Findings | Accentureaccenture
 
Sequoia Capital on startups and the economic downturn
Sequoia Capital on startups and the economic downturnSequoia Capital on startups and the economic downturn
Sequoia Capital on startups and the economic downturnEric Eldon
 
Pitch Deck Teardown: Ageras's $36M Private Equity deck
Pitch Deck Teardown: Ageras's $36M Private Equity deckPitch Deck Teardown: Ageras's $36M Private Equity deck
Pitch Deck Teardown: Ageras's $36M Private Equity deckHajeJanKamps
 

Was ist angesagt? (20)

Workplace Digital Transformation PowerPoint Presentation Slides
Workplace Digital Transformation PowerPoint Presentation Slides Workplace Digital Transformation PowerPoint Presentation Slides
Workplace Digital Transformation PowerPoint Presentation Slides
 
TrueView Delivering a data-driven customer experience
TrueView Delivering a data-driven customer experience TrueView Delivering a data-driven customer experience
TrueView Delivering a data-driven customer experience
 
2017 holiday survey: An annual analysis of the peak shopping season
2017 holiday survey: An annual analysis of the peak shopping season2017 holiday survey: An annual analysis of the peak shopping season
2017 holiday survey: An annual analysis of the peak shopping season
 
The Hierarchy of Engagement
The Hierarchy of EngagementThe Hierarchy of Engagement
The Hierarchy of Engagement
 
Pitch Deck Teardown: Scalestack's $1M AI sales tech Seed deck
Pitch Deck Teardown: Scalestack's $1M AI sales tech Seed deckPitch Deck Teardown: Scalestack's $1M AI sales tech Seed deck
Pitch Deck Teardown: Scalestack's $1M AI sales tech Seed deck
 
2017 china internet report bcg
2017 china internet report bcg2017 china internet report bcg
2017 china internet report bcg
 
State of the Cloud 2022
State of the Cloud 2022State of the Cloud 2022
State of the Cloud 2022
 
Lifting the Barriers to Retail Innovation in ASEAN | A.T. Kearney
Lifting the Barriers to Retail Innovation in ASEAN | A.T. KearneyLifting the Barriers to Retail Innovation in ASEAN | A.T. Kearney
Lifting the Barriers to Retail Innovation in ASEAN | A.T. Kearney
 
A.T. Kearney 2017 State of Logistics Report: Accelerating into Uncertainty
A.T. Kearney 2017 State of Logistics Report: Accelerating into UncertaintyA.T. Kearney 2017 State of Logistics Report: Accelerating into Uncertainty
A.T. Kearney 2017 State of Logistics Report: Accelerating into Uncertainty
 
BCG-Executive-Perspectives-CEOs-Dilemma-Supply-Chain-Resilience.pdf
BCG-Executive-Perspectives-CEOs-Dilemma-Supply-Chain-Resilience.pdfBCG-Executive-Perspectives-CEOs-Dilemma-Supply-Chain-Resilience.pdf
BCG-Executive-Perspectives-CEOs-Dilemma-Supply-Chain-Resilience.pdf
 
Monthly Review Powerpoint Presentation Slides
Monthly Review Powerpoint Presentation SlidesMonthly Review Powerpoint Presentation Slides
Monthly Review Powerpoint Presentation Slides
 
CTG-Cap nhat ket qua KD quy 2.2023_EN_Final.pptx
CTG-Cap nhat ket qua KD quy 2.2023_EN_Final.pptxCTG-Cap nhat ket qua KD quy 2.2023_EN_Final.pptx
CTG-Cap nhat ket qua KD quy 2.2023_EN_Final.pptx
 
Putting digital technology and data to work for Tech CMO's
Putting digital technology and data to work for Tech CMO'sPutting digital technology and data to work for Tech CMO's
Putting digital technology and data to work for Tech CMO's
 
Financial Projection PowerPoint Presentation Slides
Financial Projection PowerPoint Presentation Slides Financial Projection PowerPoint Presentation Slides
Financial Projection PowerPoint Presentation Slides
 
Mckinsey presentation template
Mckinsey presentation templateMckinsey presentation template
Mckinsey presentation template
 
Australia: Taking Bigger Steps | A.T. Kearney
Australia: Taking Bigger Steps | A.T. KearneyAustralia: Taking Bigger Steps | A.T. Kearney
Australia: Taking Bigger Steps | A.T. Kearney
 
PwC Trends in the workforce
PwC Trends in the workforcePwC Trends in the workforce
PwC Trends in the workforce
 
Federal Technology Vision 2021: Full U.S. Federal Survey Findings | Accenture
Federal Technology Vision 2021: Full U.S. Federal Survey Findings | AccentureFederal Technology Vision 2021: Full U.S. Federal Survey Findings | Accenture
Federal Technology Vision 2021: Full U.S. Federal Survey Findings | Accenture
 
Sequoia Capital on startups and the economic downturn
Sequoia Capital on startups and the economic downturnSequoia Capital on startups and the economic downturn
Sequoia Capital on startups and the economic downturn
 
Pitch Deck Teardown: Ageras's $36M Private Equity deck
Pitch Deck Teardown: Ageras's $36M Private Equity deckPitch Deck Teardown: Ageras's $36M Private Equity deck
Pitch Deck Teardown: Ageras's $36M Private Equity deck
 

Ähnlich wie CEO Dashboard Template in Excel

GuessBox Financial Model 2017
GuessBox Financial Model 2017GuessBox Financial Model 2017
GuessBox Financial Model 2017GuessBox
 
Spdr debunking-5-common-gold-misconceptions
Spdr debunking-5-common-gold-misconceptionsSpdr debunking-5-common-gold-misconceptions
Spdr debunking-5-common-gold-misconceptionsZewoMaluk
 
Budgeting And Forecasting In Accounting PowerPoint Presentation Slides
Budgeting And Forecasting In Accounting PowerPoint Presentation SlidesBudgeting And Forecasting In Accounting PowerPoint Presentation Slides
Budgeting And Forecasting In Accounting PowerPoint Presentation SlidesSlideTeam
 
TREB MARKET WATCH NOVEMBER 2018 REPORT
TREB MARKET WATCH NOVEMBER 2018 REPORTTREB MARKET WATCH NOVEMBER 2018 REPORT
TREB MARKET WATCH NOVEMBER 2018 REPORTShawn Venasse
 
Financial Ratio Analysis PowerPoint Presentation Slides
Financial Ratio Analysis PowerPoint Presentation SlidesFinancial Ratio Analysis PowerPoint Presentation Slides
Financial Ratio Analysis PowerPoint Presentation SlidesSlideTeam
 
TREB Market Watch for May 2016
TREB Market Watch for May 2016TREB Market Watch for May 2016
TREB Market Watch for May 2016Michelle Makos
 
Market Watch May 2016
Market Watch May 2016Market Watch May 2016
Market Watch May 2016Chaba Tamasi
 
Horniman Horticulture, FIL 349 ( Advanced Financial Theory and Problems)
Horniman Horticulture, FIL 349 ( Advanced Financial Theory and Problems)Horniman Horticulture, FIL 349 ( Advanced Financial Theory and Problems)
Horniman Horticulture, FIL 349 ( Advanced Financial Theory and Problems)CameronMcintosh8
 
Market Watch TORONTO 2015 OCTOBER
Market Watch TORONTO 2015 OCTOBERMarket Watch TORONTO 2015 OCTOBER
Market Watch TORONTO 2015 OCTOBERChaba Tamasi
 
Valuation Of Maruti Suzuki
Valuation Of Maruti SuzukiValuation Of Maruti Suzuki
Valuation Of Maruti SuzukiAakash Singh
 
Valuation Of Maruti Suzuki
Valuation Of Maruti SuzukiValuation Of Maruti Suzuki
Valuation Of Maruti SuzukiAakash Singh
 
Current Years Estimation PowerPoint Presentation Slides
Current Years Estimation PowerPoint Presentation SlidesCurrent Years Estimation PowerPoint Presentation Slides
Current Years Estimation PowerPoint Presentation SlidesSlideTeam
 
Commercial Due Diligence Process PowerPoint Presentation Slides
Commercial Due Diligence Process PowerPoint Presentation SlidesCommercial Due Diligence Process PowerPoint Presentation Slides
Commercial Due Diligence Process PowerPoint Presentation SlidesSlideTeam
 
Market Report for August 2017 - Residential Resale
Market Report for August 2017 - Residential ResaleMarket Report for August 2017 - Residential Resale
Market Report for August 2017 - Residential ResaleMichelle Makos
 
Market Watch TORONTO 2015 SEPTEMBER
Market Watch TORONTO 2015 SEPTEMBERMarket Watch TORONTO 2015 SEPTEMBER
Market Watch TORONTO 2015 SEPTEMBERChaba Tamasi
 

Ähnlich wie CEO Dashboard Template in Excel (20)

Finance Dashboard Template in Excel
Finance Dashboard Template in ExcelFinance Dashboard Template in Excel
Finance Dashboard Template in Excel
 
CFO Dashboard Template in Excel
CFO Dashboard Template in ExcelCFO Dashboard Template in Excel
CFO Dashboard Template in Excel
 
MF
MFMF
MF
 
GuessBox Financial Model 2017
GuessBox Financial Model 2017GuessBox Financial Model 2017
GuessBox Financial Model 2017
 
Spdr debunking-5-common-gold-misconceptions
Spdr debunking-5-common-gold-misconceptionsSpdr debunking-5-common-gold-misconceptions
Spdr debunking-5-common-gold-misconceptions
 
Budgeting And Forecasting In Accounting PowerPoint Presentation Slides
Budgeting And Forecasting In Accounting PowerPoint Presentation SlidesBudgeting And Forecasting In Accounting PowerPoint Presentation Slides
Budgeting And Forecasting In Accounting PowerPoint Presentation Slides
 
120981064 new-doll
120981064 new-doll120981064 new-doll
120981064 new-doll
 
Cash Flow Dashboard in Excel
Cash Flow Dashboard in ExcelCash Flow Dashboard in Excel
Cash Flow Dashboard in Excel
 
TREB MARKET WATCH NOVEMBER 2018 REPORT
TREB MARKET WATCH NOVEMBER 2018 REPORTTREB MARKET WATCH NOVEMBER 2018 REPORT
TREB MARKET WATCH NOVEMBER 2018 REPORT
 
Financial Ratio Analysis PowerPoint Presentation Slides
Financial Ratio Analysis PowerPoint Presentation SlidesFinancial Ratio Analysis PowerPoint Presentation Slides
Financial Ratio Analysis PowerPoint Presentation Slides
 
TREB Market Watch for May 2016
TREB Market Watch for May 2016TREB Market Watch for May 2016
TREB Market Watch for May 2016
 
Market Watch May 2016
Market Watch May 2016Market Watch May 2016
Market Watch May 2016
 
Horniman Horticulture, FIL 349 ( Advanced Financial Theory and Problems)
Horniman Horticulture, FIL 349 ( Advanced Financial Theory and Problems)Horniman Horticulture, FIL 349 ( Advanced Financial Theory and Problems)
Horniman Horticulture, FIL 349 ( Advanced Financial Theory and Problems)
 
Market Watch TORONTO 2015 OCTOBER
Market Watch TORONTO 2015 OCTOBERMarket Watch TORONTO 2015 OCTOBER
Market Watch TORONTO 2015 OCTOBER
 
Valuation Of Maruti Suzuki
Valuation Of Maruti SuzukiValuation Of Maruti Suzuki
Valuation Of Maruti Suzuki
 
Valuation Of Maruti Suzuki
Valuation Of Maruti SuzukiValuation Of Maruti Suzuki
Valuation Of Maruti Suzuki
 
Current Years Estimation PowerPoint Presentation Slides
Current Years Estimation PowerPoint Presentation SlidesCurrent Years Estimation PowerPoint Presentation Slides
Current Years Estimation PowerPoint Presentation Slides
 
Commercial Due Diligence Process PowerPoint Presentation Slides
Commercial Due Diligence Process PowerPoint Presentation SlidesCommercial Due Diligence Process PowerPoint Presentation Slides
Commercial Due Diligence Process PowerPoint Presentation Slides
 
Market Report for August 2017 - Residential Resale
Market Report for August 2017 - Residential ResaleMarket Report for August 2017 - Residential Resale
Market Report for August 2017 - Residential Resale
 
Market Watch TORONTO 2015 SEPTEMBER
Market Watch TORONTO 2015 SEPTEMBERMarket Watch TORONTO 2015 SEPTEMBER
Market Watch TORONTO 2015 SEPTEMBER
 

Kürzlich hochgeladen

Just Call Vip call girls Mysore Escorts ☎️9352988975 Two shot with one girl (...
Just Call Vip call girls Mysore Escorts ☎️9352988975 Two shot with one girl (...Just Call Vip call girls Mysore Escorts ☎️9352988975 Two shot with one girl (...
Just Call Vip call girls Mysore Escorts ☎️9352988975 Two shot with one girl (...gajnagarg
 
Jual Obat Aborsi Surabaya ( Asli No.1 ) 085657271886 Obat Penggugur Kandungan...
Jual Obat Aborsi Surabaya ( Asli No.1 ) 085657271886 Obat Penggugur Kandungan...Jual Obat Aborsi Surabaya ( Asli No.1 ) 085657271886 Obat Penggugur Kandungan...
Jual Obat Aborsi Surabaya ( Asli No.1 ) 085657271886 Obat Penggugur Kandungan...ZurliaSoop
 
5CL-ADBA,5cladba, Chinese supplier, safety is guaranteed
5CL-ADBA,5cladba, Chinese supplier, safety is guaranteed5CL-ADBA,5cladba, Chinese supplier, safety is guaranteed
5CL-ADBA,5cladba, Chinese supplier, safety is guaranteedamy56318795
 
Just Call Vip call girls Erode Escorts ☎️9352988975 Two shot with one girl (E...
Just Call Vip call girls Erode Escorts ☎️9352988975 Two shot with one girl (E...Just Call Vip call girls Erode Escorts ☎️9352988975 Two shot with one girl (E...
Just Call Vip call girls Erode Escorts ☎️9352988975 Two shot with one girl (E...gajnagarg
 
➥🔝 7737669865 🔝▻ Ongole Call-girls in Women Seeking Men 🔝Ongole🔝 Escorts S...
➥🔝 7737669865 🔝▻ Ongole Call-girls in Women Seeking Men  🔝Ongole🔝   Escorts S...➥🔝 7737669865 🔝▻ Ongole Call-girls in Women Seeking Men  🔝Ongole🔝   Escorts S...
➥🔝 7737669865 🔝▻ Ongole Call-girls in Women Seeking Men 🔝Ongole🔝 Escorts S...amitlee9823
 
Vip Mumbai Call Girls Marol Naka Call On 9920725232 With Body to body massage...
Vip Mumbai Call Girls Marol Naka Call On 9920725232 With Body to body massage...Vip Mumbai Call Girls Marol Naka Call On 9920725232 With Body to body massage...
Vip Mumbai Call Girls Marol Naka Call On 9920725232 With Body to body massage...amitlee9823
 
➥🔝 7737669865 🔝▻ Dindigul Call-girls in Women Seeking Men 🔝Dindigul🔝 Escor...
➥🔝 7737669865 🔝▻ Dindigul Call-girls in Women Seeking Men  🔝Dindigul🔝   Escor...➥🔝 7737669865 🔝▻ Dindigul Call-girls in Women Seeking Men  🔝Dindigul🔝   Escor...
➥🔝 7737669865 🔝▻ Dindigul Call-girls in Women Seeking Men 🔝Dindigul🔝 Escor...amitlee9823
 
Call Girls In Hsr Layout ☎ 7737669865 🥵 Book Your One night Stand
Call Girls In Hsr Layout ☎ 7737669865 🥵 Book Your One night StandCall Girls In Hsr Layout ☎ 7737669865 🥵 Book Your One night Stand
Call Girls In Hsr Layout ☎ 7737669865 🥵 Book Your One night Standamitlee9823
 
➥🔝 7737669865 🔝▻ Sambalpur Call-girls in Women Seeking Men 🔝Sambalpur🔝 Esc...
➥🔝 7737669865 🔝▻ Sambalpur Call-girls in Women Seeking Men  🔝Sambalpur🔝   Esc...➥🔝 7737669865 🔝▻ Sambalpur Call-girls in Women Seeking Men  🔝Sambalpur🔝   Esc...
➥🔝 7737669865 🔝▻ Sambalpur Call-girls in Women Seeking Men 🔝Sambalpur🔝 Esc...amitlee9823
 
Just Call Vip call girls Palakkad Escorts ☎️9352988975 Two shot with one girl...
Just Call Vip call girls Palakkad Escorts ☎️9352988975 Two shot with one girl...Just Call Vip call girls Palakkad Escorts ☎️9352988975 Two shot with one girl...
Just Call Vip call girls Palakkad Escorts ☎️9352988975 Two shot with one girl...gajnagarg
 
VIP Model Call Girls Hinjewadi ( Pune ) Call ON 8005736733 Starting From 5K t...
VIP Model Call Girls Hinjewadi ( Pune ) Call ON 8005736733 Starting From 5K t...VIP Model Call Girls Hinjewadi ( Pune ) Call ON 8005736733 Starting From 5K t...
VIP Model Call Girls Hinjewadi ( Pune ) Call ON 8005736733 Starting From 5K t...SUHANI PANDEY
 
Discover Why Less is More in B2B Research
Discover Why Less is More in B2B ResearchDiscover Why Less is More in B2B Research
Discover Why Less is More in B2B Researchmichael115558
 
Junnasandra Call Girls: 🍓 7737669865 🍓 High Profile Model Escorts | Bangalore...
Junnasandra Call Girls: 🍓 7737669865 🍓 High Profile Model Escorts | Bangalore...Junnasandra Call Girls: 🍓 7737669865 🍓 High Profile Model Escorts | Bangalore...
Junnasandra Call Girls: 🍓 7737669865 🍓 High Profile Model Escorts | Bangalore...amitlee9823
 
Aspirational Block Program Block Syaldey District - Almora
Aspirational Block Program Block Syaldey District - AlmoraAspirational Block Program Block Syaldey District - Almora
Aspirational Block Program Block Syaldey District - AlmoraGovindSinghDasila
 
➥🔝 7737669865 🔝▻ Bangalore Call-girls in Women Seeking Men 🔝Bangalore🔝 Esc...
➥🔝 7737669865 🔝▻ Bangalore Call-girls in Women Seeking Men  🔝Bangalore🔝   Esc...➥🔝 7737669865 🔝▻ Bangalore Call-girls in Women Seeking Men  🔝Bangalore🔝   Esc...
➥🔝 7737669865 🔝▻ Bangalore Call-girls in Women Seeking Men 🔝Bangalore🔝 Esc...amitlee9823
 
DATA SUMMIT 24 Building Real-Time Pipelines With FLaNK
DATA SUMMIT 24  Building Real-Time Pipelines With FLaNKDATA SUMMIT 24  Building Real-Time Pipelines With FLaNK
DATA SUMMIT 24 Building Real-Time Pipelines With FLaNKTimothy Spann
 
Just Call Vip call girls Bellary Escorts ☎️9352988975 Two shot with one girl ...
Just Call Vip call girls Bellary Escorts ☎️9352988975 Two shot with one girl ...Just Call Vip call girls Bellary Escorts ☎️9352988975 Two shot with one girl ...
Just Call Vip call girls Bellary Escorts ☎️9352988975 Two shot with one girl ...gajnagarg
 
Escorts Service Kumaraswamy Layout ☎ 7737669865☎ Book Your One night Stand (B...
Escorts Service Kumaraswamy Layout ☎ 7737669865☎ Book Your One night Stand (B...Escorts Service Kumaraswamy Layout ☎ 7737669865☎ Book Your One night Stand (B...
Escorts Service Kumaraswamy Layout ☎ 7737669865☎ Book Your One night Stand (B...amitlee9823
 
Just Call Vip call girls kakinada Escorts ☎️9352988975 Two shot with one girl...
Just Call Vip call girls kakinada Escorts ☎️9352988975 Two shot with one girl...Just Call Vip call girls kakinada Escorts ☎️9352988975 Two shot with one girl...
Just Call Vip call girls kakinada Escorts ☎️9352988975 Two shot with one girl...gajnagarg
 

Kürzlich hochgeladen (20)

Just Call Vip call girls Mysore Escorts ☎️9352988975 Two shot with one girl (...
Just Call Vip call girls Mysore Escorts ☎️9352988975 Two shot with one girl (...Just Call Vip call girls Mysore Escorts ☎️9352988975 Two shot with one girl (...
Just Call Vip call girls Mysore Escorts ☎️9352988975 Two shot with one girl (...
 
Jual Obat Aborsi Surabaya ( Asli No.1 ) 085657271886 Obat Penggugur Kandungan...
Jual Obat Aborsi Surabaya ( Asli No.1 ) 085657271886 Obat Penggugur Kandungan...Jual Obat Aborsi Surabaya ( Asli No.1 ) 085657271886 Obat Penggugur Kandungan...
Jual Obat Aborsi Surabaya ( Asli No.1 ) 085657271886 Obat Penggugur Kandungan...
 
5CL-ADBA,5cladba, Chinese supplier, safety is guaranteed
5CL-ADBA,5cladba, Chinese supplier, safety is guaranteed5CL-ADBA,5cladba, Chinese supplier, safety is guaranteed
5CL-ADBA,5cladba, Chinese supplier, safety is guaranteed
 
Just Call Vip call girls Erode Escorts ☎️9352988975 Two shot with one girl (E...
Just Call Vip call girls Erode Escorts ☎️9352988975 Two shot with one girl (E...Just Call Vip call girls Erode Escorts ☎️9352988975 Two shot with one girl (E...
Just Call Vip call girls Erode Escorts ☎️9352988975 Two shot with one girl (E...
 
➥🔝 7737669865 🔝▻ Ongole Call-girls in Women Seeking Men 🔝Ongole🔝 Escorts S...
➥🔝 7737669865 🔝▻ Ongole Call-girls in Women Seeking Men  🔝Ongole🔝   Escorts S...➥🔝 7737669865 🔝▻ Ongole Call-girls in Women Seeking Men  🔝Ongole🔝   Escorts S...
➥🔝 7737669865 🔝▻ Ongole Call-girls in Women Seeking Men 🔝Ongole🔝 Escorts S...
 
Vip Mumbai Call Girls Marol Naka Call On 9920725232 With Body to body massage...
Vip Mumbai Call Girls Marol Naka Call On 9920725232 With Body to body massage...Vip Mumbai Call Girls Marol Naka Call On 9920725232 With Body to body massage...
Vip Mumbai Call Girls Marol Naka Call On 9920725232 With Body to body massage...
 
➥🔝 7737669865 🔝▻ Dindigul Call-girls in Women Seeking Men 🔝Dindigul🔝 Escor...
➥🔝 7737669865 🔝▻ Dindigul Call-girls in Women Seeking Men  🔝Dindigul🔝   Escor...➥🔝 7737669865 🔝▻ Dindigul Call-girls in Women Seeking Men  🔝Dindigul🔝   Escor...
➥🔝 7737669865 🔝▻ Dindigul Call-girls in Women Seeking Men 🔝Dindigul🔝 Escor...
 
Call Girls In Hsr Layout ☎ 7737669865 🥵 Book Your One night Stand
Call Girls In Hsr Layout ☎ 7737669865 🥵 Book Your One night StandCall Girls In Hsr Layout ☎ 7737669865 🥵 Book Your One night Stand
Call Girls In Hsr Layout ☎ 7737669865 🥵 Book Your One night Stand
 
➥🔝 7737669865 🔝▻ Sambalpur Call-girls in Women Seeking Men 🔝Sambalpur🔝 Esc...
➥🔝 7737669865 🔝▻ Sambalpur Call-girls in Women Seeking Men  🔝Sambalpur🔝   Esc...➥🔝 7737669865 🔝▻ Sambalpur Call-girls in Women Seeking Men  🔝Sambalpur🔝   Esc...
➥🔝 7737669865 🔝▻ Sambalpur Call-girls in Women Seeking Men 🔝Sambalpur🔝 Esc...
 
Just Call Vip call girls Palakkad Escorts ☎️9352988975 Two shot with one girl...
Just Call Vip call girls Palakkad Escorts ☎️9352988975 Two shot with one girl...Just Call Vip call girls Palakkad Escorts ☎️9352988975 Two shot with one girl...
Just Call Vip call girls Palakkad Escorts ☎️9352988975 Two shot with one girl...
 
VIP Model Call Girls Hinjewadi ( Pune ) Call ON 8005736733 Starting From 5K t...
VIP Model Call Girls Hinjewadi ( Pune ) Call ON 8005736733 Starting From 5K t...VIP Model Call Girls Hinjewadi ( Pune ) Call ON 8005736733 Starting From 5K t...
VIP Model Call Girls Hinjewadi ( Pune ) Call ON 8005736733 Starting From 5K t...
 
Discover Why Less is More in B2B Research
Discover Why Less is More in B2B ResearchDiscover Why Less is More in B2B Research
Discover Why Less is More in B2B Research
 
Junnasandra Call Girls: 🍓 7737669865 🍓 High Profile Model Escorts | Bangalore...
Junnasandra Call Girls: 🍓 7737669865 🍓 High Profile Model Escorts | Bangalore...Junnasandra Call Girls: 🍓 7737669865 🍓 High Profile Model Escorts | Bangalore...
Junnasandra Call Girls: 🍓 7737669865 🍓 High Profile Model Escorts | Bangalore...
 
Aspirational Block Program Block Syaldey District - Almora
Aspirational Block Program Block Syaldey District - AlmoraAspirational Block Program Block Syaldey District - Almora
Aspirational Block Program Block Syaldey District - Almora
 
➥🔝 7737669865 🔝▻ Bangalore Call-girls in Women Seeking Men 🔝Bangalore🔝 Esc...
➥🔝 7737669865 🔝▻ Bangalore Call-girls in Women Seeking Men  🔝Bangalore🔝   Esc...➥🔝 7737669865 🔝▻ Bangalore Call-girls in Women Seeking Men  🔝Bangalore🔝   Esc...
➥🔝 7737669865 🔝▻ Bangalore Call-girls in Women Seeking Men 🔝Bangalore🔝 Esc...
 
Abortion pills in Jeddah | +966572737505 | Get Cytotec
Abortion pills in Jeddah | +966572737505 | Get CytotecAbortion pills in Jeddah | +966572737505 | Get Cytotec
Abortion pills in Jeddah | +966572737505 | Get Cytotec
 
DATA SUMMIT 24 Building Real-Time Pipelines With FLaNK
DATA SUMMIT 24  Building Real-Time Pipelines With FLaNKDATA SUMMIT 24  Building Real-Time Pipelines With FLaNK
DATA SUMMIT 24 Building Real-Time Pipelines With FLaNK
 
Just Call Vip call girls Bellary Escorts ☎️9352988975 Two shot with one girl ...
Just Call Vip call girls Bellary Escorts ☎️9352988975 Two shot with one girl ...Just Call Vip call girls Bellary Escorts ☎️9352988975 Two shot with one girl ...
Just Call Vip call girls Bellary Escorts ☎️9352988975 Two shot with one girl ...
 
Escorts Service Kumaraswamy Layout ☎ 7737669865☎ Book Your One night Stand (B...
Escorts Service Kumaraswamy Layout ☎ 7737669865☎ Book Your One night Stand (B...Escorts Service Kumaraswamy Layout ☎ 7737669865☎ Book Your One night Stand (B...
Escorts Service Kumaraswamy Layout ☎ 7737669865☎ Book Your One night Stand (B...
 
Just Call Vip call girls kakinada Escorts ☎️9352988975 Two shot with one girl...
Just Call Vip call girls kakinada Escorts ☎️9352988975 Two shot with one girl...Just Call Vip call girls kakinada Escorts ☎️9352988975 Two shot with one girl...
Just Call Vip call girls kakinada Escorts ☎️9352988975 Two shot with one girl...
 

CEO Dashboard Template in Excel

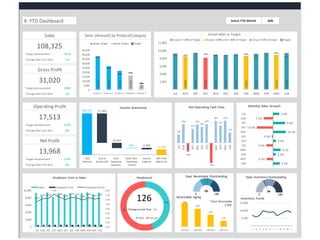
  • 1. 4. YTD Dashboard JUN 101% 1% 108% 6% 110% 8% 114% 9%Change Over Last Year Gross Profit 31,020 Target Achievement Change Over Last Year Operating Profit 17,513 Target Achievement Change Over Last Year Net Profit 13,968 Target Achievement Change Over Last Year Select YTD Month Sales Sales (Amount) by Product/Category 108,325 Target Achievement 56 70 Male Female Monthly Sales Growth Actual Sales vs Target Income Statement Net Operating Cash Flow Employee Cost vs Sales Headcount 126 Change vsLast Year 1% Days Receivable Outstanding 93 Receivable Aging Total Receivable 1,350 Days Inventory Outstanding 64 Inventory Trend 9,297 8,600 9,429 8,200 9,047 8,968 9,178 8,681 9,211 9,409 8,916 9,389 - 2,000 4,000 6,000 8,000 10,000 12,000 JUL AUG SEP OCT NOV DEC JAN FEB MAR APR MAY JUN Actual >=100% of Target Actual <100% and >=90% of Target Actual <90% ofTarget Target 37,914 27,081 21,665 16,249 5,416 0 5,000 10,000 15,000 20,000 25,000 30,000 35,000 40,000 45,000 Product 1 Product 2 Product 3 Product 4 Product 5 Above Target Below Target Target 108,325 13,968 844 77,305 13,507 4,389 Total Revenue Cost of Goods Sold Total Operating Expenses Other Non- Operating Income Finance Expense Net Profit Before Tax 107 236 -106 179 235 205 239 -254 281 221 279 132 JUL AUG SEP OCT NOV DEC JAN FEB MAR APR MAY JUN 5.0% -7.5% 9.6% -13.0% 10.3% -0.9% 2.3% -5.4% 6.1% 2.1% -5.2% 5.3% JUL AUG SEP OCT NOV DEC JAN FEB MAR APR MAY JUN 5.5% 6.2% 6.2% 7.2% 6.4% 6.0% 6.5% 6.3% 5.9% 6.4% 6.1% 6.3% 0.0% 1.0% 2.0% 3.0% 4.0% 5.0% 6.0% 7.0% 8.0% 0 2,000 4,000 6,000 8,000 10,000 JUL AUG SEP OCT NOV DEC JAN FEB MAR APR MAY JUN Sales EmployeeCost EmployeeCost % 540 405 270 135 <30 Days <60 Days <90 Days >90 Days - 5,000 10,000 15,000 J A S O N D J F M A M J 0 1800 180
  • 2. 1. Indicators 1. Indicators 2. Enter Data Indicators Fiscal Year Start Month JUL 3. Monthly Dashboard 1. Fiscal Year Start Month: Fiscal Year 2019-20 4. YTD Dashboard JAN FEB MAR Value is >= 100% 100% APR value is < 100% and >= 90% 90% MAY Value is < 90% 90% JUN JUL AUG SEP OCT NOV DEC Sales Total Target % of Target Difference 2. Enter Data Particular 3. Monthly Dashboard 4. YTD Dashboard Choose the target rules
  • 3. 1. Indicators 2. Enter Data Monthly Dashboard YTD Dashboard 2. Enter Data MAY JUN 3. Monthly Dashboard Indicator Name Actual/Target JUL AUG SEP OCT NOV DEC JAN FEB MAR APR MAY JUN Calculation Type Selected Month YTD 4. YTD Dashboard Actual 9,297 8,600 9,429 8,200 9,047 8,968 9,178 8,681 9,211 9,409 8,916 9,389 Sum 8,916 108,325 Sales Growth 5% -7% 10% -13% 10% -1% 2% -5% 6% 2% -5% 5% Target 8,968 8,894 9,382 9,163 8,811 8,662 8,705 9,171 8,617 9,355 9,444 8,506 Sum 9,444 107,678 Last Year 8,832 9,068 8,712 8,910 9,404 8,587 8,637 8,671 9,102 8,769 9,007 9,071 Sum 9,007 106,770 Sales by Product: Actual 3,254 3,010 3,300 2,870 3,166 3,139 3,212 3,038 3,224 3,293 3,121 3,286 Sum 3,121 37,914 Target 3,139 3,113 3,284 3,207 3,084 3,032 3,047 3,210 3,016 3,274 3,305 2,977 Sum 3,305 37,687 Actual 2,324 2,150 2,357 2,050 2,262 2,242 2,295 2,170 2,303 2,352 2,229 2,347 Sum 2,229 27,081 Target 2,063 2,046 2,158 2,107 2,027 1,992 2,002 2,109 1,982 2,152 2,172 1,956 Sum 2,172 24,766 Actual 1,859 1,720 1,886 1,640 1,809 1,794 1,836 1,736 1,842 1,882 1,783 1,878 Sum 1,783 21,665 Target 1,525 1,512 1,595 1,558 1,498 1,473 1,480 1,559 1,465 1,590 1,605 1,446 Sum 1,605 18,305 Actual 1,395 1,290 1,414 1,230 1,357 1,345 1,377 1,302 1,382 1,411 1,337 1,408 Sum 1,337 16,249 Target 1,614 1,601 1,689 1,649 1,586 1,559 1,567 1,651 1,551 1,684 1,700 1,531 Sum 1,700 19,382 Actual 465 430 471 410 452 448 459 434 461 470 446 469 Sum 446 5,416 Target 628 623 657 641 617 606 609 642 603 655 661 595 Sum 661 7,537 Actual 9,297 8,600 9,429 8,200 9,047 8,968 9,178 8,681 9,211 9,409 8,916 9,389 Sum 8,916 108,325 Target 8,968 8,894 9,382 9,163 8,811 8,662 8,705 9,171 8,617 9,355 9,444 8,506 Sum 9,444 107,678 Actual - - - - - - - - - - - - Target - - - - - - - - - - - - Actual 6,452 6,898 6,106 6,378 6,747 6,121 6,602 6,033 6,448 6,273 6,419 6,828 Sum 6,419 77,305 Target 6,780 6,149 6,158 6,512 6,896 6,683 6,513 6,369 6,792 6,436 6,738 6,808 Sum 6,738 78,834 Last Year 6,654 6,340 6,325 6,680 6,065 6,265 6,082 6,777 6,938 6,575 6,463 6,352 Sum 6,463 77,516 Actual 2,845 1,702 3,323 1,822 2,300 2,847 2,576 2,648 2,763 3,136 2,497 2,561 Sum 2,497 31,020 Target 2,188 2,745 3,224 2,651 1,915 1,979 2,192 2,802 1,825 2,919 2,706 1,698 Sum 2,706 28,844 Last Year 2,178 2,728 2,387 2,230 3,339 2,322 2,555 1,894 2,164 2,194 2,544 2,719 Sum 2,544 29,254 Actual 1,023 1,061 1,170 1,181 1,166 1,078 1,188 1,100 1,078 1,199 1,085 1,178 Sum 1,085 13,507 Target 1,039 1,158 1,052 1,157 1,023 1,006 1,106 1,002 1,130 1,174 1,050 1,065 Sum 1,050 12,962 Last Year 1,118 1,120 1,003 1,048 1,023 1,014 1,107 1,061 1,176 1,196 1,004 1,183 Sum 1,004 13,053 Actual 1,822 641 2,153 641 1,134 1,769 1,388 1,548 1,685 1,937 1,412 1,383 Sum 1,412 17,513 Target 1,149 1,587 2,172 1,494 892 973 1,086 1,800 695 1,745 1,656 633 Sum 1,656 15,882 Last Year 1,060 1,608 1,384 1,182 2,316 1,308 1,448 833 988 998 1,540 1,536 Sum 1,540 16,201 Actual 71 89 50 61 66 88 76 74 76 74 54 65 Sum 54 844 Target 70 69 73 76 88 53 59 50 59 57 90 87 Sum 90 831 Last Year 89 79 61 55 55 80 85 69 58 84 62 52 Sum 62 829 Actual 536 294 348 416 337 345 487 313 221 297 427 370 Sum 427 4,389 Target 160 524 232 471 281 226 298 567 359 410 403 529 Sum 403 4,459 Last Year 367 432 90 509 376 338 376 399 234 252 400 419 Sum 400 4,191 Actual 1,358 436 1,855 286 863 1,512 977 1,310 1,540 1,714 1,039 1,079 Sum 1,039 13,968 Target 1,059 1,132 2,013 1,100 700 800 847 1,284 395 1,392 1,343 191 Sum 1,343 12,254 Last Year 783 1,255 1,356 728 1,995 1,051 1,157 504 812 830 1,202 1,169 Sum 1,202 12,839 Actual 14.6% 5.1% 19.7% 3.5% 9.5% 16.9% 10.6% 15.1% 16.7% 18.2% 11.7% 11.5% 11.7% 12.9% Target 11.8% 12.7% 21.5% 12.0% 7.9% 9.2% 9.7% 14.0% 4.6% 14.9% 14.2% 2.2% 14.2% 11.4% Last Year 8.9% 13.8% 15.6% 8.2% 21.2% 12.2% 13.4% 5.8% 8.9% 9.5% 13.3% 12.9% 13.3% 12.0% Employee Cost Actual 512 531 585 591 583 539 594 550 539 600 543 589 Sum 543 6,754 Male 56 55 54 54 54 54 57 59 58 57 57 56 Last Value 57 56 Female 75 74 76 75 78 77 75 74 73 71 70 70 Last Value 70 70 Actual Total 131 129 130 129 132 131 132 133 131 128 127 126 Last Value 127 126 Last Year Total 131 126 135 132 127 130 135 125 125 134 130 125 Last Value 130 125 17 Net Operating Cash Flow Actual 107 236 -106 179 235 205 239 -254 281 221 279 132 Sum 279 1,754 18 Net Financing Cash Flow Actual 177 135 231 217 124 191 218 155 135 121 131 117 Sum 131 1,952 19 Net Investing Cash Flow Actual 149 101 295 257 188 146 182 141 127 117 208 242 Sum 208 2,153 20 Cash at End of Month Actual 105 106 102 107 112 113 113 102 104 122 107 104 Last Value 107 104 21 Accounts Receivable Actual 1,275 1,305 1,350 1,275 1,350 1,275 1,290 1,350 1,275 1,350 1,275 1,350 Last Value 1,275 1,350 22 Days Receivable Outstanding Actual 81 39 94 53 99 29 58 87 40 110 89 93 Last Value 89 93 23 Overdue Accounts Receivable Actual 511 435 465 586 570 553 622 572 430 642 409 605 Last Value 409 605 24 % of Overdue Receivable Actual 40% 33% 34% 46% 42% 43% 48% 42% 34% 48% 32% 45% 32% 45% 25 Accounts Receivable Aging Actual 26 <30 Days Actual 510 522 540 510 540 510 516 540 510 540 510 540 Last Value 510 540 27 <60 Days Actual 383 392 405 383 405 383 387 405 383 405 383 405 Last Value 383 405 28 <90 Days Actual 255 261 270 255 270 255 258 270 255 270 255 270 Last Value 255 270 29 >90 Days Actual 128 131 135 128 135 128 129 135 128 135 128 135 Last Value 128 135 30 Total Accounts Receivable Actual 1,275 1,305 1,350 1,275 1,350 1,275 1,290 1,350 1,275 1,350 1,275 1,350 Last Value 1,275 1,350 (Total of Receivable Aging must be equal to Total Accounts Receivable) - - - - - - - - - - - - 31 Inventory Actual 6,767 5,678 6,789 9,876 9,090 8,765 9,087 6,543 7,865 8,976 9,876 8,765 Last Value 9,876 8,765 32 Days Inventory Outstanding Actual 30 86 33 79 33 43 68 84 74 61 37 64 Last Value 37 64 11 Operating Profit (EBIT) 12 Other Non-Operating Income/(Expense) Headcount 13 Finance Expense 14 Net Profit Before Tax 15 Net Profit Margin % 16 6 7 (Total Sales by Product and Total Sales must be equal) 10 Total Operating Expenses 1 Total Revenue 8 Cost of Goods Sold 9 Gross Profit Product 1 Product 2 Product 3 Product 4 Product 5 Total Sales by Product 2 3 4 5
  • 4. 1. Indicators 3. Monthly Dashboard MAY 2. Enter Data 3. Monthly Dashboard 4. YTD Dashboard 94% -1% 92% -2% 85% -8% 77% -14% Net Profit Change Over Last Year Target Achievement Change Over Last Year Select Month 8,916 2,497 1,412 1,039 Target Achievement Change Over Last Year Target Achievement Change Over Last Year Target Achievement Sales (Amount) by Product/CategorySales Gross Profit Operating Profit 5.0% -7.5% 9.6% -13.0% 10.3% -0.9% 2.3% -5.4% 6.1% 2.1% -5.2% JUL AUG SEP OCT NOV DEC JAN FEB MAR APR MAY Monthly Sales Growth Actual Sales vs Target 9,297 8,600 9,429 8,200 9,047 8,968 9,178 8,681 9,211 9,409 8,916 - 2,000 4,000 6,000 8,000 10,000 12,000 JUL AUG SEP OCT NOV DEC JAN FEB MAR APR MAY Actual >=100% of Target Actual <100% and >=90% of Target Actual <90% of Target Target 3,121 2,229 1,783 1,337 446 0 1,000 2,000 3,000 4,000 Product 1 Product 2 Product 3 Product 4 Product 5 Above Target Below Target Target 8,916 1,039 6,419 1,085 427 Total Revenue Cost of Goods Sold Total Operating Expenses Non-Opr. Income (Expense) Finance Expense Net Profit Before Tax Income Statement Net Operating Cash Flow 107 236 -106 179 235 205 239 -254 281 221 279 Employee Cost vs Sales Headcount 57 70 Male Female 127 Change vsLast Year -2% Days Receivable Outstanding 89 510 383 255 128 <30 Days <60 Days <90 Days >90 Days Receivable Aging Total Receivable 1,275 Days Inventory Outstanding 37 - 5,000 10,000 15,000 J A S O N D J F M A M 5.5% 6.2% 6.2% 7.2% 6.4% 6.0% 6.5% 6.3% 5.9% 6.4% 6.1% 0.0% 1.0% 2.0% 3.0% 4.0% 5.0% 6.0% 7.0% 8.0% 0 2,000 4,000 6,000 8,000 10,000 JUL AUG SEP OCT NOV DEC JAN FEB MAR APR MAY Sales EmployeeCost EmployeeCost % 0 1800 180 Inventory Trend 54
  • 5. 1. Indicators 4. YTD Dashboard JUN 2. Enter Data 3. Monthly Dashboard 4. YTD Dashboard 101% 1% 108% 6% 110% 8% 114% 9%Change Over Last Year Gross Profit 31,020 Target Achievement Change Over Last Year Operating Profit 17,513 Target Achievement Change Over Last Year Net Profit 13,968 Target Achievement Change Over Last Year Select YTD Month Sales Sales (Amount) by Product/Category 108,325 Target Achievement 56 70 Male Female Monthly Sales Growth Actual Sales vs Target Income Statement Net Operating Cash Flow Employee Cost vs Sales Headcount 126 Change vsLast Year 1% Days Receivable Outstanding 93 Receivable Aging Total Receivable 1,350 Days Inventory Outstanding 64 Inventory Trend 9,297 8,600 9,429 8,200 9,047 8,968 9,178 8,681 9,211 9,409 8,916 9,389 - 2,000 4,000 6,000 8,000 10,000 12,000 JUL AUG SEP OCT NOV DEC JAN FEB MAR APR MAY JUN Actual >=100% of Target Actual <100% and >=90% of Target Actual <90% ofTarget Target 37,914 27,081 21,665 16,249 5,416 0 5,000 10,000 15,000 20,000 25,000 30,000 35,000 40,000 45,000 Product 1 Product 2 Product 3 Product 4 Product 5 Above Target Below Target Target 108,325 13,968 77,305 13,507 4,389 Total Revenue Cost of Goods Sold Total Operating Expenses Non-Opr. Income (Expense) Finance Expense Net Profit Before Tax 107 236 -106 179 235 205 239 -254 281 221 279 132 JUL AUG SEP OCT NOV DEC JAN FEB MAR APR MAY JUN 5.0% -7.5% 9.6% -13.0% 10.3% -0.9% 2.3% -5.4% 6.1% 2.1% -5.2% 5.3% JUL AUG SEP OCT NOV DEC JAN FEB MAR APR MAY JUN 5.5% 6.2% 6.2% 7.2% 6.4% 6.0% 6.5% 6.3% 5.9% 6.4% 6.1% 6.3% 0.0% 1.0% 2.0% 3.0% 4.0% 5.0% 6.0% 7.0% 8.0% 0 2,000 4,000 6,000 8,000 10,000 JUL AUG SEP OCT NOV DEC JAN FEB MAR APR MAY JUN Sales EmployeeCost EmployeeCost % 540 405 270 135 <30 Days <60 Days <90 Days >90 Days - 5,000 10,000 15,000 J A S O N D J F M A M J 0 1800 180 844