Fad the golden business horizon cd
•
1 gefällt mir•1,000 views

Fad the golden business horizon cd

Empfohlen
Empfohlen
Weitere ähnliche Inhalte
Was ist angesagt?
Was ist angesagt? (20)
Ähnlich wie Fad the golden business horizon cd
Ähnlich wie Fad the golden business horizon cd (20)
Mehr von Shushmul Maheshwari
Mehr von Shushmul Maheshwari (20)
Kürzlich hochgeladen
Kürzlich hochgeladen (20)
Fad the golden business horizon cd
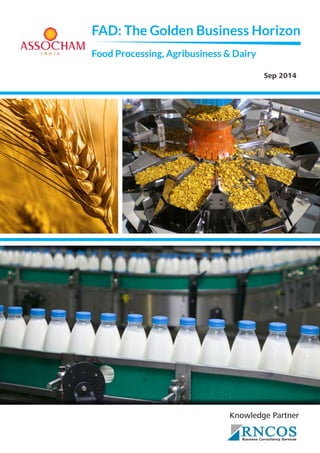
- 1. FAD: The Golden Business Horizon 1 RNCOS FAD: The Golden Business HBousinesrs Coinszultanocy Sernvices Food Processing, Agribusiness & Dairy Sep 2014 Knowledge Partner
- 3. Message Agribusiness, Food Processing and Dairy industries along with allied sectors contribute significantly in Indian GDP. The sectors thus hold great significance for every reason. The international summit is important strata for our Indian economy as it brings solution for economic up liftment of society at large. Innovative technologies & exploring global business opportunities are the crucial factors that can be harbored to uplift these sectors in this global meltdown. Through such summits, we must concentrate on some burning issues like Food Regulations/Safety & Quality standards to compete the international players. It is matter of great pleasure that along with MoFPI, APEDA, DBT; GoI, Gujarat, Karnataka, Haryana, and Punjab, The Associated Chambers of Commerce and Industry of India has taken initiative to organize 6th International Summit FAD 2014 (Food Processing Agribusiness and Dairy) on 29th Sept. at Ahmedabad, Gujarat. Topics in the summit are very significant and will offer unmatched opportunities of networking to all stakeholders as well as Industry Leaders. I hope this summit will go a long way in adding momentum to Food-Agri and allied sectors in India. I welcome all the participants and wish the conference a grand success.
- 4. 1 Food Processing Industry 1.1 Overview & Segmentation 1.2 Industry Outlook 1.3 Government Initiatives 2 Agri-Business 2.1 Industry Outlook 2.2 Government Initiatives 3 Dairy 3.1 Industry Outlook 3.2 Government Initiatives 4 Trends & Technology 4.1 Corporate Foraying Dairy Segment 4.2 Dairy Sector: Witnessing Technology Revolution 4.3 Increasing Mechanization in Agriculture 4.4 Rising Organic Food Industry 4.5 Frozen Foods: Gaining Prominence 4.6 Commodity Trading: Hedging for Farmers 4.7 Surging ICT Applications in Agriculture C ntents Table of RNCOS Business Consultancy Services 5 FAD Regulatory Purview 6 Industry Roadblock 7 Closing the Gap: Path Ahead
- 5. Figure 1-1: Food Industry Segment by Level of Processing Figure 1-2: India - Food Processing Industry (INR Crore), 2012, 2015, & 2020 Figure 1-3: India - Export of APEDA Products (INR Crore) 2010-11 to 2013-14 Figure 1-4: Top Exporting Countries for APEDA Products from India (%), 2013-14 Figure 1-5: India - Import of APEDA Products (INR Crore), 2010-11 to 2013-14 Figure 1-6: Top Importing Countries for APEDA Products in India (%), 2013-14 Figure 1-7: India - FDI Inflows in Food Processing Industry (INR Crore) 2007-08 to 2013-14 Figure 1-8: India - Employment in Registered Food Processing Units (Million), 2007-08 to 2011-12 & 2019-20 Figure 1-9: NMFP Spending Share for 12th Plan Figure 1-10: India - Number of Integrated Cold Chain Projects Approved till Date under Different Phases Figure 2-1:India - Production Volume Share of Major Crops (%), 2013-14 Figure 3-1: India - Milk Production (Million Tonnes), 2009-10 to 2013-14 Figure 3-2: India - Projected Milk Demand (Million Tonnes), 2016-17 & 2021-22 Figure 4-1: India - Tractors’ Production and Sales (‘000 Units), 2009-10 to 2012-13 Table 1-1: India - Exports of APEDA Products by Categories (2013-14) Table 1-2: India - Import of APEDA Products by Categories (2013-14) Table 2-1: India - Agriculture GDP at Factor Cost (at 2004-05 prices), 2009-10 to 2013-14 Table 2-2: Top Import and Export Countries for Fruit & Vegetable Seeds (2013-14) Table 2-3: Global - GM Crop Cultivation (Million Hectares), 2010-2013 Table 2-4: MNAIS and WBCIS Implemented in Districts/States during Kharif 2013 and Rabi 2013-14 Table 4-1: India - Agri-ICT Projects List of Figures List of Tables
- 6. Food Processing, Agribusiness, and Dairy (FAD); these three terms are inextricably linked with each other. The whole food industry is an output of the mighty FAD. Agriculture, being the heart of Indian economy with over 2/3rd of the population dependent on it, is a critical link between the FAD industry and its end users. Accordingly, the term agribusiness refers to several businesses of seed supply, farming, farm machinery, agrichemicals, wholesale & distribution, processing, marketing and retail sales of food and non-food farm commodities and products. On the other hand, dairy technology deals with milk and milk products’ processing. While agriculture and dairy are at the heart of the food industry, food processing extends from fruits, vegetables, spices, meat/poultry, dairy products, soya products, fisheries, grain processing to chocolates, cocoa, confectionaries, and high protein foods, among others. The FAD for 2014 epitomizes ASSOCHAM’ (as the organizer) and RNCOS’ (as a Knowledge Partner) zest to further provide the associated industries a stronger foothold and present a common platform to various stakeholders for sharing thoughts, capitalizing upon existing opportunities, creating strategic alliances, and paving way for a brighter and healthier future. Listed below are the core objectives of this research report: • To understand the food processing, agriculture, and dairy industry of India and highlight the importance of FPI in the Indian economy; • Make prospective investors, stakeholders and policy makers aware of the existing and upcoming opportunities; • To scrutinize the industry trends, government initiatives, and industry growth hurdles; • To devise strategies for tackling the hurdles and capturing the opportunities. Preamble: Food Processing, Agribusiness, and Dairy Technology (FAD) 6 FAD: The Golden Business HorizonRNCOSBusiness Consultancy Services
- 7. The term ‘food processing’1 is defined as a process of value addition to the agricultural or horticultural produce by various methods like grading, sorting and packaging. In other words, it is a technique for manufacturing and preserving food substances in an effective manner with a view to enhance their shelf life, improve quality as well as make them functionally more useful. It covers a wide spectrum of products from sub-sectors comprising agriculture, horticulture, plantation, animal husbandry and fish-eries. It also includes other industries that use agricultural inputs for manufacturing of edible products. The ever evolving consumers lifestyles, altered food habits and tastes world over have transformed the dynamics of the food processing industry. The evolution of food processing benefits all sections of the society. For instance, it helps the Farmers to get better returns, higher yield, and lowered risks drastically; the Consumers to have access to a greater variety, better prices and newer products, and the Economy to get benefited with new businesses2. Evidently, as per the Agriculture & Processed Food Export Development Authority (APEDA) classifica-tion, the industry segments are as follows: • Floriculture involving Floriculture, Fruit & Vegetable Seeds • Fresh Fruits & Vegetables comprising Fresh Onions, Other Fresh Vegetables, Walnut, Fresh Man-goes, Fresh Grapes, & Other Fresh Fruits • Processed Fruits and Vegetables consisting of Cucumber and Gherkins, Dried & Preserved Vegeta-bles, Mango Pulp, Other Processed Fruits & Vegetables, Pulses • Animal Products including Buffalo Meat, Sheep/Goat Meat, Other Meat, Processed Meat, Animal Casing, Poultry Products, Dairy Products, Casein, Natural Honey, Albumin (eggs & milk) • Other Processed Foods like Groundnuts, GuarGum, Jaggery & Confectionery, Cocoa Products, Cereal Preparations, Milled Products, Alcoholic Beverages, Miscellaneous Preparations • Cereals such as Basmati Rice, Non-Basmati Rice, Wheat, Maize, Others FOOD PROCESSING INDUSTRY 7 FAD: The Golden Business Horizon RNCOS Business Consultancy Services 1.1 OVERVIEW & SEGMENTATION 1 Ministry of Food Processing of India (MOFPI) 2 Ministry of Agriculture; Department of Agriculture and Cooperation; Directorate of Economics and Statistics 1
- 8. FAD: The Golden Business Horizon 8 RNCOS Business Consultancy Services Figure 1-1: Food Industry Segment by Level of Processing Fruits and Vegetables Grains and Seeds Oilseeds Beverages Milk & Dairy Meat and Poultry Marine Products Primary Processing Secondary Processing Tertiary Processing Cleaning, Sorting, Grading and Cutting Sorting and Grading Sorting and Grading Sorting, Bleaching and Grading Grading and Refrigerating Sorting and Refrigerating Chilling and Freezing Slices, Pulps, Flakes, Paste, Preserves and Flavoured Flour, Broken Rice, Puff, Malt and Milling Oil Cakes Leaf, Dust and Powder Cottage Cheese, Cream, Skimmed and Dried Milk Cut, Fried, Frozen and Chilled Cut, Fried, Frozen and Chilled Ketchups, Jams, Juices, Pickles, Preserves, Candies etc. Biscuits, Noodles, Flakes, Cakes, Namkeen Sunflower, Groundnut, Mustard, Soya, Olive Oil etc Tea Bags, Flavoured Coffee, Soft Drinks, Alcoholic Beverages Processed Milk,Spreadable Fats (Butter and Cheese), Yoghurt Ready to Eat Meals Ready to Eat Meals
- 9. 9 FAD: The Golden Business Horizon RNCOS Business Consultancy Services 1.2 INDUSTRY OUTLOOK After China, India is the world’s second largest food produc-er with the potential to be the biggest, backed by its food and agricultural sector. The total food production in India is likely to double in the next 10 years with the country’s do-mestic food market estimated to reach US$ 258 Billion (INR 15,48,000 Crore) by 20153. With an expansive agricultural sector, copious livestock, and cost efficacies, India is swiftly emerging as a sourcing hub for processed food. Food processing sector is one of the crucial segments of the Indian economy. Growing at a rate of 12% annually, it is anticipated that the food processing industry of India will transcend INR 16,50,000 Crore mark, owing to the rise in middle class income, changing urban lifestyle and modern retail trade. Moreover, the advancements on the technology front, people seeking more nutritional food products with variety, and the limited time availability due to fast paced life has further provided tailwind to the food processing sector. The export value in the food processing sector has been witnessing an escalating trend with CAGR of around 48% for three years ending 2013-14. The value of APEDA product exports during 2013-14 was calculated to have touched INR 1,36,920 Crore. With the surging investment in food processing, various government initiatives, demand for processed foods, meliorated income levels, and bilateral trade agreements, the exports of APEDA products is likely be fueled further in years to come. Figure 1-2: India - Food Processing Industry (INR Crore), 2012, 2015, & 2020 Source: ICAR, RNCOS Note: e = ICAR Estimates; f = RNCOS Forecast Exchange Rates: 2012: US$ 1 = INR 54.85; 2015 & 2020: US$ 1 = INR 60.00 1,164,000 CAGR = 12% 663,685 1,650,000 2012 2015e 2020f Exports 3 India in Business, Ministry of External Affairs
- 10. FAD: The Golden Business Horizon 10 RNCOS Business Consultancy Services Figure 1-3: India - Export of APEDA Products (INR Crore) 2010-11 to 2013-14 Table 1-1: India - Exports of APEDA Products by Categories (2013-14) Source: DGCIS Source: DGCIS 136,920 42,438 83,485 118,255 2010-11 2011-12 2012-13 2013-14 CAGR = 48% The exports of cereals claimed roughly 46% share in the total, while animal product exports constituted over 1/5th in the total value of exports. Cereals and animal products witnessed the highest export growth over the past few years whereas the nega-tive growth of other processed foods depict that the demand for such products had declined internationally. In value terms, Basmati Rice, Meat & Preparations, Non-Basmati Rice, Guargum, and Wheat were the top 5 exported commodities. In FY2011, the top country claiming highest share in the APEDA products export was UAE followed by Saudi Arabia and US with shares worth 12%, 11%, and 8% respectively. The scenario changed in FY2014, as Iran, Vietnam, and US constituted the top three countries with highest shares of 10%, 9%, and 9% respectively. Saudi and UAE drifted to 4th and 5th slot with 8% and 6% shares respectively. In FY2014, the major items exported to the top 3 destinations included basmati rice, buffalo meat, and guargum. It is anticipated that the export to the middle east and other south east Asian nations is likely to increase due to their proximity to India. Category Value (INR Crore) CAGR (2011-12 to 2013- 14) Floriculture 866.5 15% Fresh Fruits & Vegetables 8,760.0 35% Processed Fruits And Vegetables 6,483.8 20% Animal Products 32,288.6 46% Other Processed Foods 25,068.2 -5% Cereals 63,452.1 44% Grand Total 1,36,920.1 28%
- 11. 11 FAD: The Golden Business Horizon RNCOS Business Consultancy Services Figure 1-4: Top Exporting Countries for APEDA Products from India (%), 2013-14 Source: DGCIS Iran USA Vietnam UAE Malaysia Benin Others Saudi Arab Bangladesh Indonesia Egypt 10% 9% 9% 8% 6% 4% 5% 2%2% 3% 42% In FY2014, import of APEDA products reached INR 22,178 Crore, growing at a CAGR of nearly 15% during the cited time interval. Since, India is now intently focused on food sector with National Mission on Food Processing. Such initiatives have ex-pedited India close the gap between food demand-supply, thereby impacting imports positively. The very fact itself will reduce India’s dependence on imports in the years to come. Imports Figure 1-5: India - Import of APEDA Products (INR Crore), 2010-11 to 2013-14 Source: DGCIS 22,178 14,562 17,979 22,679 2010-11 2011-12 2012-13 2013-14 CAGR = 15%
- 12. FAD: The Golden Business Horizon 12 RNCOS Business Consultancy Services Table 1-2: India - Import of APEDA Products by Categories (2013-14) Source: DGCIS In 2013-14, processed fruits and vegetables accounted the highest import share followed by other processed food items. Cere-als and animal products claimed the lowest shares with 0.6% and 1.6% respectively. The negative growth in animal products highlight that the demand for these products had declined in India, which in turn, had impacted imports. Cereals were the fastest growing imported commodities in terms of CAGR. In value terms, alcoholic beverages and pulses were the top imported commodities, with the former recording a persistent increase in values over the past two fiscals. In FY 2011, Myanmar accounted for nearly 18% of the total APEDA product imports, followed by Canada and US with shares worth 15% and 8% respectively. However, in FY2014, Canada overtook Myanmar, accounting for approximately 21% share, while Myanmar accounted for 13% followed by US at 9%. The major commodities imported from the top 3 countries included pulses and alcoholic beverages in FY2014. Figure 1-6: Top Importing Countries for APEDA Products in India (%), 2013-14 Source: DGCIS Canada United Kingdom Myanmar Afghanistan United States Nepal China Pakistan Australia Russia Others 21% 13% 9% 5% 6% 3% 3% 3% 2% 6% 29% Category Value (INR Crore) CAGR (2011-12 to 2013- 14) Floriculture 561.62 12% Fresh Fruits & Vegetables 4,133.96 28% Processed Fruits And Vegetables 11,626.8 8% Animal Products 344.56 -49% Other Processed Foods 5,377.41 15% Cereals 133.2 93% Grand Total 22,177.55 10%
- 13. 13 FAD: The Golden Business Horizon RNCOS Business Consultancy Services In the food processing industry, Foreign Direct Investment (FDI) is permitted for all the processed food products up to 100% in late 2012 on automatic route except for items held in reserve for MSMEs subject to applicable laws/regulations and other conditions. The food processing sector of India has been growing faster than the agriculture and manufacturing sectors. The Indian retail market, currently estimated at US$ 490 Billion (INR 29,40,000 Crore), is projected to grow at a CAGR of 6% to reach US$ 865 Billion (INR 51,90,000 Crore) by 20234. In food and grocery retail, the opportunities are huge, on account of the fact that it constitutes nearly 69% of India’s total retail market5. The major FDI forays in the India food processing industry are listed below: • Major multinationals like Nestle, PepsiCo, Coke, Kel-logg’s, Heinz, Perfetti, GlaxoSmithKline, Ajinomoto, Nissin Met, and Le Bon have established their presence and several others are in the pipeline. • Apart from the domestic giants like ITC, Dabur, Godrej, Britannia and Parle, other conglomerates including Reli-ance, Bharti, Tata, Wipro and Thapars are also planning to make a foray in this field and will attract FDI. Investment & Employment Figure 1-7: India - FDI Inflows in Food Processing Industry (INR Crore) 2007-08 to 2013-14 Source: Department of Industrial Policy and Promotion (DIPP) CAGR = 112% 25,106.8 2,193.7 279.0 455.6 1,314.2 858.0 826.2 2007-08 2008-09 2009-10 2010-11 2011-12 2012-13 2013-14 4 7th Food and Grocery Forum India; The Hindu Business Line 5 7th Food and Grocery Forum India; The Hindu Business Line
- 14. FAD: The Golden Business Horizon 14 RNCOS Business Consultancy Services In employment terms, Food Processing Industry (FPI) is one of the major employment intensive industries resulting in an over 12% of employment generated in all Registered Factory sectors in 2011-12. As per the Annual Survey of Industries (ASI), during 2011-12, the total number of personnel work-ing in the registered food processing sector was around 1.8 Million. It is anticipated that such employment will grow at a CAGR of around 6% till FY2020. Below mentioned are some of the major employment drivers: • Increased FDI for food processing industry’s infrastruc-tural expansion; • Intensive industrial development programmes initiated by the government (e.g. food parks, abattoirs etc.); • Inclination towards technological advancement lead-ing to creation of more job opportunities in R&D and processing units; • Focus on the extension of government facilities to the unorganized food processing segment; • Various workshops for HR development which in turn is preparing people for entry into food processing sector. Figure 1-8: India - Employment in Registered Food Processing Units (Million), 2007-08 to 2011-12 & 2019-20 Source: Annual Survey of Industries (ASI); MOFPI; RNCOS Note: f = RNCOS Forecast CAGR = 4% CAGR = 5.6% 2.75 1.78 1.66 1.51 1.56 1.61 2007-08 2008-09 2009-10 2010-11 2011-12 2019-20f
- 15. 15 FAD: The Golden Business Horizon RNCOS Business Consultancy Services 1.3 GOVERNMENT INITIATIVES The NMFP programme was approved by the Government of India with an outlay of INR 1,600 Crore in the 12th plan for the period 2012-17, with the share of central govt. being INR 1,250 Crore and rest of state government. The alloca-tion of funds for development of food processing industries is INR 770 Crore for 2014-15. The schemes of Mega Food Parks, Cold Chain and Modernization of Abattoirs have been further up-scaled during the 12th Plan. 12 new Mega Food Park projects, 75 Cold Chain projects and 50 Abattoir pro-jects have been approved for implementation during the 12th Plan to attract more investment in this sector. The government made these budgetary allocations for establishing and upgrading the FPI and its infrastructure. Melioration in the FPI infrastructure is poised to curtail wastages and enhance value addition to end products. Under this mission, several schemes were undertaken, some of which are described below6: Scheme for Technology Upgradation/Establishment/ Modernization of Food Processing Industries7 Objective: To provide financial assistance for establishing new food processing units as well as technological aug-mentation and expansion of the existing units Figure 1-9: NMFP Spending Share for 12th Plan Source: Ministry of Agriculture; Department of Agriculture and Cooperation; Directorate of Economics and Statistics National Mission on Food Processing (NMFP) Central Govt. State Govt. 22% 78% Scheme’s Outcome: Under this scheme in the 11th Plan, a total allocation of INR 600 Crore was provided and roughly 3,229 Food Processing Units were assisted. This scheme has added substantial capacity to the food processing industry which in turn has resulted in significant reduction of wastag-es. The scheme has since been transferred to the states with the launching of National Mission on Food Processing (NMFP) on 1.4.2012. Mega Food Parks Scheme (MFPS)8 Objective: To facilitate the establishment of a strong food processing industry backed by an efficient supply chain, which would include collection centres, primary processing centers and cold chain infrastructure. Scheme’s Outcome: Under this scheme, the grant-in-aid is utilized for creating common infrastructure in Central Process-ing Centre (CPC) and Primary Processing Centres (PPCs) in the park. Out of 30 Mega Food Parks proposed during the 11th plan, the Ministry has taken up 15 projects under the Scheme so far. Final approval has been accorded to 15 Mega Food Parks in the states of Andhra Pradesh, Punjab, Jharkhand, Assam, West Bengal, Uttarakhand, Tamil Nadu, Maharashtra, Gujarat, Uttar Pradesh, Madhya Pradesh, Tripura, Orissa, Bihar and Karnataka. The total assistance from the government to these projects is estimated at INR 750 Crore. In addition to these, 15 new Mega Food Parks have been recently approved by the Government. 6 Ministry of Agriculture; Department of Agriculture and Cooperation; Directorate of Economics and Statistics 7 Ministry of Agriculture; Department of Agriculture and Cooperation; Directorate of Economics and Statistics 8 Ministry of Agriculture; Department of Agriculture and Cooperation; Directorate of Economics and Statistics
- 16. FAD: The Golden Business Horizon 16 RNCOS Business Consultancy Services Scheme for Cold Chain, Value Addition and Preserva-tion Infrastructure9 Objective: To provide value addition and preservation infrastructure facilities without any split, for perishable items from the farm to the end-consumer. Scheme’s Outcome: The scheme It covers pre-cooling facili-ties at production sites, reefer vans, mobile cooling units as well as value addition centres, which include infrastructural facilities like Processing/Multi-line Processing/ Collection Centres, etc. for horticulture, organic produce, marine, dairy, meat and poultry, etc. The ministry approved 10 inte-grated cold chain projects in 2008-09, which are already be-ing implemented in different parts of the country. Out of the 10 projects, 9 have started commercial operation. 146 new proposals have been received, which are under evaluation. Modernization of Abattoirs10 Objective: To establish modern abattoirs and moderniza-tion of existing abattoirs Scheme’s Outcome: The scheme is implemented under the collaboration of local bodies including Municipal Corporations and Panchayats/PSUs/Co-Operatives/Boards under Government and has flexibility for involvement of private investors on PPP basis. The ministry has approved 10 projects in first phase which are at various stages of progress. Two projects have been completed. Figure 1-10: India - Number of Integrated Cold Chain Projects Approved till Date under Different Phases Source: Ministry of Agriculture; Department of Agriculture and Coop-eration; Directorate of Economics and Statistics 10 28 25 1st Phase 2nd Phase 3rd Phase (upscaled) Initiatives for Human Resource Development Extensive training and entrepreneurship development are given top priority for sustained growth in the food processing sector. Below listed are some of the initia-tives driving HR development: • Creation of infrastructural facilities for running de-gree/ diploma courses in food processing (maximum grant INR 75 lakh per project). Around 34 such projects were approved in the 11th Plan. • Entrepreneurship Development Programmes (EDP) promoted with maximum grant of INR 2 lakh per Programme. A total of 994 EDPs were assisted dur-ing the 11th Plan. • Food Processing Training Centres (FPTC) established with maximum grant of INR 4 lakh/INR 15 lakh per project for single line/multi line products. Nearly 159 Centres were assisted in the 11th Plan. • Training in food processing at recognized national/ state-level institutes, etc. provided, with sponsor-ship by MoFPI or other institutions. Quality Assurance, Codex Standards and R&D, and Promotional Activities In order to gain a competitive edge on the global scale, quality and food safety standards need to be at par with international level. Under the scheme for Food Safety Codex and R&D, some of the successful implementa-tions are mentioned hereunder11: • Installation/up gradation of Food Testing Laborato-ries; 29 projects were assisted in the 11th Plan • Implementation of HACCP/ISO/GMP/ GHP/Safety Management system in food processing units; 20 Projects were assisted in the 11th Plan • R&D in Food Processing Sector; 50 projects were assisted in the 11th Plan • In order to promote R&D activities, MoFPI through FICCI holds regular workshops for industry-academ-ia collaboration 9 Ministry of Agriculture; Department of Agriculture and Cooperation; Directorate of Economics and Statistics 10 Ministry of Agriculture; Department of Agriculture and Cooperation; Directorate of Economics and Statistics 11 Ministry of Agriculture; Department of Agriculture and Cooperation; Directorate of Economics and Statistics
- 17. Agribusiness at the core includes the business of crop production, agrichemicals, farm machinery, breeding, distribution, processing, and seed supply, while also incorporating marketing and retail sales. The agriculture sector is one of the most critical components of the Indian economy, supporting a significant share of India’s workforce. The agribusiness sector continues to be the foremost largest contributor to the Indian economy despite the fact that its share in GDP has plummeted since the country’s independence. Agriculture is a vital link in the supply chain of the manufacturing sector, and plays a crucial role in the development of the country. A few of the major agricultural crops produced in India include coarse cereals, rice, pulses, oilseeds, cotton, jute, and sugarcane, among others. AGRI-BUSINESS 2.1 INDUSTRY OUTLOOK Table 2-1: India - Agriculture GDP at Factor Cost (at 2004-05 prices), 2009-10 to 2013-14 Source: Central Statistics Office (CSO) Note: * = First Revised Estimates, # = Second Revised Estimates, ^ = Third Revised Estimates, PE = Provisional Estimates 2009-10 2010-11^ 2011-12# 2012-13* 2013-14 (PE) Total GDP (INR Crore) 47,90,847.0 52,82,386.0 56,33,050.0 58,99,847.0 61,95,842.0 Share of Agriculture 14.6% 14.6% 14.4% 13.9% 13.9% Growth of Agri-GDP 0.8% 8.6% 5% 1.4% 4.7% 2 17 FAD: The Golden Business Horizon RNCOS Business Consultancy Services
- 18. FAD: The Golden Business Horizon 18 RNCOS Business Consultancy Services Given the significance of the agriculture sector, the Indian Government is offering various schemes and incentives to stakeholders. Over the past few years, Indian agriculture sector has seen tremendous increase in production of food grains, oil seeds commercialized crops, fruits, vegetables, poultry and dairy. Holistically, agriculture and agri-based products have claimed to be the major consumption category in India. Moreover, India is one of the major re- exporters of cashews and spices in the world. In FY 2014, sugarcane claimed the highest share in agricul-ture production volume accounting for over 1/2 of the total while cereals and pulses constituted nearly 43% collectively. The total production of major crops including jute, cotton, and mesta stood at 6,55.3 Million Tonnes in 2013-14 as per advance estimates. Of the major eatable crops, sugar cane has been growing at the fastest pace with a CAGR of over 4% during the past 10 years. Among the oilseeds, groundnut, rapeseed, and mustard claimed the highest share. On the other hand, in case of cereals, Rice and Wheat accounted for a major share with over 106 Million Tonnes and 95 Million Tonnes respectively. Figure 2-1: India - Production Volume Share of Major Crops (%), 2013-14 Source: Agricultural Statistics Division; Directorate of Econom-ics & Statistics; Department of Agriculture & Cooperation; Fourth Advance Estimates of Production of Foodgrains for 2013-14 Sugarcane Pulses Cereals Cotton Oilseeds Jute & Mesta 37.5% 5.0% 2.9% 0.9% 0.3% 53.4% Crops & Seeds
- 19. 19 FAD: The Golden Business Horizon RNCOS Business Consultancy Services India marked a persistent increase in the imports of fruit and vegetable seeds from countries including Thailand, US, Tai-wan, New Zealand, and Italy; although the quantity of seeds imported has been continuously declining in case of Thailand. Egypt claimed the highest share with volume worth 5,067 Tonnes. Imports from China have plummeted significantly, marking a decline of nearly 59% in FY2014 as compared to FY2012. Moreover, it was observed that the import volume of respective commodity from China plummeted significantly by 972 Tonnes to nearly 72 Tonnes in 2013-14. In value terms, the exports to countries including US, Bangla-desh, Thailand, Kenya, France and Japan have been persis-tently increasing. Although in FY2014 Pakistan topped the charts in volume terms with 6,421.43 Tonnes and INR 68.58 Crore. Bangladesh was the second highest holder in volume terms at 4,681.9 Tonnes. Country Import Export Qty (Tonnes) Value (INR Crore) Country Qty (Tonnes) Value (INR Crore) Thailand 166.93 93.07 Pakistan 6,421.43 68.58 Chile 97.91 75.54 United States 173.65 42.98 Egypt 5,067.00 46.35 Bangladesh 4,681.93 40.68 United States 453.92 43.19 Netherland 105.54 35.46 China 72.38 32.44 Italy 1,623.18 28.93 Taiwan 9.17 29.43 Thailand 48.07 22.94 Italy 395.82 24.76 Japan 187.99 20.74 New Zealand 861.62 15.44 Singapore 59.12 14.74 France 93.61 13.17 Kenya 57.12 10.66 Korea 84.18 13.04 France 65.45 10.55 Table 2-2: Top Import and Export Countries for Fruit & Vegetable Seeds (2013-14) Source: DGCIS The global cultivated area for GM crops expanded persistently through 2013, although at a modest pace of roughly 3%. Global cultivation acreage under GM crops rose to 175.2 Million hectares in 2013, nearly 5 Million hectares more than the previous year, according to the International Service for Acquisition of Agri-Biotech Applications (ISAAA). India has left past Canada, uprising as the 4th largest country to cultivate biotech or GM crops in 2013 as farmers planted Bt cotton in about 11 Million hectares. The US claimed the largest share in GM crops, accounting for approximately 40% of the total planted area world over. On one hand, country like Egypt has stopped the cultivation of GM crops, curtailing the total number of countries cultivat-ing them to 27, whilst on the other hand; countries such as Canada marked a decline in the area under the cultivation. Genetically Modified (GM) Crops
- 20. FAD: The Golden Business Horizon 20 RNCOS Business Consultancy Services In India, Bt Cotton is the only GM crop permitted for legal commercial liberation. Post protest by farmers and civil society organizations, a cessation on bt brinjal production was decreed in February 2010 by the Environment Minister Jairam Ramesh. The government had subsequently called for conducting scientific study and drawing a consensus on the respective issues. Heated discussions have been raging in the country over the GM crops introduction, with some pro-GM agricultur-ists quoting it as crucial to the resolution of the country’s food security issue, while others vehemently opposed it. In a recent move, the Ministry of Environment and Forests (MoEF) in July cleared field trials for 15 GM crops, including major crops such as rice, chickpea, brinjal and mustard, among others. The Genetic Engineering Approval Committee (GEAC) working under the purview of MoEF, has cleared nearly 60 proposals for the GM crops at different stages of trial, so far, in 2014. Although the respective trials have been put on hold by Bharatiya Janata party-led government. The move reverses the previous Congress party-led government’s push for GM trials, which had resulted in approvals in the past few months for rice, maize, wheat and chickpea crops. Table 2-3: Global - GM Crop Cultivation (Million Hectares), 2010-2013 Source: Clive James, ISAAA *Includes 22 other countries 2010 2011 2012 2013 Crops US 66.8 69 69.5 70.1 Maize, soyabean, coon, sugarbeet, papaya, squash, canola Brazil 25.4 30.3 36.6 40.3 Soyabean, maize, coon Argenna 22.9 23.7 23.9 24.4 Soyabean, maize, coon India 9.4 10.6 10.8 11 Coon Canada 8.8 10.4 11.6 10.8 Canola, maize, soybean, sugarbeet China 3.5 3.9 4 4.2 Coon, papaya, poplar, tomato, sweet pepper Total* 148 160 170.3 175.2 Developing nations planted more GM crops than their devel-oped ones, the second consecutive year with farmers in Latin America, Asia and Africa cultivating in 54% of the 175 Million hectares. Bangladesh approved the commercial planting of Bt brinjal, while the situation in Egypt put planting on-hold, pending a Government review. Panama and Indonesia were two other nations that approved cultivation of biotech crops12. About 18 Million farmers planted biotech crops in 2013 compared to 17.3 Million in 2012. Besides economic gains, farmers benefited enormously from at least a 50% reduction in the number of insecticide applications13. 12 ISAAA 13 ISAAA
- 21. 21 FAD: The Golden Business Horizon RNCOS Business Consultancy Services 2.2 GOVERNMENT INITIATIVES Year of Origin: 2010 (continuation of the Micro Irrigation Scheme which was initiated in March, 2005-06) Management: Central Government Objective: To increase the coverage of area under micro irriga-tion for improving crop productivity with efficient use of water resources Scheme’s Outcome: NMMI promotes drip and sprinkler technologies for supplying water at the root zone as per requirement. By the end of 2011-12, about 3 Million hectares of land has been covered under drip sprinkler irrigation. Micro Irrigation (MI) also arrests water logging and secondary salinization problems of the canal command areas and checks the receding water table and deteriorating water quality in the well command areas. The estimated potential of Micro/Sprin-kler Irrigation Technology in the country is 27 42.5 Million hectares, respectively. Year of Origin: 2008-09 Management: Government of India Objective: To promote soil test based on balanced use of chemical fertilizers organic nutrients for improving soil fertility Scheme’s Outcome: The two existing schemes namely: i) Centrally sponsored scheme of Balanced and Integrated Use of Fertilizers; and ii) Central Sector Scheme, “Strengthening of Central Fertilizer Quality Control Training Institutes and its Regional Labs” have been subsumed in the new scheme w.e.f. 1.4.2009. The components of the new scheme include setting up 500 new soil testing laboratories, strengthening the existing 315 soil testing laboratories, setting up 250 mobile soil testing laboratories, pro-motion of organic manures, soil amendments and distribution of micro nutrients, setting up 20 new fertilizers quality control laboratories and strengthening 63 existing fertilizer quality control laboratories during the 11th Plan15. Year of Origin: 2007 Management: Government of India Objective: To introduce technological components including farm machines/implements as well as improved variants of seeds, soil ameliorants, plant nutrients and plant protection measures Scheme’s Outcome: Through NFSM, 25 Million Tonnes of additional food grain was produced in the 11th Plan. The following are the major achievements of the initiative16: National Mission on Micro Irrigation (NMMI)14 Integrated Nutrients Management (INM) National Food Security Mission (NFSM) 14 Ministry of Agriculture (Dept. of Agri. Cop.) 15 India.gov.in 16IBEF
- 22. FAD: The Golden Business Horizon 22 RNCOS Business Consultancy Services • Implemented in about 312 districts, spread across 17 states • Wheat production increased from 71.3 Million Tonnes in FY07 (terminal year of 10th plan) to 80.3 Million Tonnes in FY10 • Rice production increased from 89.4 Million Tonnes in FY07 to 99.2 Million Tonnes in FY09; however, it declined to 87.6 Million Tonnes in FY10 • Pulse production increased from 13.6 Million Tonnes in FY07 to 14.7 Million Tonnes in FY10 • Different districts were able to increase the food basket of the country Year of Origin: 2007 Management: Government of India Objective: To encourage states to increase public investment in agriculture and allied services Scheme’s Outcome: RKVY was launched in the 11th Plan with an outlay of INR 25,000 Crore17 against a backdrop of faltering agriculture growth in the previous decades. It was designed as a State Plan Scheme with complete flexibility to the States to choose projects specifically tailored to their conditions for generating growth in agriculture and allied sectors. Some sub-schemes under RKVY are as follows: • Green revolution in the Eastern region • Initiative on vegetable clusters • Nutri-cereal production • National Mission for Protein Supplements initiative • Accelerated Fodder Development Programme • Rain fed Area Development Programme • Saffron Mission Year of Origin: 2004 Management: TCIL and Department of Agriculture Coop-eration Objective: To make agriculture/agronomics knowledge available to farmers free of cost, as and when desired Scheme’s Outcome: The Kisan Call Centre is one of the best applications of ICT in agriculture. The18 scheme is available PAN India. The Call Centres can be accessed by farmers all over the country on common Toll Free Number 1551. The calls are received at 13 Call Centres wherein 116 Agricul-ture Graduates attend the queries of farmers in their local languages. On the other hand, 123 experts located in dif-ferent parts of the country at State Agriculture Universities, ICAR institutes, State Department of Agriculture, Horticul-ture and other departments answer the calls at Level–II. An advance MIS system captures the entire background of advisory services and at the same time provides backend data support to the knowledge workers. Rashtriya Krishi Vikas Yojana (RKVY) Kisan Call Centre (KCC) 17 Ministry of Agriculture; Department of Agriculture and Cooperation; Directorate of Economics and Statistics 18 Department of Agriculture Cooperation
- 23. 23 FAD: The Golden Business Horizon RNCOS Business Consultancy Services Year of Origin: 2002 Management: Government of India through National Institute of Agricultural Extension Management (MANAGE) and National Bank for Agriculture and Rural Development (NABARD). Objective: To strengthen the extension services and tap the potential of unemployed agriculture graduates in order to provide them self-employment opportunities Scheme’s Outcome: The programme aims to tap the expertise available in the large pool of Agriculture Graduates. National Institute of Agricultural Extension Management (MANAGE)19 coordinates and implements the training and handholding sup-port through a network of 72 Nodal Training Institutes (NTIs) identified through a well designed process of screening and assessment. NABARD looks after the credit part of the scheme by refinancing agri-business loans granted by commercial banks to trained graduates, and release of subsidy thereon. Ever since its inception, a total of 29,413 candidates have been trained under the scheme. Year of Origin: 1990s Management: Government of India Objective: To maximize crop protection with minimum input costs, and balance ecological equilibrium Scheme’s Outcome: As of now, there are 31 Central Integrated Pest Management Centres (CIPMCs) located across 28 States and one Union Territory. At national level, the impact of IPM has been observed through the following indicators: • Increase in crop yield from 6.72% to 40.14% in rice and from 22.7% to 26.63% in cotton in IPM fields compared to non- IPM fields; • Chemical pesticide spray was found to have reduced to the extent of 50% – 100% in rice and 29.96% – 50.5% in cotton in IPM fields compared to non-IPM fields; • Net gain in farm income of farmers was found to have increased in the IPM fields as compared to that of farmers using indigenous practices; • Use of biopesticides/neem-based pesticides increased from 123 Tonnes during 1994-95 to 8,110 Tonnes in 2011-12, while the consumption of chemical pesticides in the country reduced from 75,033 Tonnes (Technical Grade) in 1990-91 to 50,583 Tonnes (Technical Grade) in 2011-12 Year of Origin: 1999-00 Management: Government of India; Agriculture Insurance Company of India Ltd. (AICI) promoted by General Insurance Com-pany (GIC) and National Bank for Agriculture and Rural Development (NABARD) Objective: To provide a measure of financial support to the farmers in the event of crop failure Agri-Clinics and Agri-Business Centres Integrated Pest Management (IPM)20 Crop Insurance21 19 Ministry of Agriculture; Department of Agriculture and Cooperation; Directorate of Economics and Statistics; Vikaspedia 20 Ministry of Agriculture; Department of Agriculture and Cooperation; Directorate of Economics and Statistics 21 Agriculture Insurance Company of India Ltd.
- 24. FAD: The Golden Business Horizon 24 RNCOS Business Consultancy Services Scheme’s Outcome: The central sector National Crop Insurance Programme (NCIP) that replaced the National Agricultural Insur-ance Scheme (NAIS) from November 1, 2013 has three components: Pilot Modified National Agricultural Insurance Scheme (MNAIS), Pilot Weather Based Crop Insurance Scheme (WBCIS), and Pilot Coconut Palm Insurance Scheme (CPIS). The NCIP is approved for full-fledged implementation from the Rabi 2013-14 season. The Agriculture Insurance Company (AIC) imple-mented MNAIS and WBCIS in many districts and developed crop insurance products for risk mitigation associated with various crops, namely coffee, rubber plantation, bio-fuel plants, grapes, mango, and potato; along with Rabi Weather Insurance and Varsha Bima/Rainfall Insurance. Table 2-4: MNAIS and WBCIS Implemented in Districts/States during Kharif 2013 and Rabi 2013-14 Source: Department of Financial Services Kharif 2013 Rabi 2013-14 Districts States Districts States MNAIS 29 13 127 12 WBCIS 112 13 123 14 The major activities of Agricultural Extension include assess-ment, refinement and demonstration of technology/products through a network of Krishi Vigyan Kendras (KVK). There are 44 Agricultural Technology Information Centres (ATIC) estab-lished under ICAR institutes and State Agricultural Universities. There is one National Research Centre for Women in Agricul-ture (NRCWA) located in Bhubaneswar (Orissa). Achievements • Established a network of over 637 Krishi Vigyan Kendras (KVK). • Conducted 4,189 on-farm trials of 537 technologies to identify their location specificity under different farming systems. • Organized 53,974 Frontline Demonstrations (FLD) to demonstrate the production potential of newly released production technologies on the farmers’ fields. • Trained more than 1.0 million farmers and extension per-sonnel in agriculture and allied fields. • Conducted large number of extension activities benefiting about 4.19 million farmers and other end users. • Enable production of more than 82,000 qt. of seeds and 10.2 million sapling/seedlings/livestock strains, besides various bio-products for availability to the farmers. • Identified gender issues in agriculture at the National Research Centre for Women in Agriculture. • Continued functioning of 44 Agricultural Technology Information Centres in ICAR institutes and SAUs. • Organized 334 interface meetings involving scientists and development officials at the district level. Agricultural Extension by ICAR22 22ICAR (Agriculture Extension Division)
- 25. The Dairy sector in India has grown substantially over the years. As a result of prudent policy inter-vention, India ranks first among the world’s milk producing nations. Termed as the “Amul model”, India’s dairy sector is structured into a three-tier system which is followed by the dairy co-operatives. The three-tier structure has the Dairy Co-operative Societies (DCS) at the village level, a milk union or district union at the district level, and a federation of member unions at the state level. About 15.1 Million farmers have been brought under the ambit of 1,55,634 village level dairy corporative societies up to March 201323 . The most notable success chronicle in India’s dairy development history is of dairy cooperatives. The vanguard is Gujarat Cooperative Milk Marketing Federation (GCMMF), the farmers milk cooperatives’ apex body24. It markets dairy products produced by its member cooperatives under the brand name Amul and Sagar. Milk from 15,301 village dairy cooperatives is sourced wherein over 3 Million farmers gather their milk produce. Amul has long been dedicated to providing best prices to its member producers for their milk and at the same time providing value for money to its consumers. Amul is also developing a wide range of products to meet future demand, including calcium fortified milk, flavored yoghurt, frozen yoghurt, sugar free ice-cream and pro-biotic products. In order to keep up with the ever increasing market and production base, GCMMF has planned an investment corpus of US$ 600 Million (INR 3,600 Crore) for milk processing and village level infrastruc-ture enhancement over next 5 years. The cooperatives form a part of a national milk grid that links milk producers throughout India with consumers in over 800 towns and cities, and bridges seasonal and regional variations in this union. Up to 31st March, 2014, plans of about 100 dairy cooperatives with a total outlay of INR 2,898 Crore had been approved by NDDB25 . Due to non-utilization of the approved financial assistance by dairy cooperatives, the financial outlay approved under Perspective Plan stands revised to INR 1,952 Crore, of which NDDB’s financial assistance is to the extent of INR 1,479 Crore. DAIRY 3.1 INDUSTRY OUTLOOK 3 23 Department of Animal Husbandry, Dairying Fisheries 24 Dairy Tech. India 25 Department of Animal Husbandry, Dairying Fisheries 25 FAD: The Golden Business Horizon RNCOS Business Consultancy Services
- 26. FAD: The Golden Business Horizon 26 RNCOS Business Consultancy Services It’s been 6 years over a decade since India has displaced the US as the world’s largest milk producer. India has soared beyond the collaborated might of EU countries with its milk production touching a 140 Million Tonnes mark in 2013-14. The y-o-y growth of India’s milk production reached about 6% in FY2014, which is well over double that of the global growth26. Various Government initiatives have been under taken to augment the productivity of livestock, which has resulted in increas-ing milk production significantly from a level of 102.6 Million Tonnes at the end of the-Tenth Plan (2006-07) to 127.9 Million Tonnes at the end of the 11th Plan (2011-12). Milk production in the beginning of the 12th Plan (2012-13) was 132.43 Million Tonnes with an annual growth rate of 3.54%. According to NDDB, the projected milk demand for FY2022 is likely to reach 200 Million Tonnes driven primarily by the grow-ing population, higher personal household incomes and more health consciousness among Indian food/beverages connoisseurs leading to greater interest in nutrition. Consumption of processed and packaged dairy products is skyrocketing in urban areas. Figure 3-1: India - Milk Production (Million Tonnes), 2009-10 to 2013-14 Figure 3-2: India - Projected Milk Demand (Million Tonnes), 2016-17 2021-22 Source: DAHD (2009-10 to 2012-13); Indian Express (2013-14) Source: National Dairy Development Board (NDDB) 127.9 140 116.4 121.8 132.4 2009-10 2010-11 2011-12 2012-13 2013-14 CAGR = 4.7% 155 200 2016-17 2021-22 26 Indian Express
- 27. 27 FAD: The Golden Business Horizon RNCOS Business Consultancy Services 3.2 GOVERNMENT INITIATIVES The government of India is intently working towards the fortification of the dairy sector through varied developmental schemes. After merger of four ongoing schemes namely Inte-grated Dairy Development Programme (IDDP), Strengthening Infrastructure for Quality Clean Milk Production (SIQ-CMP), Assistant to Cooperatives (A to C) and National Project for Cat-tle Buffalo Breeding (NPCBB), a new Scheme titled “National Programme for Bovine Breeding and Dairy Development” (NPBBDD) was launched on 27th February, 2014. That scheme provided a budgetary provision of INR 1,800 Crore for the project implementation during the 12th Plan. NPBBDD has two components: (a) National Programme for Bovine Breeding (NPBB) and (b) National Programme for Dairy Develop-ment (NPDD) Objective of the National Programme for Dairy Development are: • To create and strengthen infrastructure for production of quality milk including cold chain infrastructure linking the farm-ers to the consumers; • To create and strengthen infrastructure for procurement, processing, and marketing of milk; • To create training infrastructure for dairy farmers; • To strengthen dairy cooperative societies/producers/companies at village level; • To increase milk production by providing technical input services like cattle feed and mineral mixture etc; • To assist in rehabilitation of potentially viable milk federations/unions. Year of Launch: 2010 Grant: INR 1,400 Crore (12th Plan) Management: NABARD Objective: To promote private investment in dairy sector for increasing the milk production and helping in poverty reduction through self-employment opportunities Scheme’s Outcome: The DEDS is being implemented through NABARD, which provides financial assistance to commercially bankable projects, with loans from Commercial, Cooperative, Urban and Rural banks with a back ended capital subsidy of 25% of the project cost to the beneficiaries of general category and 33.33% of the project cost to SC ST beneficiaries. Since in-ception, against the total release of INR 724.70 Crore, NABARD has disbursed INR 677.05 Crore as back ended capital subsidy to the beneficiaries for setting up of 186,325 dairy units up to 31st March, 2014. Dairy Entrepreneurship Development Scheme (DEDS)
- 28. FAD: The Golden Business Horizon 28 RNCOS Business Consultancy Services Year of Launch: 2003 Grant: INR 346.94 Crore Management: Central Government Objective: To improve the quality of milk milk products in the domestic market and to increase the export of milk products Scheme’s Outcome: Under the scheme, there is a provision for training of farmers on good milking practices, setting up Bulk Milk Cooler (BMC) at the Dairy Cooperative Society level and strengthening laboratories for testing of milk. The scheme has been implemented through the District Level Coop Milk Unions/ State Level Co-op Milk Federations28. Since inception, the Department has approved 176 projects spread over 22 States and one UT with a Central share of INR 289.96 Crore till 31.03.2014. Out of total 176 projects, 111 projects have been completed and remaining 65 projects are at various stages of implementation. An amount of INR 234.55 Crore has been released upto FY2014 for the implementation of approved projects. About 7.24 lakh farmer members have been trained, 2,271 Bulk Milk Coolers (BMCs) with a total milk chilling capacity of 47.47 lakh litres installed and 1,796 existing laboratories strengthened. Year of Launch: 1999-00 Grant: INR 310.91 Crore Management: Government of India, NDDB Objective: To revitalize the sick dairy cooperative unions at the district level and cooperative federations at the state level Scheme’s Outcome: The-rehabilitation plan was prepared by the NDDB in consultation with the concerned State Dairy Federa-tions and District Milk Unions. Since inception, the Department has approved 42 rehabilitation proposals of Milk Unions so far in Madhya Pradesh, Chhattisgarh, Haryana, Karnataka, Uttar Pradesh, Kerala, Maharashtra, Assam, Nagaland, Punjab, West Bengal and Tamil Nadu. It provides grants in-aid on a 50:50 sharing basis between the Central and State Governments to loss making Milk Unions. Year of Launch: 1993-94 Grant 31: INR 275 Crore Management: Government of India Objectives32: • Developing milch cattle and Increasing milk production by providing technical input services; • Creating infrastructure to improve procurement, processing and marketing of milk in a cost effective manner; • Ensuring remunerative prices to milk producers by strengthening dairy cooperative societies at village level; • Generating additional employment opportunities; and • Improving social, nutritional and economic status of residents of comparatively disadvantaged areas. Strengthening Infrastructure for Quality Clean Milk Production27 Assistance to Cooperatives29 Intensive Dairy Development Programmed (IDDP)30 27 Department of Animal Husbandry, Dairying Fisheries 28 The scheme has been subsumed under the new scheme titled “National Programme for Bovine Breeding and Dairy Development” approved on 19.12.2013 29 Department of Animal Husbandry, Dairying Fisheries 30 DAHD 31 The Scheme is being continued from the 11th plan with a total plan outlay of Rs.275.00 Crore and as a merged scheme together with ‘CMP’ 32 DAHD
- 29. 29 FAD: The Golden Business Horizon RNCOS Business Consultancy Services Year of Launch: 2011-12 Grant: INR 2,242 Crore Management: International Development Association, End Implementing Agencies, NDDB, and Govt. of India Objective: To increase the productivity of milch animals; provide more revenues to small milk producers; and upgrade milk processing plants in cooperatives and private sectors. Scheme’s Outcome: NDP-I focusing on meeting the projected national demand for milk of over-150 Million Tonnes by 2016- 17. Given the swiftly escalating demand for milk, priority in NDP-I is allocated to areas with elevated potential in the chief 14 milk producing States which constitute nearly 90% of India’s total milk production; i.e. Uttar Pradesh, Punjab, Haryana, Guja-rat, Rajasthan, Madhya Pradesh, Bihar, West Bengal, Maharashtra, Karnataka, Tamil Nadu, Andhra Pradesh, Orissa and Kerala. These states are eligible for funding under various components based on the eligibility criteria which will comprise geographi-cal, technical, financial and governance parameters. The National Dairy Development Board (NDDB) and other departments of the ministry like Animal Husbandry, Dairying Fisheries are focusing on increasing the animal population, production and productivity as a thrust area, offering financial assistance to the organizations and departments working in the dairy sector. National Dairy Plan- Phase 1 Scheme’s Outcome: In Non-Operation Flood, Hilly and Backward Areas, the scheme was launched in 1993-94 on 100% grant-in- aid basis. In March 2005, the scheme was modified, named as Intensive Dairy Development Programme (IDDP). Since its inception, 114 projects have been approved. Out of these 114 projects, 60 are under implementation and 54 projects have been completed. A total of 261 districts are covered in 27 States and one UT with a total outlay of INR 702.68 Crore till 31.03.2013. A total sum of INR 535.47 Crore has been released to the concerned state governments and milk unions/milk federations for implementation of projects up to 31.03.2013.
- 30. One of the major industry defining trends that could be observed in the dairy industry include the entry of corporate in this segment. Since the opportunities are huge, many companies are foraying the industry. For example, ITC is going to set up dairy plants across six states- Bihar (the first plant will be commis-sioned in Munger), Uttar Pradesh (possibly in Saharanpur), Punjab (Kapurthala), Maharashtra, Andhra Pradesh and Telangana. The first dairy product planned to be launched by the end of this year, is expected to be ghee, which would probably be followed by milk powder. Another big player, Cavin recently launched its ‘milkshake,’ in the northern states, which does not require a cold-chain for distribution. The company is also exploring possibilities of exporting its dairy products to the neighboring countries like Singapore, Malaysia and Indonesia. At present, the com-pany owns two facilities – in Kanchipuram and Erode. It is in talks with co-operatives in Dindigul and Pollachi of Tamil Nadu for exploring the expansion opportunities. TRENDS TECHNOLOGY RNCOS Business Consultancy Services 4.1 PRIVATE PLAYERS FORAYING DAIRY SEGMENT 4 FAD: The Golden Business Horizon 30
- 31. 31 FAD: The Golden Business Horizon RNCOS Business Consultancy Services 4.2 DAIRY SECTOR: WITNESSING TECHNOLOGY REVOLUTION India is currently the largest producer of milk in the world and is self-sufficient. India is going through winds of change on account of meliorated milk availability, globalization, and the entry of the private sector in the dairy industry. Value addition and variety creation in milk products is now the country’s key agenda. Traditional products claim a significant share in the dairy industry revenue; although these products have lim-ited shelf-life. Now, with the advent of novel milk processing technologies, the sector is poised to gear up. Below mentioned are some of the technologies which are poised to tailwind the industrial growth: Ultra high temperature (UHT) processing and Aseptic Packaging UHT treatment is a process of high bactericidal effect, devel-oped as a continuous flow process in which the milk is heated at 135°C–150°C for about two seconds only. This treatment must be integrated with aseptic packaging in sterile containers. Aseptically packaged UHT milk can be kept for several months provided the package is not opened. It is considered as the most important innovation in dairy products in the last half-century. It was popularized in India with the success of fruit juices, drinks and milk such as Amul Taaza. Scraped Surface Heat Exchangers33 With the innovation of Scraped Surface Heat Exchangers, the Indian traditional sweet products are now smoothly manu-factured. The exchangers are used for Heating, Cooling, Aseptic Cooling, Deep Cooling, Crystallisation, Tempering, Steriliza-tion, Pasteurization, Polymerization, Gelling, Slush Freezing etc. of various products, such as fruit, dairy, egg products etc. On account of this technology only, in India, about 15 plants have initiated industrial ‘Khoa’ production by means of continuous khoa making machines with a daily output of 1 to 4 Tonnes. Super Heated Water Spray Sterilizer Membrane Processing A novel method of sterilization devised is “Super Heated Water Spray Sterilizer” that is used for heat sensate products. This sys-tem is suitable for rapid heating and rapid cooling to produce heat liable milk products. On the other hand, the membrane pro-cessing technology has gained momentum over conventional processes. The membrane separation technology seems a logical choice for the fractionation of milk, because many milk components can be separated by size (Brans et al., 2004). Membrane technology has revolutionized the dairy sector. Different types of membranes are used in the industry for various purposes like in clarification of milk, increasing the concentration of the selected components as well as separation of the specific valuable components from milk or dairy by-products. 33 Food Processing Industry in India: ST Capability, Skills and Employment Opportunities (Mohammad Rais, Shatroopa Acharya and Neeraj Sharma)
- 32. FAD: The Golden Business Horizon 32 RNCOS Business Consultancy Services 4.3 INCREASING MECHANIZATION IN AGRICULTURE Access to sufficient farm power is very critical for time-bound farm operations, enhancing land and labour efficiency, augment-ing production and productivity, and curtailing crop produce losses. Farm mechanization also deals with the issues of scarcity of farm labour during peak agricultural seasons. It’s been observed that farm power availability and food-grain yield have a direct relationship. The adoption of agricultural mechanization in India is increasing continuously. It is clear that the country is experiencing rapid growth in the use of tractors while the use of combine harvesters and threshers is also showing steady growth. India is the largest manufacturer of tractors in the world. The production of tractors in India stood at 5,79,000 units in 2012-1334. Moreover, power tillers are becoming popular in the lowland flooded rice fields and hilly terrains. The rising concerns over natural resources, notably land and water, has further necessitated switching over to machine assisted resource conservation techniques such as zero-tillage, raised-bed planting, precision farming, etc. Recognizing the need to spread the benefits of agricultural mechanization among all strata of farmers, the Department of Agriculture Cooperation is integrating the components of agricultural mechanization under various schemes and programmes through the promotion of ‘Custom Hiring Centres’ for agricultural machinery. 578.7 639.9 548.4 436.9 607.7 590.7 545.1 440.3 2009-10 2010-11 2011-12 2012-13 Producon Sales Figure 4-1: India - Tractors’ Production and Sales (‘000 Units), 2009-10 to 2012-13 Source: Tractor Manufacturers Association (TMA) 34 Tractor Manufacturers Association (TMA)
- 33. 33 FAD: The Golden Business Horizon RNCOS Business Consultancy Services 4.4 RISING ORGANIC FOOD INDUSTRY The benefits of organic produce in terms of health and nutrition are well known. Currently, India ranks No.10 among the top ten countries for cultivable land under organic certification. The certified area includes 15% cultivable area with 0.72 Million hectares and rest 85% (3.99 Million hectare) is forest and wild area for collection of minor forest produces. The total area under organic certification is 4.72 Million hectare (2013-14)35. Considering the opportunity, the India government is promoting production of organic crops, fruits and vegetables through various schemes viz. National Horticulture Mission (NHM), Rashtriya Krishi Vikas Yojana (RKVY), National Project on Organic Farming (NPOF), Network Project on Organic Farming under Indian Council of Agricultural Research (ICAR) and various schemes of APEDA. The Government of India has also implemented the National Programme for Organic Production (NPOP). India produced around 1.24 Million Tonnes (in 2013-14) of certified organic products which includes all varieties of food prod-ucts. Among all the states, Madhya Pradesh has the largest area under organic certification followed by Rajasthan and Uttar Pradesh. India exported 135 organic products, in 2013-14, of a total volume of 194,088 Tonnes including 16,322 Tonnes of organic tex-tiles. The organic agri-export realization was around US$ 403 Million (INR 2,418 Crore), including US$ 183 Million (INR 1,098 Crore) of organic textiles, thereby registering a 7.73% growth over the previous year. Organic products are exported to EU, US, Switzerland, Canada, South East Asian countries and South Africa36. Organic products, which until now were mainly getting exported, are now finding more consumers in the domestic market. The major share of this demand for organic products in India comes from tier-1 cities including Delhi, Mumbai, Bangalore, Chennai, Pune, and Gurgaon. Nearly 62% of high income households prefer organic products due to rising awareness, higher disposable incomes and easier availability in the market, as per ASSOCHAM survey. 35 APEDA 36 APEDA
- 34. FAD: The Golden Business Horizon 34 RNCOS Business Consultancy Services 4.5 FROZEN FOODS: GAINING PROMINENCE 4.6 COMMODITY TRADING: HEDGING FOR FARMERS The growing demand for a ‘quick tasteful’ meal in India is fueled by urbanization, lifestyle changes, and the surfacing of ‘mall culture’. Experience of vivid food trends transcend-ing traditional cuisines has augmented the craving for food variety amongst Indian food connoisseurs. Following this, the Indian food industry now uses ‘Frozen Foods,’ which can be effortlessly customized to suit the new palate, without spend-ing much time, and are available at all times of the year. It is now perceived as a means of replacing labour and effort. Notably, data released by India’s Ministry of Food Processing indicate that in terms of product categories, Frozen Vegeta-bles and Frozen Snacks together make up a more than 65% share of the market and their collective volume consumed in 2012 exceeded 85%. The frozen food market is dominated by organized players, e.g. Mother Dairy, which is prominent with around 50% market share in the vegetables segment as a result of the widespread popularity of its Safal brand. The other major brands in the market are Venky’s (V.H. Group), Al-Kabeer (Al-Kabeer Group), Sumeru (Innovative Foods), Everfresh (Temptations Foods), Meatzza (Darshan Foods), and McCain Foods (McCain Foods India). The introduction of products more friendly to the Indian palate, such as the ‘Idli Sambar’ Combo by McCain, is expected to be a boost for further similar offerings. In the Indian domain, commodities have become an es-tablished asset class over the last few years. While ‘futures trading’ is relatively new to the Indian commodity markets, the global commodity futures exchanges have been function-ing for several decades. The transparent price mechanism, risk management, low margins, benefits to farmers by way of price clarity and an organized marketplace has attracted investors in the commodity trading. Other than these, com-modities also offer a different investment avenue, are less volatile when compared with equities and bonds, are a highly liquid asset class and offer investors an opportunity to gain from price movements in the commodity space37. For instance, a farmer growing soybean is exposed to risk of price fall when his harvest is done. Using futures market, he can sell the soybean contract today at the futures platform and lock the price which could eliminate his risk from price fluctuations. Further, farmers sometimes go for distress sale during the harvest time due to lack of storage facilities. Using the futures platform, farmers can store their produce in the exchange designated warehouse till the time their produce fetches reasonable returns38. The Forward Markets Commission (FMC), the regulator for the commodity futures market, was brought under the administrative control of the Ministry of Finance in September 2013. Currently, only 46 of the 113 commodities that are notified for futures trading are actively traded in 6 National Exchanges and 11 Commodity Specific Exchanges. Futures trading in agricultural commodities constituted 15.8% of the total turnover in 2013-14, with food items (refined soya oil, soyabean, chana, rapeseed/mustard seed, and coriander) contributing 55.56%, and nonfood items (castor seed and cotton) 17.46%. The total volume of trade declined 39%, and that of agri trade about 18% in 2013-14 over 2012-13. Information asymmetry is a major market barrier. In order to benefit all stakeholders in the agriculture supply chain, and especially to enable farmers to take rational and informed de-cisions about cropping patterns and marketing strategies, the FMC is implementing the Price Dissemination Scheme. Under this, the futures and spot prices of National Exchanges and the spot prices of AGMARKNET from around 1,700 mandis are run on real-time basis on price tickers/boards installed in 267 APMCs, KVKs, and other locations where farmer footfall is high39. 37 Economic Times 38 Economic Times 39 Economic Survey 2013-14
- 35. 35 FAD: The Golden Business Horizon RNCOS Business Consultancy Services 4.7 SURGING ICT APPLICATIONS IN AGRICULTURE The Indian economy is agriculture driven, and farmers not just want to fetch bread for their families, but also surplus food production that can be sold in the market for profit making. In order to expedite the farmers in realizing their require-ments, several novel concepts and theories that substitute traditional methods have been implemented. One of them includes the introduction of Information and Communication Technology (ICT), which enables the propagation of indispen-sable information at the most apt time. An ICT-enabled system links the farmers with the food retail-ers through a system which sends out orders, verifies the receipt of orders by suppliers, fixes the schedule of delivery, and provides data on sales to enable inventory management. The farmers can have access to the database pertaining to retailers’ shelves and also upload their stock positions of commodities available. The retailers’/consumers’ choice of various categories/ brands/varieties can also be known to the producer groups. Some initiatives in India that use ICT for agricultural development are listed below: Table 4-1: India - Agri-ICT Projects Source: ICT Initiatives in Indian Agriculture; Chitra B.M, Shankaraiah Organizaon Programme Central Government Sponsored Department of Agriculture and Co-operaon’s Naonal Agriculture Technology Project AGMARKNET Community Informaon Centres Warana Wired Village Project of Maharashtra: Applicaon of satellite communicaon for training field extension workers in rural areas (Indian Space Research Organisaon) State Government Sponsored Rajasthan Janmithra Madhya Pradesh Gyandoot Andhra Pradesh e-Seva (Computer-Aided Online Registraon Department), Karnataka Bhoomi (Land Record Computerisaon), Raitha Samparka Kendra Online, Markeng and CAD in Northern Karnataka Tamil Nadu Rasi, Miyams Karchipular Gujarat Seva (Automated Milk Collecon Centres of Amul dairy cooperaves) Maharashtra Setu, Online Complaint Management System - Mumbai Kerala E-Srinkala Corporate Sector Sponsored ITC-IBD E-Choupal EID-Parry (Nagarjuna group of companies) ikissan Kendra, Tata Chemicals Chirag Kendra Thompson Reuters Reuters Market Light (RML) IFFCO and Bhar Airtel IFFCO Kisan Sanchar Limited (IKSL) OneWorld.net with British Telecom and Cisco Lifelines IIT Bombay with Media Lab Asia aAqua (Almost All Quesons Answered) Non-Government Organizaons And Other Private Sector Organizaons Informaon Village Research Project in Pondicherry Agriwatch.com Drish.com Tarahaat.com by Development Alternaves Mahiz-samuha VOICES by Madhyam Communicaons
- 36. To harmonize Indian food regulations as per international standards, the Food Safety and Standards Act (FSSA) was brought in place. It established the new national regulatory body, the Food Safety and Standards Authority of India (FSSAI), which consolidates various acts orders that have hitherto han-dled food related issues under various Ministries and Departments. FSSAI has been created for laying down scientific standards for articles of food and to regulate their manufacture, storage, distribution, sale and import to ensure availability of safe and wholesome food for human consumption40. Various central Acts like Prevention of Food Adulteration Act, 1954; Fruit Products Order, 1955; Meat Food Products Order, 1973; Vegetable Oil Products (Control) Order, 1947 etc. were repealed after com-mencement of the FSS Act, 2006. FAD REGULATORY PURVIEW RNCOS Business Consultancy Services 5 • Framing of regulations to lay down the standards and guidelines in relation to articles of food and specifying appropriate systems for enforcing various standards • Laying down mechanisms and guidelines for accreditation of laboratories/certification bodies engaged in certification of food safe-ty management system for food businesses • Providing technical support to Central and State Governments in the matters of fram-ing policies and rules in areas which have a direct or indirect bearing of food safety and nutrition • Collecting and collating data regarding food consumption, incidence and prevalence of biological risks, contaminants in food, residues of various contaminants in foods products, identification of emerging risks and introduction of rapid alert system • Creating an information network across the country so that the public, consumers, Panchayats etc. receive rapid, reliable and objective information about food safety and issues of concern; • Providing training programmes for persons who are involved or intend to get involved in food businesses; • Contributing to the development of interna-tional technical standards for food, sanitary and phyto-sanitary standards41. Food Safety Standards Act, 2006 Mandate: 40 FSSAI 41 FSSAI FAD: The Golden Business Horizon 36
- 37. 6 INDUSTRY ROADBLOCK The Indian FP industry is short of suitable infrastructure such as adequate grading and packaging cen-tres, fully equipped cold chains/warehouses, upgraded abattoirs etc. A start-to-end completely auto-mated supply chain solution linking the agro products’ producers to end consumers is absent. This has resulted in huge losses and wastages for the food producers and processed food at different strata. The cold chain development in India is in nascent stage. Since the services are not integrated, due to frequent handling and transfer, it leads to significant wastage and damage to the food stored therein. There are limited specialized distribution companies offering refrigerated transport and warehousing for perishable processed/non-processed food items. The major hindering factors in the adoption of cold chain facilities are high costs and lack of knowledge technical skills required for conceptualiza-tion and execution. Limitations on the front of sufficient space at the distributors’ end are also a hindrance for frozen food companies. India is a tough market to operate in, bearing in mind that each operator must have a separate cold room and 24-hour uninterrupted supply of electricity. ICT Implementation Quandaries Although several initiatives by the public and private sectors have been undertaken for implementing ICT in the agribusiness domain for educating and catering to the information needs of farmers across seven lakh villages in India still, not all of them have been successful to a large extent. The major fac-tors hindering the implementation include: Under Developed Cold Chain 37 FAD: The Golden Business Horizon RNCOS Business Consultancy Services
- 38. FAD: The Golden Business Horizon 38 RNCOS Business Consultancy Services • Insufficient power and infrastructure availability in rural areas; • ICT illiteracy; • Non-availability of timely relevant content; • Non-integration of services; • Poor advisory services and lack of localization; and • Non-availability of agricultural information kiosks/knowl-edge centres at the grass root level Moreover, farmers sometimes become reluctant to technol-ogy adoption as they perceive them as loss of their traditional cropping methods. There is a need to win their confidence and create awareness about the benefits of ICT in agriculture. Soaring Food Inflation India’ granaries continue to be flooded, but containing the food inflation has proved to be a task. It averaged 8.1% in the last decade and over 10% in recent times, despite the fact that agricultural growth surged to 3.6% in the past 10 years from 2.9% in the decade before. Food inflation is among the biggest hurdles to be tackled and is a top priority for the Indian government. Not to mention, there is a seasonal element as well which impacts the food inflation. The food inflation for July 2014 came in at 9.36%, as against the 7.97% in June 2014. Moreover, during the past few years, prices of items including milk milk products, egg, fish and meat have soared drasti-cally as their supply fell short of demand. The production of milk and eggs has risen only 3-4% a year, compounded annually, during 2009-10 to 2012-13, while inflation in this category has gone up 14-15% a year. Changing India’s farm-to- fork game is, therefore, the toughest predicament for the new government in its battle with food inflation42. Middleman Distorting the Price The Agricultural Produce Market Committee Act (APMC), put in place to help farmers sell their produce in the market, has actually left them vulnerable to price manipulation by traders and agents. Commission agents, which help farmers sell their produce to traders and the government, are driven by the incentive to maximize the number of transactions they undertake rather than getting the highest price for the farmer. The produce typically goes through 3-4 layers of mid-dlemen before reaching the consumer, with each layer adding a mark-up leading to the final price. The higher the number of middlemen, the lower is the price the farmers get. Thus, layers of intermediaries and wastage lead to an increase in inflation43. 42 Indian Express 43 CRISIL Research
- 39. CLOSING THE GAP: PATH AHEAD 7 Growth in food processing, agri-business and dairy sector is poised to open up a lot of opportunities. Substantial investment opportunities are yet to be explored in the areas of supply chain management, cold storages, financing, retailing and exports. In olden times, agriculture, dairy and FPI have been marred by factors like low investment levels, deprived infrastructure, inadequate credit availability and high degree of fragmentation. However, in the past few years, there have been commendable meliora-tions on almost all the fronts. Below mentioned are some of the initiatives that the presidium must take in order to further boost the industry’s growth in the near future: Efficient Use of Food Grain Stocks: This requires government to focus on liquidating the excess food grain stock through proper channels that will help appease inflation and meet the growing demand. Between 2004-05 and 2013-14, the government’s annual buffer carrying costs have shot up 52%. This means it (government) must put a check on farmers’ hoardings and offload the excess supplies in the market at the apt moment so that inflation can be curtailed and export opportunities promoted. Focus on Dairy/Poultry/Fish Supply Improvement: The de facto as per the 12th Plan document by the Planning Commission is that the demand for protein foods is anticipated to increase 18% over the next three years (by 2016-17) over 2011-12 output. So it can be well perceived that their prices will keep treading up until and unless the government focuses on animal husbandry and dairy development and boosts their supply. 39 FAD: The Golden Business Horizon RNCOS Business Consultancy Services
- 40. FAD: The Golden Business Horizon 40 RNCOS Business Consultancy Services Capitalizing on Whey Extracts: In India, ‘whey’ is obtained during the manufacture of paneer, chhana, casein and shrikhand. It has been estimated that about 1 Million Tonnes of whey is annually derived as a by-product, which possesses about 70,000 Tonnes of nutritious solids. In India, whey obtained as a by product is mostly thrown away as waste. Whey can be converted into a range of products viz. whey powder and lactose, high protein whey powder, whey protein concentrate, granulated high protein whey powder etc. These products can be used in infant foods, weaning foods, bakery products, confectionery prod-ucts, dairy products etc44. Utilization on such a scale can ease the mounting food scarcity in India. Creation of Robust Cold Chain/Supply Chain Network: Estab-lishing a firm and sound logistics framework is imperative to curtail the post-harvest losses, particularly of perishables. Last fiscal, for every INR 100 worth of wheat and rice bought, the government incurred an additional cost of INR 51 and INR 66, respectively, towards procurement costs (including state taxes), and storage and distribution45. According to CRISIL estimates, the improvement in the supply chain can bring down inflation by 20%. Indian Government needs to devise novel strategies, and work closely with third party cold chain operators to develop better cold storage sys-tems, ensuring better conditions of warehouses by employing sophisticated refrigerated transportation systems so as to avoid food wastage. In the respective direction, the agriculture ministry on 11th September 2014, launched a call-in facility to expedite smoother transportation of perishable goods across the country. The call-in portal - Reefer Vehicle Call-in-Centre (RVC) - will serve as a single point telephonic contact for recording all forms of in-transit bottlenecks including extortion, transit delays and any kind of harassment. This toll free call-in facility will be available to all transport operators of horticultural, pharmaceutical, livestock, dairy and other refrigerated goods. Encourage RD for Improving Yields and Curtailing Wastage: India is in a dire need for accelerating RD and modern technology adoptions in agriculture, dairy and food processing. For instance, at the production stage, it is critical to counter the scarcity of resources including land and water, speedily deteriorating soil quality, among others. On the other hand, at the processing stage, small scale and unorganized sectors, which claim a major portion of the food processing industry, call for focused programs for ameliorating productivity, technology access, and fluidic availability of credit. All these measures will increase output and subdue wastage and nutrition losses throughout the production and processing stages. Creation of Food Testing Facilities: Since a lot of attention is given to the hygiene and quality factors of food, food testing is one of the major avenues where the potential is still untapped. As India moves forward towards adopting international stand-ards of food processing and other related activities, food testing laboratories come in play as stringent measures need to be adopted for approving food items fit for human consumption. Promote GM RD in Agriculture: Bt. cotton is the only GM crop being cultivated in India. Considering the successful cultiva-tion of Bt cotton, which resulted in more than 50% reduction of insecticide usage on cotton and about 30-60% increase in productivity over 10 years, and the absence of any credible scientific evidence of any negative bio-safety effects, a positive view could be taken for GM crop research and development in India46. This therefore, suggests that RD in agriculture, specially in GM crops must be encouraged with inclination towards second generation of increased nutritional and/or industrial traits such as easy processing. 44 FnB News 45 CRISIL Research 46 Ministry of Agriculture
- 41. 41 FAD: The Golden Business Horizon RNCOS Business Consultancy Services Create Financial Instruments for Farm Machinery Procurement: Farm mechanization is gaining pace in Indian agriculture. So, to ensure adequate deployment of farm machines available to the farmers at affordable costs, Farm Machinery Banks can be established for facilitating the hire/purchase of farm machines and equipments. This, in addition to augmenting power availability, will also assist the removal of disparity in farm power availability among different states, and subdue the drudgery associated with several farm operations. Give Away the APMC Act: It is suggested that the APMC Act should be done away with altogether, with specific delisting of fruits and vegetables from the APMC. This can help curtail the prices as also expedite the development of agricultural product market as farmers will get the opportunity to trade transparently with private players. Further, it will cut-short the role of mid-dlemen thereby improving the farmers’ profit margins47. Leverage PPPs for Farm Extension Services: The Government, in India, plays a vital role in various food chains including the perishables via its farm extension services leveraged to farmers. While this has had positive impact in many areas, there still ex-ist gaps in quality and availability of farm services. The heavily dispersed farmer population is hard to reach and their informa-tion requirements vary considerably. Moreover, there are performance and accountability issues in the existing mechanisms. So, to overcome these hurdles, govt. must encourage PPP which can augur the efficacy of such services, wherein these services are financed by government and delivered through private enterprises or NGOs. Enhance Transparency of Price, Volume and Inventory in Wholesale Markets: The very action holds true for food items, primarily fruits and vegetables, sold via government regulated Mandis. There are various aspects that need to be taken care of, especially transactions coverage and data reliability. In such a scenario, IT can come handy. Better knowledge of volume and inventory data can expedite accurate price estimations and reduce opportunities for collusion. 47 CRISIL Research
- 42. FAD: The Golden Business Horizon 42 RNCOS Business Consultancy Services About ASSOCHAM
- 43. 43 FAD: The Golden Business Horizon RNCOS Business Consultancy Services About RNCOS Strategic Consulting Business Support Services Identification of Business Opportunities Business Research Services • Market Entry Strategies • Growth Consulting Services (New Mar-kets, Customers, Geography / Demogra-phy) • Pre-testing and post launch evaluation • Concept and Product Testing • Business Setup Support / Strategies and Planning for Start-ups • Phone Consultations/ Expert Recruitment for Industry Insights • Lead Generation • Setting up of Dealer Distributor Network • Set up a representative office in any par-ticular geography. • Capturing and increasing market shares • Identifying potential clients • Competitive Intelligence Services • Location Consulting Service • Report Writing Services • Region / Country Analysis • Sector / Industry Briefings • Technology Reports • White Papers Business Consulting Services firm offering a broad spectrum of Management Consulting and Business facilitation services including but not limited to Financial Business Assessment, Market Entry / Expansion Strategies, Market and Industry Research, Identification Selection of Business Partners, Feasibility and Facility Location Studies etc. Since our inception in 2002, we have been offering research solutions to distinguished clientele’ across multi geographies and industry verticals. We help our clients in achieving sustainable performance and better growth prospects by weeding out their obsolete business process with well laid strategies by working in close co-ordination with them. Address: B 129, Sector 6, Noida, Uttar Pradesh India - 201301 Phone: +91 120 4224700 /01 / 02/ 03 E mail: shushmul@rncos.com Website: www.rncos.com RNCOS Business Consultancy Services
- 44. All reports purchased directly through us or our authorized reseller’s are subject to the following disclaimer. Purchase of any report auto-matically indicates approval of this disclaimer. Before making any purchase, all intended recipients should go through the report summary/ synopsis and brochure which is available on our company’s official website. Recipients can drop an e-mail for any further clarification of their queries related to the report that they intend to buy. All the information that is present in our reports is collected from paid databases, publicly available data (e.g. media releases, websites and annual reports, etc.) as well as from the interviews of the industry experts, which we believe are reliable, i.e. through Primary and Second-ary Research. Our Analyst ensures the accuracy of the report information by validating it to all possible sources available. However, it is subject to fluctuation. RNCOS takes no responsibility for any incorrect information supplied to us by manufacturers or users or the experts of the industries interviewed or the incorrect information on the other company’s website or Government sites. The estimates, forecasts and projections included in the reports are subject to a number of risks, uncertainties and assumptions. Actual results may differ materially from those projected because of the market fluctuations and other uncontrollable market conditions. The opinion articulated in the reports is completely based on the current market trends, which are subject to change with the change in market dynamics from time-to-time. We assert that any business or investment decisions should not be made solely based on the information presented in our reports. The information in our reports should be interpreted as indicative guidance only. We strongly suggest to all our users to take proper expert suggestion for their betterment. We, to the fullest extent permitted by law, make no warranty (express, implied or otherwise), or assume any legal liability or responsibility for the accuracy, completeness, reliability and usefulness of this information. Unless otherwise stated, the copyright, database rights, and other similar rights of this publication are solely owned by RNCOS. You are permitted to print or download extracts from this material for personal use only. None of this material may be used for any commercial or public use without the written permission of RNCOS. Disclaimer
- 46. PREMIUM CASHEWSRoasted Salted, Masala, Caramel280g 125g Cans 80g 20g Pouch Packs Roasted Salted 280g Can 200g Pouch Pack 1. Roasted Salted, 2. Caramel3. Paprika Garlic, 4. Pepper Chilly 280g 125g Cans 80g Pouch Packs Snacksfor every occasions75g Pouch Pack PREMIUMe-mail: info@tkmagro.com