Booking open Available Pune Call Girls Wadgaon Sheri 6297143586 Call Hot Ind...
Eco notes
1. Monopoly
A market structure where there exists just one seller of a particular good. This market structure is the opposite
of a perfectly competitive market.
The assumptions that are required for a monopoly to hold are as follows:
1. A single firm controls the output of the entire industry - this ensures that this firm is a price maker and sets
the price that maximises their profits.
2. There are significant barriers to entry - the presence of these barriers ensures that the monopoly power of
the firm is protected, as no other firm can enter the industry.
If a firm operates in an industry where these conditions are met it creates a monopoly market structure.
However, a monopoly is more of a theoretical market structure as there are very few practical examples of one
firm controlling an entire market (pure monopoly). Often the theory of a monopoly is important to assess the
impact of one large firm dominating several small firms.
Just like under monopolistic competition, the monopolist faces a downward sloping demand curve (AR) as
they are the only seller in this particular market, rather than the perfectly elastic demand curve under perfect
competition. However, in the case of the monopolist, this is also the market demand curve as this is the only
firm supplying this type of product to the market. It is this unique feature in monopoly markets that grants the
monopolist a large degree of monopoly power. The monopolist profit maximises at the point where MR=MC,
but because of the significant monopoly power, the price that they charge is represented by the price they can
set according to the demand curve for that specific quantity of goods. The monopolist can do this because the
monopoly power makes them a price maker. Because of the fact that the AR curve is higher than the AC curve
for the monopolist at this point, it creates the conditions for the monopolist to extract supernormal profits from
the market. In the long-run the monopolist outcome is unchanged as the presence of significant barriers to
entry prevent new competitors from joining the market and stealing the supernormal profits available.
2. It is important to consider that this outcome is all based on the assumption that there exists significant barriers
to entry in the market for the situation of supernormal profits to hold in the long-run.
However, the level of supernormal profits a monopolist receives will be subject to changes in market
conditions such as the level of demand for the good. For instance, monopolists are price makers and therefore
set their own prices and the demand curve determines how much output will be sold on the market at that
price. A monopolist does not have the ability to set both the price and quantity of output. If the demand curve
shifts inwards or the average costs of production for a firm increase, then this will reduce the level of
supernormal profits belonging to the monopolist. If market conditions go against that of a monopolist and
causes the firm to make economic losses in the short-run, then in the long-run the firm will leave the market
and as the firm is the only firm in the market, the market will cease to exist in the long-run. This means that
monopolists have to adhere to the standard shut-down points of all other firms.
An interesting analytical point to raise when talking about monopolies is the comparison against a perfectly
competitive market structure. This is because a monopoly is at the opposite end of the market structure
spectrum when compared to perfect competition. When compared to this market structure the market
equilibrium is more inefficient and results in lower welfare than compared to a perfectly competitive market
because of the fact that monopolists are price makers. The optimal output level for monopolists is below that
of a perfectly competitive market, as they set a higher price to maximise profits. As a result, this means that
producer surplus increases because of the higher price and consumer surplus decreases due to the higher price.
However, as the loss of consumer surplus is larger than the gain in producer surplus, there is an overall dead
weight loss triangle created. Under a perfectly competitive market, social welfare is maximised as a result of
producing at the point of allocative efficiency. Therefore monopolists reduce the overall level of social welfare
in the economy, which is often why they are perceived as bad for an industry.
3. In terms of efficiency, monopolies are both allocatively and productively inefficient. It is productively
inefficient because the monopolist does not produce at the minimum of the average cost curve. This is because
the monopolist profit maximises and that production point corresponds to an average cost that is above the
minimum, resulting in productive inefficiency. As for allocative efficiency, the monopolist has significant
monopoly power, so it sets a price above the marginal cost and the allocative efficiency condition of P=MC is
not met.
However, the question over whether a monopoly leads to dynamic efficiency is uncertain. The answer to this
question identifies whether a monopoly market structure is better or worse than perfect competition and this is
the key evaluation point to mention regarding monopolies. The reason for the uncertainty, is it all depends on
what type of industry the monopolist operates in (the scope and importance of innovation and invention in the
market) and whether dynamic efficiency can be easily achieved and whether from the monopolists perspective
it is rewarding to invest and innovate.
For instance, the monopolist may be more dynamically efficient than perfectly competitive markets, if the
monopolist uses the supernormal profits made in the short and long-run to invest research and development
projects. By doing so, this will encourage innovation and invention into the production process, create X-
efficiencies and improve the productively efficient point for the firm. In terms of the impact on a modern
developed economy, if sustained it will increase the productive capacity of the economy and may even
encourage other firms to become more dynamically efficient. This is most likely to be the case in industries
where innovation and invention is required to continue to yield profitable results for the monopolist i.e.
technology driven industries such as the upcoming driver less car market.
However, there is a fear that monopolists may be encouraged reap the supernormal profits made and without
the fear of new competition coming in, divert those profits as dividends to investors and shareholders,
increasing the shareholder return on the company instead of investing in research and development projects.
The monopolist can do this because of the presence of significant barriers to entry. If this is the case then the
4. market becomes dynamically inefficient and the outcome is worse than perfect competition. This occurs in
industries where the rewards for innovation and invention are minimal e.g. service providers such as barber
shops.
Despite all these problems with a monopolist, there may well be an advantageous case for one firm to control
the entire infrastructure of an industry, as some markets involve significant initial infrastructure costs which
would be unnecessary to duplicate. Therefore, to avoid these costs it is beneficial for the market to become a
monopoly. This allows the monopolist to take advantage of the large economies of scale present, than have lots
of smaller firms inefficiently compete over the market, raising costs and prices in the process. This is an
example of a natural monopoly.
Monopoly Power
The ability of a single firm to influence an entire market. In this type of market structure monopoly power
allows the monopolist to restrict output and become price makers i.e. price above the marginal cost.
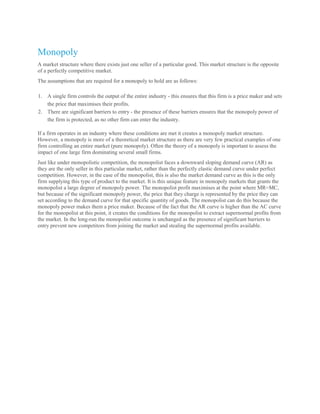
5. Natural monopoly
A market where there is only room for one firm to operate due to substantial capital requirements or 100%
ownership of a key resource. There are very few remaining examples in the UK due to the break up and
privatisation of state monopolies since WW2. It an also be graphically represented by the minimum efficient
scale being large relative to the size of the market and therefore only one firm to be able to reach the MES.
Below is a diagram to show how a natural monopoly rises in a market. In this instance only one firm is able to
reach the MES point to fully exploit all the economies of scale in the market. To break up this natural
monopoly, more competition needs to be added. But with that extra competition comes higher average costs,
reduced average costs and as a result higher prices for consumers as the diagram shows. So in many cases a
natural monopoly is often beneficial for a market from both consumers and producers point of view.
Pure monopoly
A market that is un-competitive as it consists of just a single firm. Very few remaining examples in the UK
due to the break up and privatisation of the post war state monopolies.
6. Perfect competition
Is a market structure that describes the conditions required for intense competition to take place amongst firms
in an market. This market structure is a contrast to a monopoly market.
The assumptions that are required for perfect competition to hold are as follows:
1. Large number of buyers and sellers in the market.
2. No individual firm has significant market power to influence the market price - this outcome means that
all firms are price takers and have to sell at the prevailing market price.
3. All firms sell a homogeneous products - the products that firms are selling are identical in terms of their
product characteristics. This creates a horizontal (perfectly elastic) demand curve as all products that firms
produce and sell are perfect substitutes for each other.
4. Freedom of firms to enter and exit a market - any firm can enter the market to enjoy profits as there are no
barriers of entry present. However, firms can also freely leave the market costlessly if they are making a
loss due to no barriers to exit being present. It is this assumption of freedom of entry and exit which means
firms in this type of market structure will always make normal profits in the long-run.
5. Perfect knowledge available to all firms - sellers have perfect knowledge regarding their competitors and
possible technological improvements available to the market and consumers have perfect knowledge of all
firms prices and therefore will never buy the good at a higher price than at the market price. This
assumption reinforces the prevailing market price that all firms must 'take'.
6. Perfect mobility of factors of production - factors (e.g. labour and capital) can move from one production
process to another to help complete different types of work.
If firms operate in a market where all of these conditions are met it creates an environment of perfect
competition. However, perfect competition is often discussed as being just a theoretical model of competition
as a result of the unrealistic assumptions that are required to hold e.g. can a market ever have a situation of
perfect knowledge across all firms and consumers?
Therefore, despite having a minimal role in terms of practical application, this model of competition is used as
a comparison tool against other and more inefficient market structures such as a monopoly or oligopoly. This
is because perfect competition leads to an efficient outcome in the long run in which social welfare is
maximised, due to firms producing at the point that is allocatively and productively efficient. Therefore, the
theory of perfect competition is a good evaluative tool in itself to use as a benchmark to assess the market
outcomes from other types of market structure.
A perfectly competitive firms demand curve is perfectly elastic (horizontal) at the prevailing market price, this
means two things. First of all the firm can sell as a high quantity of the product they are producing as they
want, without impacting the market price. But, the firm has to sell the quantity at the market price otherwise
the demand for their product drops to zero. This is because consumers have perfect knowledge about other
alternative sellers prices and will always buy the same product from the cheapest possible location.
However, when graphically representing the perfect competition market structure for individual firms and the
market in general it is important to consider the time horizon that firms are operating in. This is because the
efficient outcome of perfect competition is only guaranteed in the long-run. In the short-run, firms produce at
the profit maximisation point (P=MC), which can either be above, below or equal to the average cost of
production. This means that firms can be making supernormal profit, normal profit or an economic loss in the
short-run.
7. Whether a firm makes a profit or not in the short-run all depends on the type of market that the firm is
operating in, the position of the firms average cost curve and the market price that prevails.
However, in the long-run all firms operating in a perfectly competitive market will make normal profits
because of the fact that firms can freely enter and exit the market. For instance, if firms are making a profit in
the short-run then this triggers firms that are not currently producing in the market to enter as the presence of
supernormal profits lures and incentivises them to start producing. However, the decision for firms to enter
increases the supply of goods produced in that market and without an accompanying equal change in demand,
this creates excess supply in the market. The excess supply causes the price of the good to fall and as the price
determines the position of the perfectly elastic demand curve firms face, this causes the profit maximisation
point to fall closer to the average cost of production (which are assumed unchanged). This process of moving
down a firms marginal revenue curve causes the amount of profits accruing to each firm to fall. Firms keep
entering the market until eventually all supernormal profits have been eliminated and all firms are producing at
the minimum of the average cost curve, signalling normal profits. This means all transactions will take place at
the market equilibrium price and total output/consumption will be at the market equilibrium level. Below is an
example of this market adjustment:
8. This process works in reverse if in the short-run firms were making an economic loss - firms are incentivised
to leave to minimise their losses. In the case of normal profits being made in the short-run no change is made
to the market.
This means the result of all firms in the long-run under perfect competition are shown below:
9. This outcome is the most efficient market equilibrium that can be achieved because of the fact that there is no
deadweight loss triangle present unlike in other market structures e.g. a monopoly.
It creates the most efficient outcome because firms that operate in a perfectly competitive market are classed as
productively efficient in the long-run as they end up making normal profits and producing at the minimum of
the average cost curve.
Also most firms can be classed as allocatively efficient in the long-run as firms produce at the point where
P=MC. However, this only holds if firms are producing in a market with no externalities present. This is
because when there are externalities present, private costs and benefits do not equate to social costs and
benefits. If the marginal social benefit and costs do not equate then this means that consumer and producer
surplus cannot be maximised and this means there must be a better allocation of resources available in the
market.
However, despite perfect competition providing efficient results, one type of efficiency that is not achieved is
dynamic efficiency. This is because in order for firms to be incentivised to achieve dynamic efficiency they
need to make supernormal profit to enable them to undertake the investment required for the research and
development needed to innovate the production process. It is unlikely that this will be achieved in perfect
competition because the assumption of perfect knowledge across all firms means that firms can just replicate
any new products or new techniques developed in the production process, removing any competitive/cost
advantage this type of investment is meant to develop. Also the fact that firms cannot make supernormal profit
in the long run means that they will never be in a position to be able to protect the advantages of their
10. investment and will not be encourage to make the changes required. The fact that dynamic efficiency is not
achieved creates wider implications for the economy because it is investment that drives the long-run trend
growth rate and therefore if investment is stunted because of this form of competition, long-run growth will be
permanently revised at a lower level.
The final point to mention regarding perfect competition is the theoretical model can be used as a yardstick to
compare other market structures against. This is because in reality industries are never really perfectly
competitive, but by relaxing some of the assumptions of perfect competition it may mirror some types of
market structures (e.g. monopolistic competition) and therefore allow us to asses and evaluate those markets.
For instance, the closer an industry is to perfect competition, the closer it is to the efficiency results which
fosters improved services and products.
Marginal Cost (MC)
The cost of increasing production by one extra unit.
Below depicts an example of a firm's marginal costs associated with different levels of output produced. The
marginal cost curve has a 'tick' shape because for small levels of output the marginal cost falls due to
exploiting productivities and efficiencies. But as output becomes too large, production costs start to escalate
and this explains why very sharply for high levels of output the marginal cost curve rises.
11. Marginal cost/benefit curves
These are simply different labels for demand and supply curves. It is normal to use these labels for analysing
externalities.
12.
13. Average cost
The cost per unit of output. This is calculated by total cost divided by units of output. The table below shows
the calculation of the average cost per unit for a firm for different levels of output and costs.
Average cost curve
A curve drawn to connect the average costs of production at every level of output. The curve will be U shaped
and the lowest point will be the Pareto efficient point. This identifies the output producing the lowest average
cost (productively efficient output).
14. Below is a diagram to illustrate the basic shape of the average cost curve. The section of the graph in which
average costs are falling is when the firm is experiencing economies of scale and the red section of the graph is
when the firm is experiencing diseconomies of scale. Therefore as the graph illustrates firms should be aiming
to produce at the quantity that yields the minimum of this u-shaped curve i.e. producing too much leads to
excess costs, inefficiency and diseconomies of scale.
15. Average costs
The cost per unit of output. This is calculated by total cost/units of output.
Law of Diminishing Marginal Returns
A firm in the short-run will eventually experience diminishing marginal returns i.e. as the firm keeps on adding
a flexible factor (labour), the amount the additional resource can produce decreases.
Below is an example of how the law of diminishing marginal returns can be illustrated both graphically and
numerically. The marginal product is positive for each additional worker, which emphasises that each worker
is contributing to the level of output for the firm. But this marginal product starts increasing at a decreasing
rate after worker 2. This does not mean that any workers employed after worker 2 is less productive and less
efficient but just that the conditions in the workplace for this firm to absorb extra workers without additional
capital and infrastructure is restricting the amount of output future workers can make. For instance, if a bakery
shop keeps employing new bakers without increasing the number of ovens available for bakers to use will
mean that the value of each additional baker hired in terms of output will be lower, as each of the bakers are
having to queue up to use each of the ovens.
16. Therefore, given that this law exists this causes the marginal cost curve to have the shape that it has below.
This is because the marginal product is rising for the first extra workers hired and therefore the marginal cost is
low. But as the marginal product belonging to each worker begins to fall the marginal cost begins to rise as the
firm moves closer and closer towards full capacity.
17. Law of Diminishing Marginal Utility
This is an economic law that states that the marginal utility received decreases as a consumer buys more units
of a good. This happens because in the eyes of the consumers the value of the good diminishes for every extra
unit they buy e.g. a chocolate bar. However, this does not mean that consuming an extra unit does increase
total utility, just that it may not add as much utility as the previous units.
Below illustrates the declining utility for a consumer for every additional chocolate bar they consume but total
utility continues to increase.